Mastering Load Balancing Nginx: A Deep Dive for Senior DevOps Engineers
In the world of modern, distributed microservices, reliability and scalability are not features-they are existential requirements. As applications grow in complexity and user load spikes unpredictably, a single point of failure becomes a catastrophic liability. The solution is horizontal scaling, and the cornerstone of that solution is a robust load balancer.
For decades, Nginx has reigned supreme in the edge networking space. It offers unparalleled performance, making it the preferred tool for high-throughput environments. But simply pointing traffic at a group of servers isn’t enough. You need to understand the nuances of Load Balancing Nginx to ensure optimal distribution, fault tolerance, and session integrity.
This guide is designed for senior DevOps, MLOps, and SecOps engineers. We will move far beyond basic round-robin setups. We will dive deep into the architecture, advanced directives, and best practices required to build enterprise-grade, highly resilient load balancing solutions.

Phase 1: Core Architecture and Load Balancing Concepts
Before writing a single line of configuration, we must understand the fundamental concepts. Load balancers operate primarily at two layers: Layer 4 (L4) and Layer 7 (L7). Understanding this difference dictates which Nginx directives you must employ.
L4 vs. L7 Balancing: The Architectural Choice
Layer 4 (L4) Load Balancing operates at the transport layer (TCP/UDP). It simply distributes packets based on IP addresses and ports. It is fast, efficient, and requires minimal processing overhead. However, it is “blind” to the content of the request.
Layer 7 (L7) Load Balancing operates at the application layer (HTTP/HTTPS). This is where Nginx truly shines. L7 balancing allows you to inspect headers, cookies, URIs, and method types. This capability is critical for implementing advanced features like sticky sessions and content-based routing.
When performing Load Balancing Nginx, you are almost always operating at L7, allowing you to route traffic based on path (e.g., /api/v1/user goes to Service A, while /api/v2/ml goes to Service B).
Understanding the Upstream Block
The core mechanism for defining a group of backend servers in Nginx is the upstream block. This block acts as a virtual cluster definition, allowing Nginx to manage the pool of available backends independently of the main server block.
Within the upstream block, you define the IP addresses and ports of your backend servers. This structure is fundamental to any robust Load Balancing Nginx setup.
# Example Upstream Definition
upstream backend_api_group {
    # Define the servers in the pool
    server 192.168.1.10:8080;
    server 192.168.1.11:8080;
    server 192.168.1.12:8080;
}
Load Balancing Algorithms: Choosing the Right Strategy
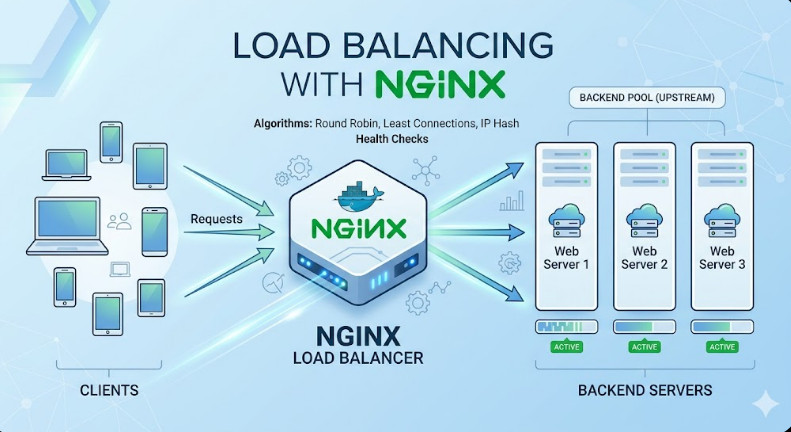
Nginx supports several algorithms, and selecting the correct one is crucial for maximizing resource utilization and preventing server overload.
- Round Robin (Default): This is the simplest method. It distributes traffic sequentially to each server in the pool (Server 1, Server 2, Server 3, Server 1, etc.). It assumes all backend servers have equal processing capacity.
- Least Connections: This is generally the preferred method for heterogeneous environments. Nginx actively monitors the number of active connections to each backend server and routes the incoming request to the server with the fewest current connections. This prevents a single, slow server from becoming a bottleneck.
- IP Hash: This algorithm uses a hash function based on the client’s IP address. This ensures that a specific client always connects to the same backend server, which is vital for maintaining stateful connections and implementing sticky sessions.
💡 Pro Tip: While Round Robin is easy to implement, always default to least_conn unless you have a specific requirement for client-based session persistence, in which case, use ip_hash.
Phase 2: Practical Implementation: Building a Resilient Load Balancer
Let’s put theory into practice. We will configure Nginx to act as a highly available L7 load balancer using the least_conn algorithm and implement basic health checks.
Step 1: Configuring the Upstream Pool
We start by defining our backend cluster in the http block of your nginx.conf.
http {
    # Define the Upstream group using the least_conn algorithm
    upstream backend_services {
        # Use least_conn for dynamic load distribution
        least_conn;

        # Server definitions (IP:Port)
        server 10.0.1.10:80;
        server 10.0.1.11:80;
        server 10.0.1.12:80;

        # Optional: Add server weights if some nodes are more powerful
        # server 10.0.1.13:80 weight=3;
    }

    # ... rest of the configuration
}
Step 2: Routing Traffic in the Server Block
Next, we link the upstream block to the main server block, ensuring that all incoming traffic hits the load balancer and is then distributed to the pool.
server {
    listen 80;
    server_name api.yourcompany.com;

    location / {
        # Proxy all requests to the defined upstream group
        proxy_pass http://backend_services;

        # Essential headers to pass client information to the backend
        proxy_set_header Host $host;
        proxy_set_header X-Real-IP $remote_addr;
        proxy_set_header X-Forwarded-For $proxy_add_x_forwarded_for;
        proxy_set_header X-Forwarded-Proto $scheme;
    }
}
This basic setup provides functional Load Balancing Nginx. However, this configuration is fragile. It assumes all servers are healthy and reachable.
Phase 3: Senior-Level Best Practices and Advanced Features
To elevate this setup from a basic load balancer to an enterprise-grade component, we must incorporate resilience, security, and state management.
1. Implementing Active Health Checks (The Resilience Layer)
The most critical omission in the basic setup is the lack of health checking. If a backend server crashes or becomes unresponsive, the load balancer must detect it and immediately remove it from the rotation.
Nginx provides the max_fails and fail_timeout directives within the upstream block to manage this gracefully.
max_fails: The number of times Nginx should fail to connect to a server before marking it as down.fail_timeout: The amount of time (in seconds) Nginx should wait before attempting to reconnect to the failed server.
Advanced Upstream Configuration with Health Checks:
upstream backend_services {
    least_conn;

    # Server 1: Will fail after 3 attempts, and be marked down for 60 seconds
    server 10.0.1.10:80 max_fails=3 fail_timeout=60s;

    # Server 2: Standard server
    server 10.0.1.11:80;

    # Server 3: Will fail after 5 attempts, and be marked down for 120 seconds
    server 10.0.1.12:80 max_fails=5 fail_timeout=120s;
}
2. Achieving Session Persistence (Sticky Sessions)
Many applications, especially those dealing with shopping carts or multi-step forms, are stateful. If a user’s initial request hits Server A, but the subsequent request hits Server B, the session state (stored locally on Server A) will be lost, resulting in a poor user experience.
To solve this, we use sticky sessions. The most reliable method is using the sticky module or, more commonly, the ip_hash directive in conjunction with a cookie.
Using ip_hash for Session Stickiness:
upstream backend_services {
    # Forces all requests from the same source IP to the same backend
    ip_hash;

    server 10.0.1.10:80;
    server 10.0.1.11:80;
    server 10.0.1.12:80;
}
💡 Pro Tip: While ip_hash is effective, it fails spectacularly when multiple users are behind a single corporate NAT gateway (which shares the same public IP). In such cases, you must implement cookie-based hashing or use a dedicated session store (like Redis) and route based on the session ID, rather than the IP.
3. SecOps Considerations: Rate Limiting and TLS Termination
For a senior-level deployment, security and resource protection are paramount.
A. Rate Limiting:
To protect your backend from DDoS attacks or poorly written client scripts, implement rate limiting. This restricts the number of requests a client can make within a given time window.
# Define the limit in http block
http {
    limit_req_zone $binary_remote_addr zone=mylimit:10m rate=5r/s;

    server {
        # ...
        location /api/ {
            # Only allow 5 requests per second per IP
            limit_req zone=mylimit burst=10 nodelay;
            proxy_pass http://backend_services;
        }
    }
}
B. TLS Termination:
In most production environments, Nginx handles TLS termination. This means Nginx decrypts the incoming HTTPS request using the SSL certificate and then forwards the plain HTTP traffic to the backend servers. This offloads the CPU-intensive task of encryption/decryption from your application servers, allowing them to focus purely on business logic.
4. Advanced Troubleshooting: Monitoring and Logging
A load balancer is only as good as its visibility. You must monitor:
- Upstream Status: Use Nginx’s built-in status module (
ngx_http_stub_status_module) to check the current load and health of the backend servers. - Error Rates: Monitor the
error.logfor repeated connection failures, which indicates a systemic issue (e.g., firewall changes or resource exhaustion). - Latency: Implement metrics collection (e.g., Prometheus/Grafana) to track the average response time from the load balancer to the backend pool.
Understanding these advanced topics is crucial for any professional looking to advance their career in areas like DevOps roles.
Summary Checklist for Load Balancing Nginx
| Feature | Directive/Concept | Purpose | Best Practice |
| Distribution | least_conn | Routes traffic to the server with the fewest active connections. | Use when backend requests vary significantly in processing time. |
| Resilience | max_fails, fail_timeout | Marks a server as unavailable for a set time after $n$ failures. | Set fail_timeout based on your application’s typical recovery time. |
| State Management | ip_hash | Maps client IP addresses to specific backend servers (session persistence). | Avoid when traffic is routed through large corporate proxies/NATs to prevent uneven load. |
| Security | limit_req | Implements the “leaky bucket” algorithm to rate-limit requests. | Combine with a shared memory zone (limit_req_zone) for global tracking. |
| Performance | TLS Termination | Handles the SSL handshake at the Nginx level before passing plain HTTP to backends. | Use modern ciphers and keep the ssl_session_cache active to reduce overhead. |
| Health Checks | health_check (Plus) | Proactively probes backends for health before they receive traffic. | Use a lightweight /health endpoint to minimize monitoring overhead. |
By mastering these advanced configurations, you transform Nginx from a simple web server into a sophisticated, multi-layered traffic management system. This deep knowledge of Load Balancing Nginx is what separates junior engineers from true infrastructure architects.