Introduction: The NGINX Ingress retirement is officially upon us, and if your pager hasn’t gone off yet, it will soon.
I’ve spent 30 years in the trenches of tech, migrating everything from mainframe spaghetti to containerized microservices.
Let me tell you, infrastructure deprecations never come at a convenient time.

Facing the NGINX Ingress Retirement Head-On
So, why does this matter? Because your traffic routing is the lifeblood of your application.
Ignoring the NGINX Ingress retirement is a guaranteed ticket to a 3 AM severity-one outage.
When the upstream maintainers pull the plug, security patches stop. Period.
Running unpatched ingress controllers on AWS is like leaving your front door wide open in a bad neighborhood.
We need a plan, and we need it executed flawlessly.
Check out our guide on [Internal Link: Securing Your EKS Clusters in 2026] for more background.
Understanding the AWS Landscape Post-Deprecation
Migrating away from a deprecated controller isn’t just a simple helm upgrade.
If you are running on Amazon Elastic Kubernetes Service (EKS), you have specific architectural choices to make.
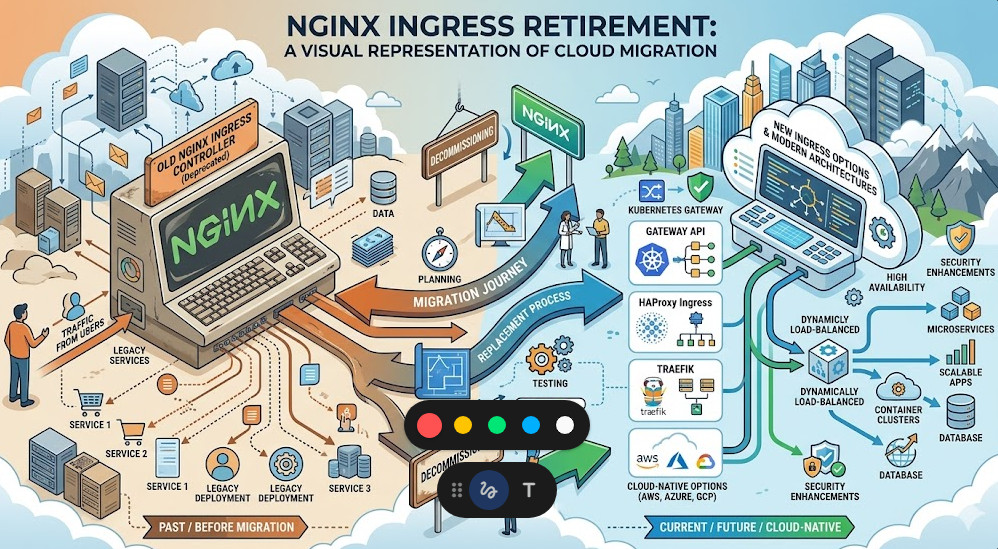
The NGINX Ingress retirement forces us to re-evaluate our entire edge routing strategy.
Do we stick with a community-driven NGINX fork? Or do we pivot entirely to AWS native tools?
I’ve seen teams try to rush this decision and end up with massive latency spikes.
Don’t be that team. Let’s break down the actual viable options for production workloads.
Option 1: The AWS Load Balancer Controller
If you want to reduce operational overhead, offloading to AWS native services is smart.
The AWS Load Balancer Controller provisions Application Load Balancers (ALBs) directly from your Kubernetes manifests.
This completely sidesteps the NGINX Ingress retirement by removing NGINX from the equation entirely.
Why is this good? Because AWS handles the patching, scaling, and high availability of the load balancer.
However, you lose some of the granular, regex-heavy routing rules that NGINX is famous for.
If your `ingress.yaml` looks like a novel of custom annotations, this might be a painful switch.
For deep dives into ALB capabilities, always reference the official AWS documentation.
Option 2: Transitioning to the Kubernetes Community Ingress-NGINX
Wait, isn’t NGINX retiring? Yes, but context matters.
The specific project tied to the NGINX Ingress retirement might be the F5 corporate version or an older deprecated API version.
The open-source `ingress-nginx` maintained by the Kubernetes project is still very much alive.
If you are migrating between these two, the syntax is similar but not identical.
Annotation prefixes often change. What used to be `nginx.org/` might now need to be `nginx.ingress.kubernetes.io/`.
Failing to catch these subtle differences will result in dead routes. I’ve learned this the hard way.
You can verify the latest supported annotations on the official ingress-nginx GitHub repository.
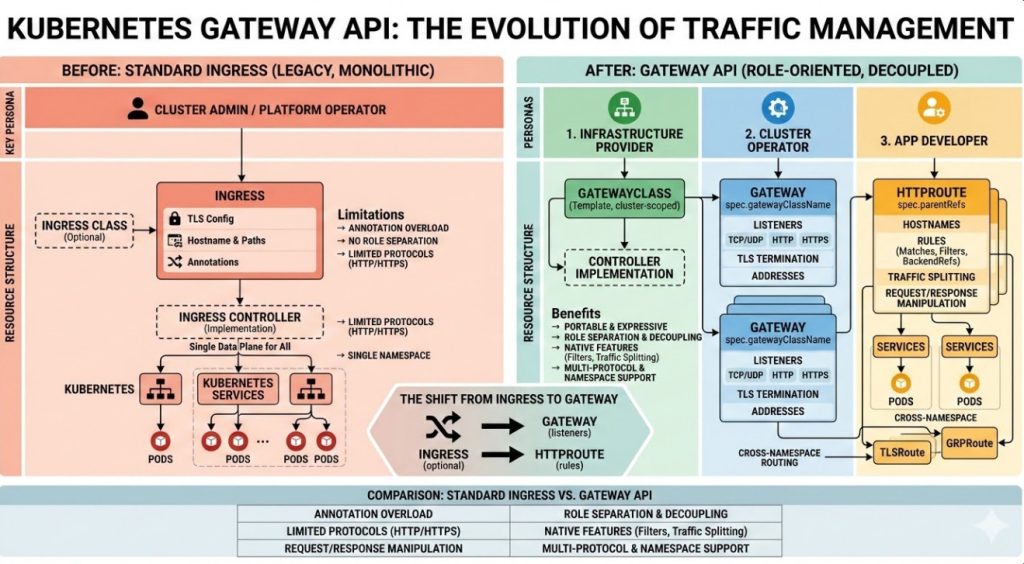
The Gateway API: Escaping the NGINX Ingress Retirement
Let’s talk about the future. Ingress is dead; long live the Gateway API.
If you are forced to refactor due to the NGINX Ingress retirement, why not leapfrog to the modern standard?
The Kubernetes Gateway API provides a much richer, role-oriented model for traffic routing.
It separates the infrastructure configuration from the application routing rules.
Platform teams can define the `Gateway`, while developers define the `HTTPRoute`.
It reduces friction and limits blast radius. It’s how we should have been doing it all along.
Here is a basic example of what a new `HTTPRoute` looks like compared to an old Ingress object:
apiVersion: gateway.networking.k8s.io/v1beta1
kind: HTTPRoute
metadata:
  name: store-route
  namespace: e-commerce
spec:
  parentRefs:
  - name: internal-gateway
  rules:
  - matches:
    - path:
        type: PathPrefix
        value: /store
    backendRefs:
    - name: store-v1
      port: 8080
Notice how clean that is? No messy annotation hacks required.
Your Pre-Flight Checklist for Migration
You don’t just rip out an ingress controller on a Tuesday afternoon.
Surviving the NGINX Ingress retirement requires meticulous planning.
Here is my battle-tested checklist before touching a production cluster:
- Audit current usage: Dump all existing Ingress resources. `kubectl get ingress -A -o yaml > backup.yaml`
- Analyze annotations: Use a script to parse out every unique annotation currently in use.
- Map equivalents: Find the exact equivalent for your new controller (ALB or Community NGINX).
- Check TLS certificates: Ensure AWS Certificate Manager (ACM) or cert-manager is ready for the new controller.
- Lower TTLs: Drop your DNS TTL to 60 seconds at least 24 hours before the cutover.
If you skip the DNS TTL step, your rollback plan is completely useless.
Executing the Cutover on AWS
The actual migration phase of the NGINX Ingress retirement is where adrenaline peaks.
My preferred method? The side-by-side deployment.
Never upgrade in place. Deploy your new ingress controller alongside the old one.
Give the new controller a different ingress class name, like `alb-ingress` or `nginx-v2`.
Deploy duplicate Ingress resources pointing to the new class.
Now, you have two load balancers routing traffic to the same backend pods.
Test the new load balancer endpoint thoroughly using curl or Postman.
Once validated, swing the DNS CNAME record from the old load balancer to the new one.
Monitor the old load balancer. Once connections drop to zero, you can safely decommission the deprecated controller.
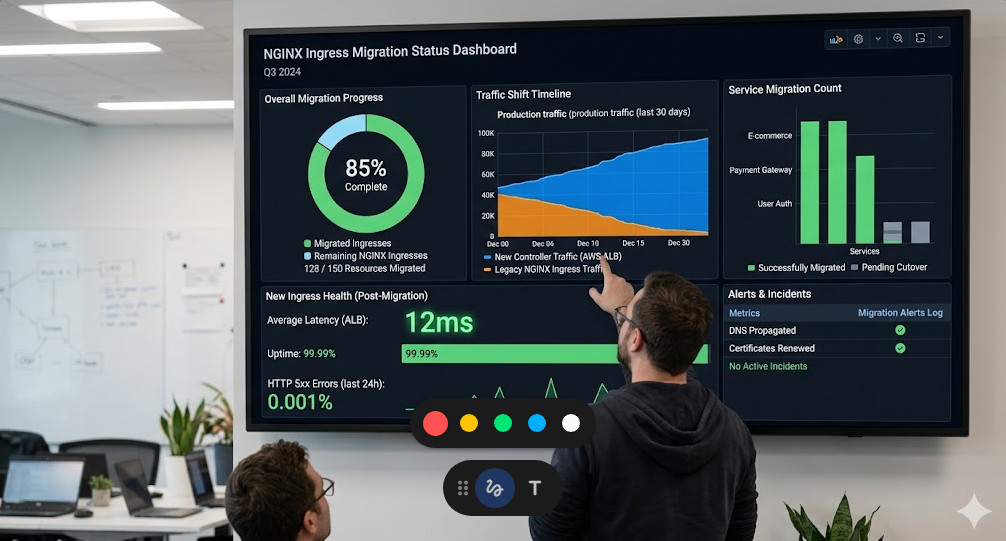
Monitoring and Performance Tuning
You swapped the DNS, and the site loaded. Are we done? Absolutely not.
The post-mortem phase of the NGINX Ingress retirement is critical.
Different controllers handle connection pooling, keep-alives, and timeouts differently.
You need to be glued to your Datadog, Prometheus, or CloudWatch dashboards.
Look for subtle 502 Bad Gateway or 504 Gateway Timeout errors.
Often, the AWS Load Balancer idle timeout will clash with your backend application timeout.
Always ensure your application’s keep-alive timeout is strictly greater than the load balancer’s timeout.
If you don’t adjust this, the ALB will drop connections that the backend still thinks are active.
These are the hidden landmines that only experience teaches you.

The Real Cost of Tech Debt
Let’s have an honest moment here about infrastructure lifecycle.
The NGINX Ingress retirement isn’t an isolated incident; it’s a symptom.
We build these incredibly complex Kubernetes environments and expect them to remain static.
The reality is that cloud-native infrastructure rots if you don’t actively maintain it.
Every deprecated API, every retired controller, is a tax we pay for agility.
By automating your deployments and keeping configurations as code, you lower that tax.
Next time a major component is deprecated, you won’t panic. You’ll just update a Helm chart.
For more detailed reading on the original announcement that sparked this panic, you can review the link provided: Original Migration Report.
FAQ Section
- What exactly is the NGINX Ingress retirement? It refers to the end-of-life and deprecation of specific legacy versions or specific forks of the NGINX ingress controller for Kubernetes.
- Will my AWS EKS cluster go down immediately? No. Existing deployments will continue to run, but they will no longer receive security patches, leaving you vulnerable to exploits.
- Is the AWS Load Balancer Controller a 1:1 replacement? No. While it routes traffic efficiently using AWS ALBs, it lacks some of the complex, regex-based routing capabilities native to NGINX.
- Should I use Gateway API instead? Yes, if your organization is ready. It is the modern standard for Kubernetes traffic routing and offers better role separation.
- How long does a migration take? With proper testing, expect to spend 1-2 weeks auditing configs, deploying side-by-side, and executing a DNS cutover.
Conclusion: The NGINX Ingress retirement is a perfect opportunity to modernize your AWS infrastructure. Don’t view it as a chore; view it as a chance to clean up years of technical debt, implement the Gateway API, and sleep much better at night. Execute the side-by-side migration, watch those timeouts, and keep building resilient systems. Thank you for reading the DevopsRoles page!