Mastering the Container Stack: Advanced Guide to Setup Docker Windows for Enterprise DevOps
In the modern software development lifecycle, environment drift remains one of the most persistent and costly challenges. Whether you are managing complex microservices, deploying sensitive AI models, or orchestrating multi-stage CI/CD pipelines, the promise of “it works on my machine” must be replaced with guaranteed, reproducible consistency.
Containerization, powered by Docker, has become the foundational layer of modern infrastructure. However, simply running docker run hello-world is a trivial exercise. For senior DevOps, MLOps, and SecOps engineers, the true challenge lies not in using Docker, but in understanding the underlying architecture, optimizing the Setup Docker Windows environment for performance, and hardening it against runtime vulnerabilities.
This comprehensive guide moves far beyond basic tutorials. We will deep-dive into the architectural components, provide a robust, step-by-step implementation guide, and, most critically, equip you with the senior-level best practices required to treat your container environment as a first-class citizen of your security and reliability posture.
Phase 1: Core Architecture and The Windows Containerization Paradigm
Before we touch the installation wizard, we must understand why the Setup Docker Windows process is complex. Docker does not simply “run on” Windows; it leverages the operating system’s virtualization capabilities to provide a Linux kernel environment, which is where the containers actually execute.
Virtualization vs. Containerization
It is vital to distinguish between these concepts. Traditional Virtual Machines (VMs) virtualize the entire hardware stack, including the CPU, memory, and network interface. This is resource-intensive but offers complete isolation.
Containers, conversely, virtualize the operating system layer. They share the host OS kernel but utilize Linux kernel namespaces and cgroups (control groups) to isolate processes, file systems, and network resources. This results in near-bare-metal performance and significantly lower overhead.
The Role of WSL 2 in Modern Setup
Historically, setting up Docker on Windows was fraught with Hyper-V conflicts and performance bottlenecks. The modern, enterprise-grade solution is the integration of Windows Subsystem for Linux (WSL 2).
WSL 2 provides a lightweight, highly efficient virtual machine backend that exposes a genuine Linux kernel to Windows applications. This architectural shift is crucial because it allows Docker Desktop to run the container engine within a fully optimized Linux environment, solving many of the compatibility headaches associated with older Windows kernel interactions.
When you successfully Setup Docker Windows using WSL 2, you are not just installing software; you are configuring a sophisticated, multi-layered virtual networking and process isolation stack.

Phase 2: Practical Implementation – Achieving a Robust Setup
While the theory is complex, the practical steps to get a functional, performant environment are straightforward. We will focus on the modern, recommended path.
Step 1: Prerequisite Check – WSL 2 Activation
The absolute first step is ensuring your Windows host machine is ready to support the necessary Linux kernel features.
- Enable WSL: Open an elevated PowerShell prompt and run the necessary commands to enable the subsystem.
- Install Kernel: Ensure the latest WSL 2 kernel update package is installed.
wsl --install
This command handles the bulk of the setup, installing the necessary components and setting the default version to WSL 2.
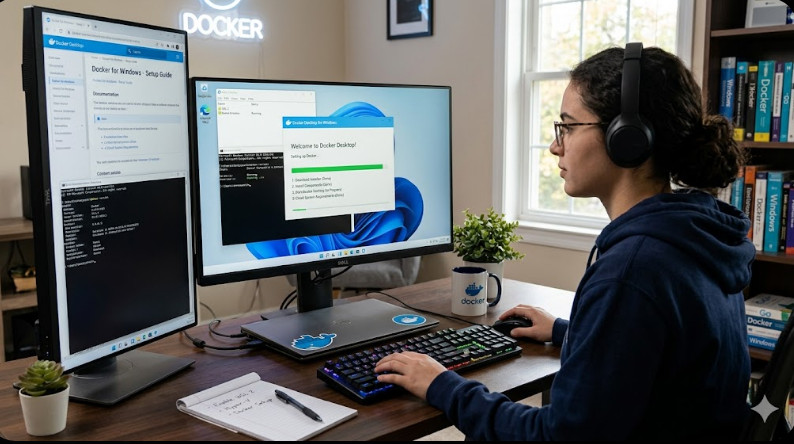
Step 2: Installing Docker Desktop
With WSL 2 ready, the next step is the installation of Docker Desktop. During the installation process, ensure that the configuration explicitly points to using the WSL 2 backend.
Docker Desktop manages the underlying virtual machine, providing the necessary daemon and CLI tools. It automatically handles the integration, making the container runtime available to the Windows environment.
Step 3: Verification and Initial Test
After installation, always verify the setup integrity. A simple test confirms that the container engine is running and communicating correctly with the WSL 2 backend.
docker run --rm alpine ping -c 3 8.8.8.8
If this command executes successfully, you have achieved a stable, high-performance Setup Docker Windows environment, ready for development and production workloads.
💡 Pro Tip: When running Docker on Windows for MLOps, never rely solely on the default resource allocation. Immediately navigate to Docker Desktop Settings > Resources and allocate dedicated, measured CPU cores and RAM. Under-provisioning resources is the single biggest performance killer in containerized AI workflows.
Phase 3: Senior-Level Best Practices and Hardening
This phase separates the basic user from the seasoned DevOps architect. For senior engineers, the goal is not just to run containers, but to govern them.
Networking Deep Dive: Beyond the Default Bridge
The default bridge network provided by Docker is excellent for local development. However, in enterprise scenarios, you must understand and configure advanced networking modes:
- Host Networking: When a container uses
network: host, it bypasses the Docker network stack entirely and uses the host machine’s network interfaces directly. This eliminates network latency but sacrifices container isolation, making it a significant security consideration. Use this only when absolute performance is critical (e.g., high-frequency trading simulations). - Custom Bridge Networks: Always use custom user-defined bridge networks (e.g.,
docker network create my_app_net). This allows you to define explicit network policies, enabling service discovery via DNS resolution within the container cluster, which is fundamental for microservices architecture.
Security Context and Image Hardening (SecOps Focus)
A container is only as secure as its image. Simply building an image is insufficient; it must be hardened.
- Rootless Containers: Always aim to run containers as a non-root user. By default, many images run the primary process as
rootinside the container. This is a major security vulnerability. Use theUSERdirective in yourDockerfileto switch to a dedicated, low-privilege user ID (UID). - Seccomp Profiles: Use Seccomp (Secure Computing Mode) profiles to restrict the system calls (syscalls) that a container can make to the host kernel. By limiting syscalls, you drastically reduce the attack surface area, mitigating risks even if the container process is compromised.
- Image Scanning: Integrate image scanning tools (like Clair or Trivy) into your CI/CD pipeline. Never push an image to a registry without a vulnerability scan.
Advanced Orchestration and Volume Management
For large-scale applications, you will transition from simple docker run commands to Docker Compose and eventually Kubernetes.
When using docker-compose.yaml, pay close attention to volume mounts. Instead of simple bind mounts (./data:/app/data), use named volumes (my_data:/app/data). Named volumes are managed by Docker, providing better data persistence guarantees and isolation from the host filesystem structure, which is critical for stateful services like databases.
Example: Multi-Service Compose File
This snippet demonstrates defining two services (a web app and a database) on a custom network, ensuring they can communicate securely and reliably.
version: '3.8'
services:
  web:
    image: my_app:latest
    ports:
      - "80:80"
    depends_on:
      - db
    networks:
      - backend_net
  db:
    image: postgres:15-alpine
    environment:
      POSTGRES_PASSWORD: ${DB_PASSWORD}
    volumes:
      - db_data:/var/lib/postgresql/data
    networks:
      - backend_net

networks:
  backend_net:
    driver: bridge

volumes:
  db_data:
The MLOps Integration Layer
When containerizing ML models, the requirements change. You are not just running an application; you are running a computational graph that requires specific dependencies (CUDA, optimized libraries, etc.).
- Dependency Pinning: Pin every single dependency version (Python, NumPy, PyTorch, etc.) within a
requirements.txtorenvironment.ymlfile. - Multi-Stage Builds: Use multi-stage builds in your
Dockerfile. Use one stage (e.g.,python:3.10-slim) for compilation and dependency installation, and a second, minimal stage (e.g.,alpine) for the final runtime artifact. This dramatically reduces the final image size, minimizing the attack surface.
💡 Pro Tip: For complex AI/ML deployments, consider using specialized container runtimes like Singularity or Apptainer alongside Docker. While Docker is excellent for development, these runtimes are often preferred in highly secured, regulated HPC (High-Performance Computing) environments because they enforce stricter separation and compatibility with institutional security policies.
Conclusion: Mastering the Container Lifecycle
The ability to effectively Setup Docker Windows is merely the entry point. True mastery involves understanding the interplay between the host OS, the WSL 2 kernel, the container runtime, and the application’s security context.
By treating containerization as a full-stack engineering discipline—focusing equally on networking, security hardening, and resource optimization—you move beyond simply deploying code. You are building resilient, portable, and auditable infrastructure.
For those looking to deepen their knowledge of container orchestration and advanced DevOps roles, resources like this guide on DevOps roles can provide valuable context.
If you found this deep dive helpful, we recommend reviewing foundational materials. For a comprehensive, beginner-to-advanced understanding of the initial setup, you can reference excellent community resources like this detailed guide on learning Docker from scratch.