Mastering Kubernetes Security Context for Secure Container Workloads
In the rapidly evolving landscape of cloud-native infrastructure, container orchestration platforms like Kubernetes are indispensable. However, this immense power comes with commensurate security responsibilities. Misconfigured workloads are a primary attack vector. Understanding and correctly implementing the Kubernetes Security Context is not merely a best practice; it is a foundational requirement for any production-grade, secure deployment. This guide will take you deep into the mechanics of securing your pods using this critical feature.
The Kubernetes Security Context allows granular control over the privileges and capabilities a container process possesses inside the pod. It dictates everything from the user ID running the process to the network capabilities it can utilize. Mastering the Kubernetes Security Context is key to achieving a true Zero Trust posture within your cluster.
Phase 1: High-level Concepts & Core Architecture of Security Context
To appreciate how to secure workloads, we must first understand what we are securing. A container, by default, runs with a set of permissions inherited from the underlying container runtime and the Kubernetes API server. This default posture is often overly permissive.
What Exactly is the Kubernetes Security Context?
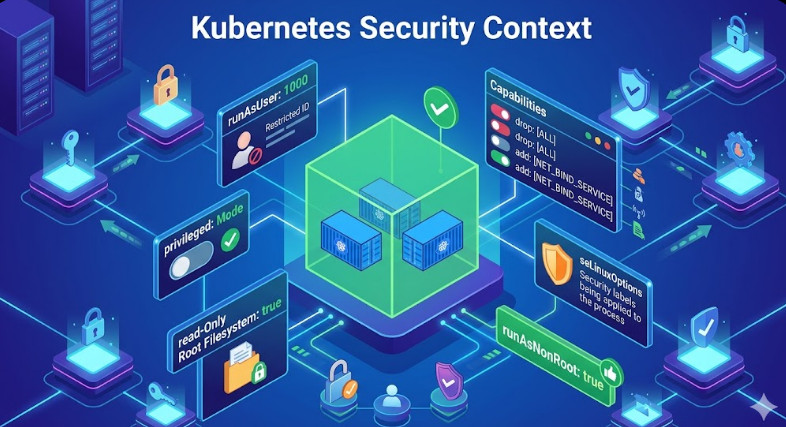
The Kubernetes Security Context is a field within the Pod or Container specification that allows you to inject security parameters. It doesn’t magically fix all security issues, but it provides the necessary knobs—like runAsUser, readOnlyRootFilesystem, and seccompProfile—to drastically reduce the attack surface area.
Conceptually, it operates by modifying the underlying Linux kernel capabilities and the process execution environment for the container. When you set a strict context, you are telling the Kubelet and the container runtime (like containerd) to enforce these rules before the container process even starts.
Key Components Under the Hood
runAsUser/runAsGroup: These fields enforce User ID (UID) and Group ID (GID) mapping. Running as a non-root user is the single most impactful change you can make. If an attacker compromises a process running as UID 1000, the blast radius is contained to what that user can access, rather than the root user (UID 0).seLinuxOptions/AppArmor: These integrate with the underlying Mandatory Access Control (MAC) systems of the host OS. They provide kernel-level policy enforcement, restricting system calls even if the process gains root privileges within the container namespace.readOnlyRootFilesystem: This is a powerful guardrail. By setting this totrue, you ensure that the container’s primary filesystem cannot be written to. Any attempt to modify binaries or write to configuration files will result in an immediate runtime error, thwarting many common exploitation techniques.
💡 Pro Tip: Never rely solely on network policies. Always couple network segmentation with strict Kubernetes Security Context definitions. Think of it as defense-in-depth, where context hardening is the first, most crucial layer.
Understanding Pod vs. Container Context
It’s vital to distinguish between the Pod level and the Container level context.
- Pod Context: Applies settings to the entire pod, affecting all containers within it (e.g., setting a default
serviceAccountName). - Container Context: Applies settings specifically to one container within the pod (e.g., setting a unique
runAsUserfor a sidecar vs. the main application). This allows for heterogeneous security profiles within a single workload.
This architectural separation allows for fine-grained control, which is the hallmark of advanced DevSecOps pipelines.

Phase 2: Step-by-Step Practical Implementation
Implementing these controls requires meticulous YAML definition. We will walk through hardening a standard deployment using a Deployment manifest.
Example 1: Basic Non-Root Execution
This snippet demonstrates the absolute minimum required to prevent running as root. We assume the container image has a non-root user defined or that we can use a specific UID.
apiVersion: apps/v1
kind: Deployment
metadata:
  name: secure-app
spec:
  template:
    spec:
      containers:
      - name: my-container
        image: myregistry/secure-app:v1.2
        securityContext:
          runAsNonRoot: true
          runAsUser: 1000 # Must match a user existing in the image
          readOnlyRootFilesystem: true
        # ... other settings
Analysis: By setting runAsNonRoot: true, Kubernetes will refuse to start the container if it cannot guarantee non-root execution. The combination with readOnlyRootFilesystem makes the container highly resilient to write-based attacks.
Example 2: Advanced Capability Dropping and Volume Security
For maximum hardening, we must also manage Linux capabilities and volume mounting. We use securityContext at the pod level to enforce mandatory policies.
apiVersion: v1
kind: Pod
metadata:
  name: hardened-pod
spec:
  securityContext:
    runAsNonRoot: true
    runAsUser: 1000
    fsGroup: 1000 # Ensures volume ownership
  containers:
  - name: main-app
    image: myregistry/secure-app:v1.2
    securityContext:
      capabilities:
        drop:
        - ALL # Drop all Linux capabilities by default
      readOnlyRootFilesystem: true
    volumeMounts:
    - name: config-volume
      mountPath: /etc/config
  volumes:
  - name: config-volume
    emptyDir: {}
Deep Dive: Notice the capabilities.drop: [ALL]. This is crucial. By default, containers might retain capabilities like NET_ADMIN or SYS_ADMIN. Dropping all capabilities forces the container to operate with the bare minimum set of privileges required for its function. This is a cornerstone of implementing Kubernetes Security Context best practices.
💡 Pro Tip: When dealing with sensitive secrets, never mount them as environment variables. Instead, use volumeMounts with secret types and ensure the consuming container has read-only access to that volume mount.
Phase 3: Best Practices for SecOps/AIOps/DevOps
Achieving robust security is not a one-time configuration; it’s a continuous process integrated into the CI/CD pipeline. This is where the DevOps mindset meets SecOps rigor.
1. Policy Enforcement with Admission Controllers
Manually applying these settings is error-prone. The industry standard is to use Policy Engines like Kyverno or Gatekeeper (OPA). These tools act as Admission Controllers, intercepting every resource creation request to the API server. They can validate that every deployment manifest includes a minimum required Kubernetes Security Context configuration (e.g., runAsNonRoot: true).
This automation ensures that developers cannot accidentally deploy insecure workloads, effectively shifting security left into the GitOps workflow.
2. Integrating with Service Mesh and Network Policies
While the Kubernetes Security Context handles process privileges, a Service Mesh (like Istio) handles network privileges. They must work together. Use NetworkPolicies to restrict ingress/egress traffic to only necessary ports and IPs, and use the Security Context to restrict what the process can do if it successfully connects to that allowed endpoint.
3. Runtime Security Monitoring (AIOps Integration)
Even with perfect manifests, zero-day vulnerabilities exist. This is where AIOps and runtime security tools come in. Tools monitoring the container syscalls can detect deviations from the established baseline defined by your Kubernetes Security Context. For example, if a process running as UID 1000 suddenly attempts to execute a shell (/bin/bash), a runtime monitor should flag this as anomalous behavior, even if the initial context allowed it.
This layered approach—Policy-as-Code (Admission Control) $\rightarrow$ Context Hardening (Security Context) $\rightarrow$ Runtime Monitoring (AIOps)—is the gold standard for securing modern applications. If you are looking to deepen your knowledge on automating these complex pipelines, explore advanced DevOps/AI tech concepts.
Summary Checklist for Hardening
| Feature | Recommended Setting | Security Benefit | Priority |
| :— | :— | :— | :— |
| runAsNonRoot | true | Prevents root process execution. | Critical |
| readOnlyRootFilesystem | true | Thwarts file system tampering. | Critical |
| capabilities.drop | ALL | Minimizes kernel attack surface. | High |
| seccompProfile | Custom/Runtime | Restricts allowed syscalls. | High |
| Policy Enforcement | OPA/Kyverno | Guarantees consistent application.
| Medium |
By systematically applying the Kubernetes Security Context across all namespaces, you move from a posture of ‘trust but verify’ to one of ‘never trust, always verify.’ Mastering the Kubernetes Security Context is non-negotiable for enterprise-grade cloud deployments. Keep revisiting these core concepts to stay ahead of emerging threats, solidifying your expertise in Kubernetes Security Context management.