

I still remember the first time I realized the importance of Optimizing Slow Database Queries. It was 3:00 AM on a Saturday.
My pager (yes, we used pagers back then) was screaming because the main transactional database had locked up.
The CPU was pegged at 100%. The disk I/O was thrashing so hard I thought the server rack was going to take flight.
The culprit? A single, poorly written nested join that scanned a 50-million-row table without an index.
If you have been in this industry as long as I have, you know that Optimizing Slow Database Queries isn’t just a “nice to have.”
It is the difference between a peaceful weekend and a post-mortem meeting with an angry CTO.
In this guide, I’m going to skip the fluff. We are going to look at how to use native Linux utilities and open-source tools to identify and kill these performance killers.

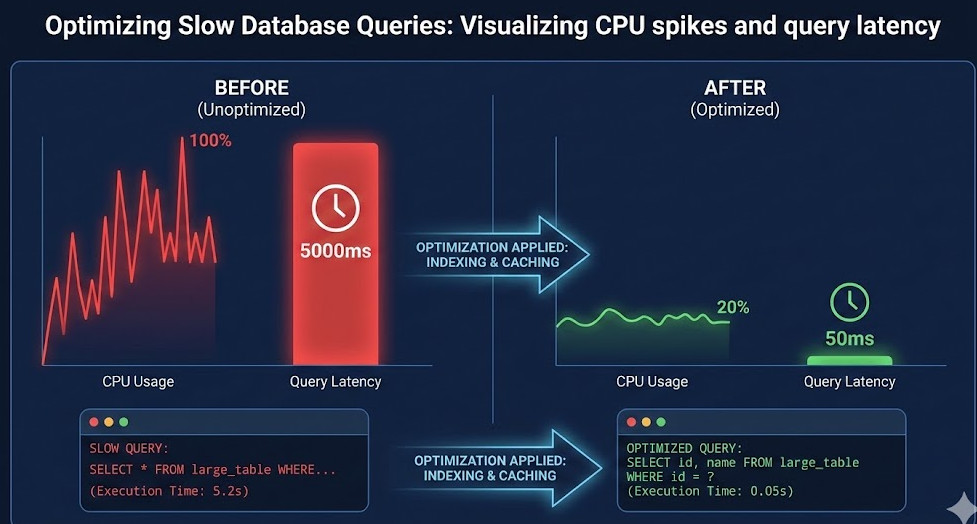
Table of Contents
- 1 Why Optimizing Slow Database Queries is Your #1 Priority
- 2 The Linux Toolkit for Diagnosing Latency
- 3 Identify the Culprit: The Slow Query Log
- 4 Using EXPLAIN to Dissect Logic
- 5 Open Source Tools to Automate Optimization
- 6 Advanced Strategy: Caching and Archiving
- 7 Common Pitfalls When Tuning
- 8 Conclusion
Why Optimizing Slow Database Queries is Your #1 Priority
I’ve seen too many developers throw hardware at a software problem.
They see a slow application, so they upgrade the AWS instance type.
“Throw more RAM at it,” they say.
That might work for a week. But eventually, unoptimized queries will eat that RAM for breakfast.
Optimizing Slow Database Queries is about efficiency, not just raw power.
When you ignore query performance, you introduce latency that ripples through your entire stack.
Your API timeouts increase. Your frontend feels sluggish. Your users leave.
And frankly, it’s embarrassing to admit that your quad-core server is being brought to its knees by a `SELECT *`.
The Linux Toolkit for Diagnosing Latency
Before you even touch the database configuration, look at the OS.
Linux tells you everything if you know where to look. When I start Optimizing Slow Database Queries, I open the terminal first.
1. Top and Htop
It sounds basic, but `top` is your first line of defense.
Is the bottleneck CPU or Memory? If your `mysqld` or `postgres` process is at the top of the list with high CPU usage, you likely have a complex calculation or a sorting issue.
If the load average is high but CPU usage is low, you are waiting on I/O.
2. Iostat: The Disk Whisperer
Database queries live and die by disk speed.
Use `iostat -x 1` to watch your disk utilization in real-time.
$ iostat -x 1
avg-cpu:  %user   %nice %system %iowait  %steal   %idle
           10.50    0.00    2.50   45.00    0.00   42.00

Device:         rrqm/s   wrqm/s     r/s     w/s   rsec/s   wsec/s avgrq-sz avgqu-sz   await r_await w_await  svctm  %util
sda               0.00     0.00  150.00   50.00  4096.00  2048.00    30.72     2.50   12.50   10.00   15.00   4.00  80.00
See that `%iowait`? If it’s high, your database is trying to read data faster than the disk can serve it.
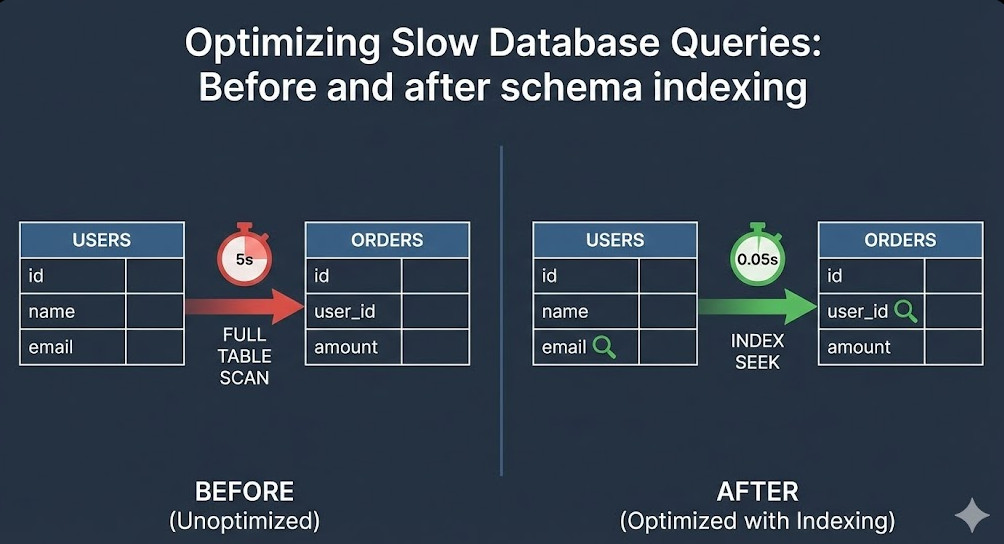
This usually implies you are doing full table scans instead of using indexes.
Optimizing Slow Database Queries often means reducing the amount of data the disk has to read.
Identify the Culprit: The Slow Query Log
You cannot fix what you cannot see.
Every major database engine has a slow query log. Turn it on.
For MySQL/MariaDB, it usually looks like this in your `my.cnf`:
slow_query_log = 1
slow_query_log_file = /var/log/mysql/mysql-slow.log
long_query_time = 2
This captures any query taking longer than 2 seconds.
Once you have the log, don’t read it manually. You aren’t a robot.
Use tools like `pt-query-digest` from the Percona Toolkit.
This tool is invaluable for Optimizing Slow Database Queries because it groups similar queries and shows you the aggregate impact.
Using EXPLAIN to Dissect Logic
Once you isolate a bad SQL statement, you need to understand how the database executes it.
This is where `EXPLAIN` comes in.
Running `EXPLAIN` before a query shows you the execution plan.
Here is a simplified example of what you might see:
EXPLAIN SELECT * FROM users WHERE email = 'test@example.com';

+----+-------------+-------+------+---------------+------+---------+------+-------+-------------+
| id | select_type | table | type | possible_keys | key  | key_len | ref  | rows  | Extra       |
+----+-------------+-------+------+---------------+------+---------+------+-------+-------------+
|  1 | SIMPLE      | users | ALL  | NULL          | NULL | NULL    | NULL | 50000 | Using where |
+----+-------------+-------+------+---------------+------+---------+------+-------+-------------+
Look at the `type` column. It says `ALL`.
That means a Full Table Scan. It checked 50,000 rows to find one email.
That is a disaster. Optimizing Slow Database Queries in this case is as simple as adding an index on the `email` column.
Open Source Tools to Automate Optimization
I love the command line, but sometimes you need a dashboard.
There are fantastic open-source tools that visualize performance data for you.
1. PMM (Percona Monitoring and Management)
PMM is free and open-source. It hooks into your database and gives you Grafana dashboards out of the box.
It helps in Optimizing Slow Database Queries by correlating query spikes with system resource usage.
2. PgHero
If you are running PostgreSQL, PgHero is a lifesaver.
It instantly shows you unused indexes, duplicate indexes, and your most time-consuming queries.
Advanced Strategy: Caching and Archiving
Sometimes the best way to optimize a query is to not run it at all.
If you are Optimizing Slow Database Queries for a report that runs every time a user loads a dashboard, ask yourself: does this data need to be real-time?
Caching: Use Redis or Memcached to store the result of expensive queries.
Archiving: If your table has 10 years of data, but you only query the last 3 months, move the old data to an archive table.
Smaller tables mean faster indexes and faster scans.
You can read more about database architecture on Wikipedia’s Database Optimization page.
Common Pitfalls When Tuning
I have messed this up before, so learn from my mistakes.
- Over-indexing: Indexes speed up reads but slow down writes. Don’t index everything.
- Ignoring the Network: Sometimes the query is fast, but the network transfer of 100MB of data is slow. Select only the columns you need.
- Restarting randomly: Restarting the database clears the buffer pool (cache). It might actually make things slower initially.

Conclusion
Optimizing Slow Database Queries is a continuous process, not a one-time fix.
As your data grows, queries that were once fast will become slow.
Keep your slow query logs on. Monitor your disk I/O.
And for the love of code, please stop doing `SELECT *` in production.
Master these Linux tools, and you won’t just improve performance.
You will finally get to sleep through the night. Thank you for reading the DevopsRoles page!