Step by step Install JDK on CentOS

In this tutorial, How to Install JDK on CentOS step by step. How to switch between JDK 7 and JDK 8?

Precondition

  1. Open the terminal and log in as root or you use sudo before each command with another user.
  2. Working on a Linux system operating: Centos/REHL

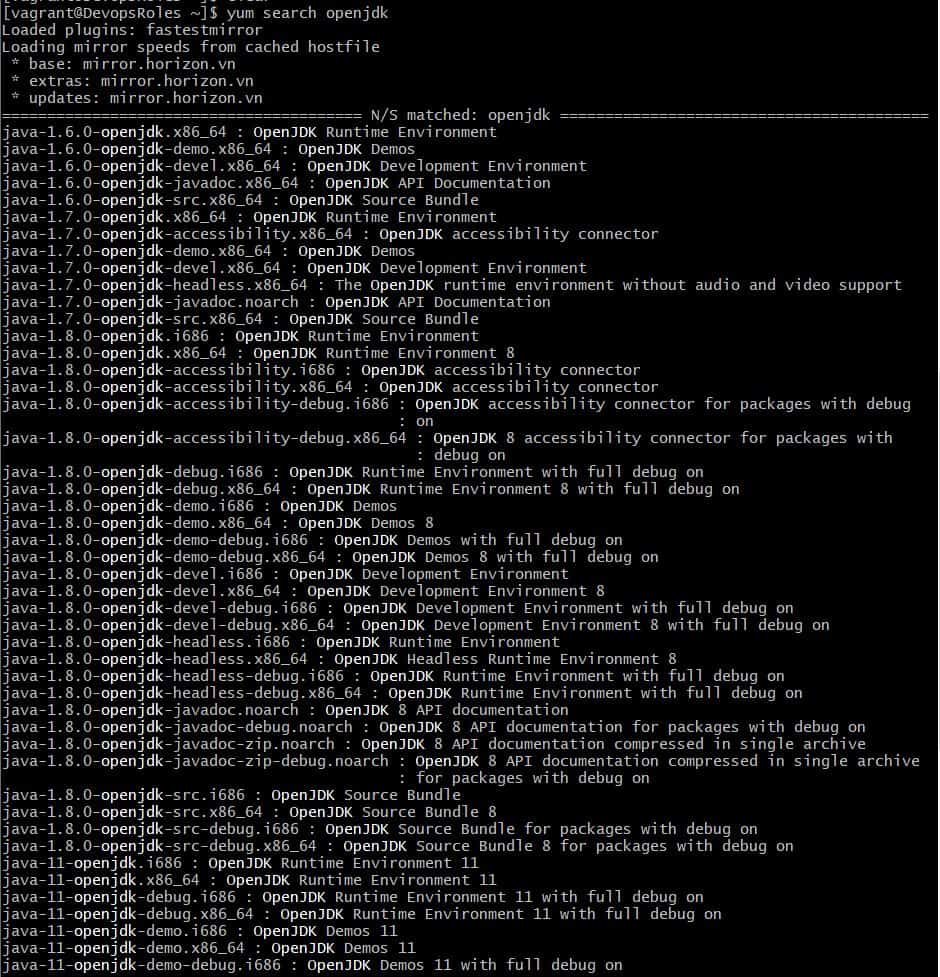
Search for JDK on CentOS

You use the command below to search the packages

$ yum search openjdk

The output terminal console as below

Install JDK 1.8

$ sudo yum install java-1.8.0-openjdk

Confirmation is complete when the installed Java version is displayed.
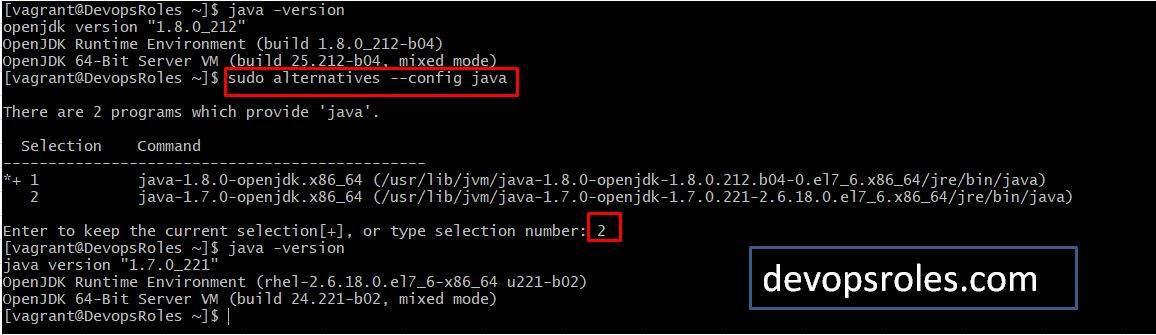
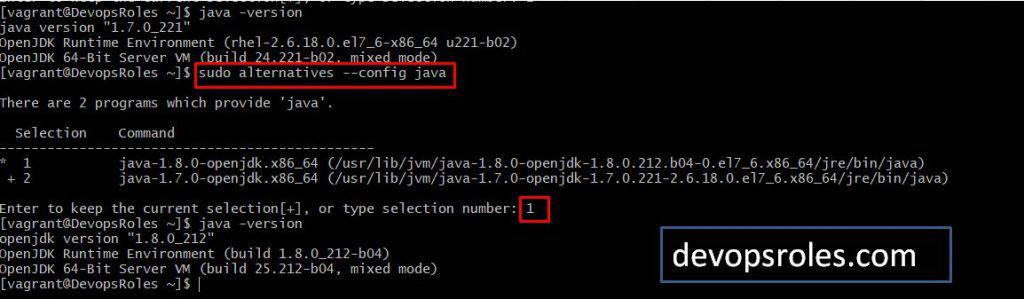
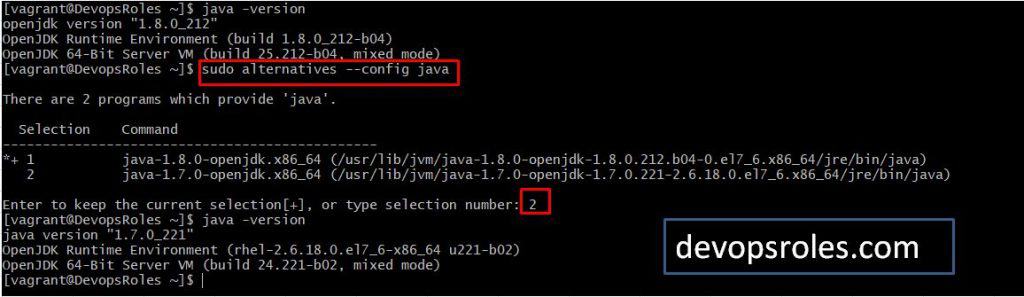
$ java --version
# Output
# openjdk version "1.8.0_212"
# OpenJDK Runtime Environment (build 1.8.0_212-b04)
# OpenJDK 64-Bit Server VM (build 25.212-b04, mixed mode)

How to switch JDK 7 to JDK 8

Use the command “sudo alternatives –config java” to switch to JDK.

How to switch JDK 8 to JDK 7

Conclusion

Through the article,  How to Install JDK on CentOS step by step. How to switch between JDK 7 and JDK 8? as above. I hope will this your helpful. Thank you for reading the DevopsRoles page!

Creating a Dockerfile step by step Instructions

Introduction

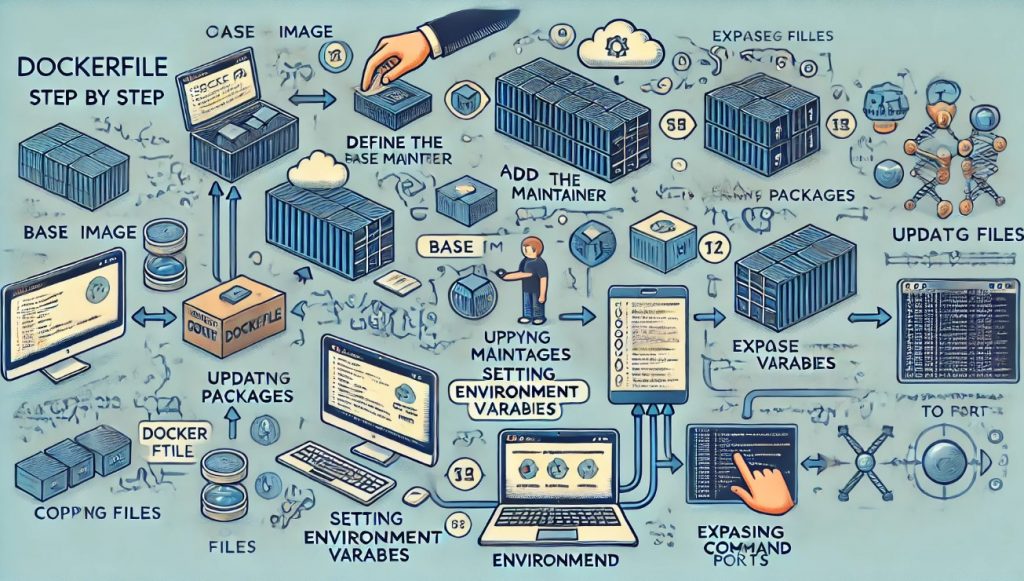
Creating efficient and reliable Docker images starts with a well-crafted Dockerfile step by step. In this article, we will provide a step-by-step guide to writing Dockerfiles, covering essential commands, best practices, and tips to optimize your Docker workflow. Whether you are new to Docker or looking to enhance your skills, this comprehensive guide will help you create Dockerfiles that streamline your development and deployment processes. For a detailed walkthrough, visit Dockerfile Step-by-Step.

Docker Image command

  • shows all images: docker images
  • creates an image from Dockerfile: docker build
  • creates an image from a tarball: docker import
  • turns container filesystem into tarball archive stream to STDOUT: docker export
  • loads an image from a tar archive as STDIN, including images and tags (as of 0.7): docker load
  • saves an image to a tar archive stream to STDOUT with all parent layers, tags & versions (as of 0.7): docker save
  • removes an image: docker rmi
  • tags an image to a name (local or registry): docker tag
  • shows the history of the image: docker history
  • creates an image from a container, Pausing it temporarily if it is running: docker commit

Dockerfile step by step

What is Dockerfile?

A Dockerfile is a text document that contains all the commands a user.

FROM, RUN, CMD in Dockerfile

Example Dockerfile for installing the Nginx web server.

FROM centos:7
RUN yum install -y nginx
CMD ["nginx", "-g", "daemon off;"]

Docker shell command line

docker build -t test/nginx:v1 .
docker run -it --rm -p 80:80 test/nginx:v1

Docker build cache

After each build step, Docker takes a snapshot of the resulting image. You can force a rebuild with docker build –no-cache

Docker JSON syntax

Most Dockerfile arguments

Plain string format:

RUN yum install -y nginx

JSON format list:

RUN ["yum", "install", "-y", "nginx"]

COPY, ENV, EXPOSE in Dockerfile

Example Dockerfile

FROM centos:7
RUN yum update -y
RUN yum install -y nginx
# make utf-8 enabled by default
ENV LANG en_US.utf8
COPY index.html /usr/share/nginx/html/index.html
EXPOSE 80 443
CMD ["nginx", "-g", "daemon off;"]

VOLUME in Dockerfile

For example Dockerfile

VOLUME ["/etc/nginx/"]

ENTRYPOINT vs CMD in Dockerfile

#For example
CMD ["nginx", "-g", "daemon off;"]
ENTRYPOINT ["/docker-entrypoint.sh"]

You will use ENTRYPOINT and CMD together

  • ENTRYPOINT will define the base command for our container.
  • CMD will define the default parameter(s) for this command.
  • They both have to use JSON syntax.

More

  • MAINTAINER: Set the Author field of the generated images. Ex: MAINTAINER Huu Phan “huupv@gmail.com”
  • ADD: Copies new files, directories, or remote files to the container. Invalidates caches. Avoid ADD and use COPY instead. Ex: ADD build-nginx /tmp/build-nginx
  • STOPSIGNAL: Sets the system call signal that will be sent to the container to exit. Ex: STOPSIGNAL SIGINT
  • WORKDIR: Sets the working directory. Ex: WORKDIR /etc/nginx
  • USER: Sets the username for following RUN / CMD / ENTRYPOINT commands. Ex: USER nginx
  • LABEL: Apply key/value metadata to your images, containers, or daemons. Ex: LABEL architecture=”amd64″
  • ARG: Defines a build-time variable. Ex: ARG buildno
  • ONBUILD: Adds a trigger instruction when the image is used as the base for another build. Ex: ONBUILD COPY . /app/src

Conclusion

A solid understanding of Dockerfile construction is crucial for leveraging the full potential of Docker in your projects. This step-by-step guide aims to equip you with the knowledge and techniques to create efficient and effective Dockerfiles.

By following these guidelines, you can ensure smoother builds, reduced image sizes, and enhanced performance in your Docker environments. To stay updated with the latest tips and best practices, be sure to visit Dockerfile Step-by-Step. Let this guide be your roadmap to mastering Dockerfile creation.

Jenkins install Plug-in Ansible: A Step-by-Step Guide

Introduction

Ansible is a well-known structure management tool. Ansible displays the message in JSON format, explaining the structure of the system with YAML. Now, let’s go Jenkins install Plug-in Ansible.

Refer to install Ansible and Jenkins as the link below

Jenkins install Plug-in Ansible

Global setting

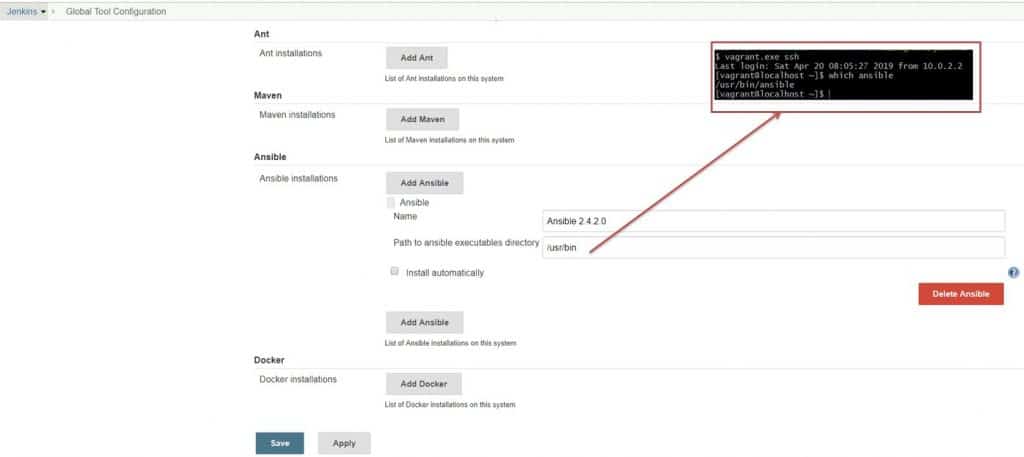
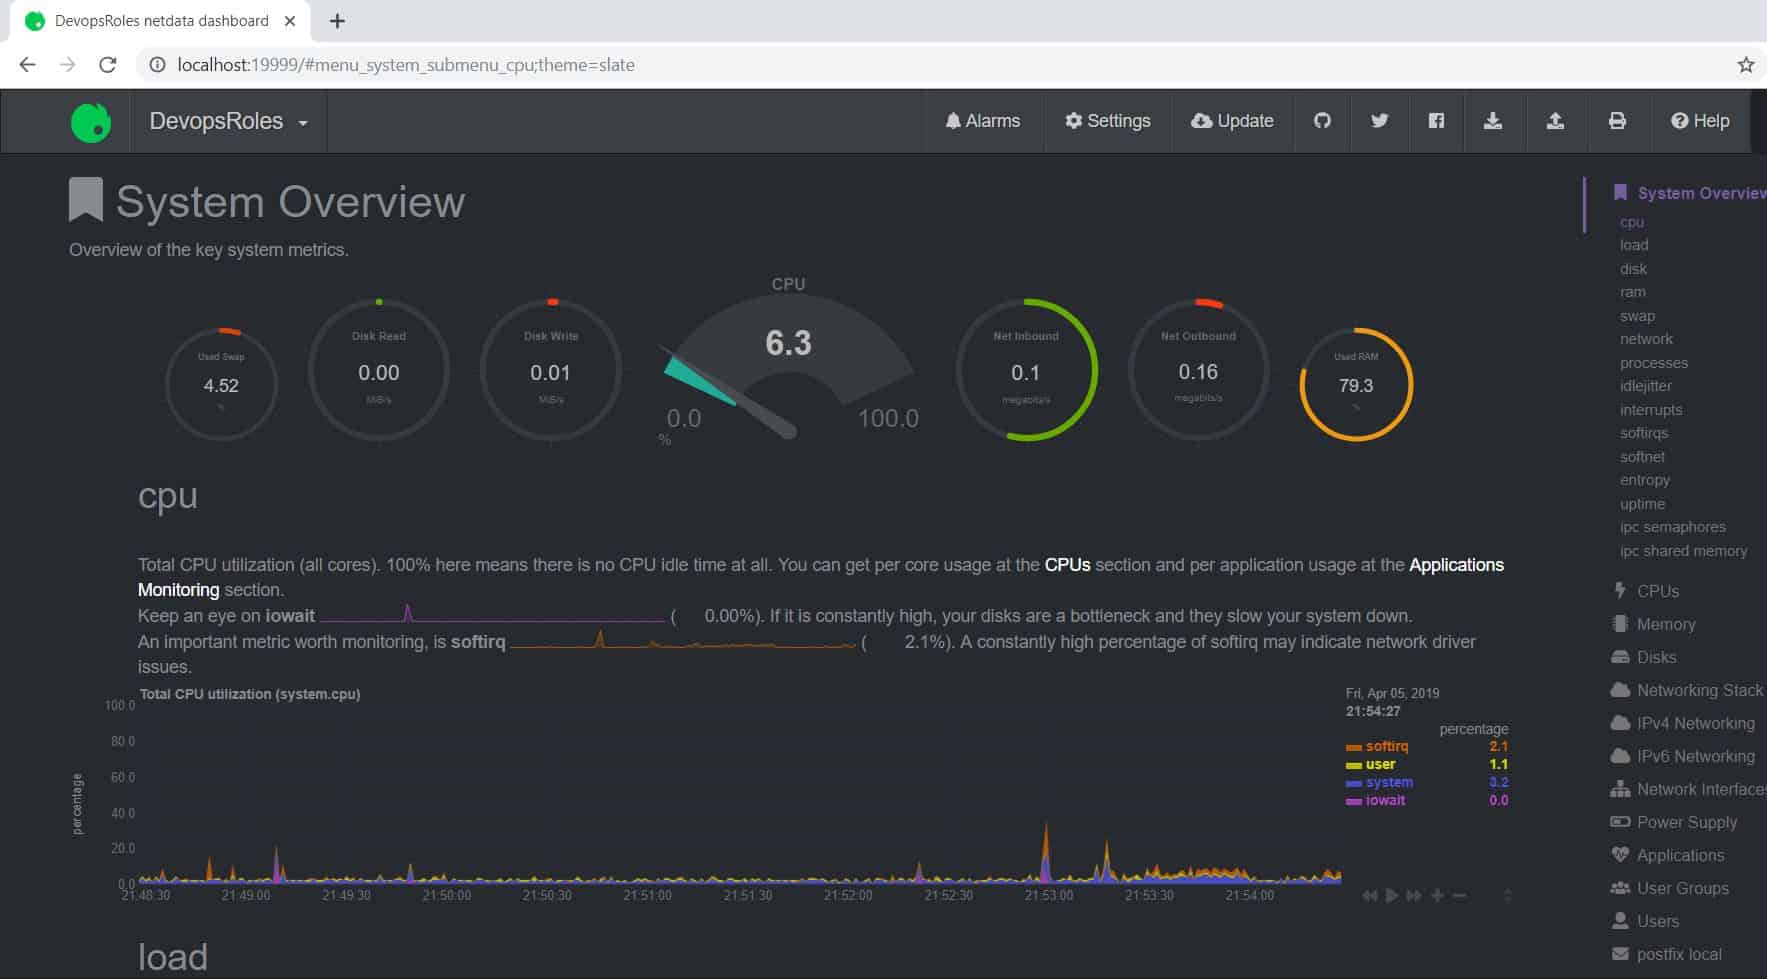
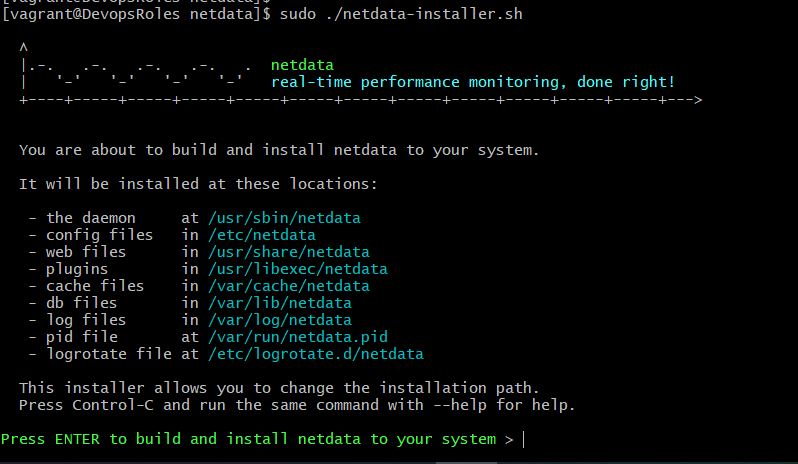
Specify the Ansible implementation directory. Manage Jenkins -> Global Tool Configuration as the picture below

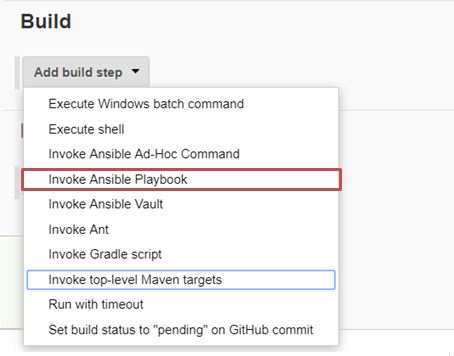
Configure job run Ansible Playbook

Create job –> configure job –> Add build step as the picture below

My example

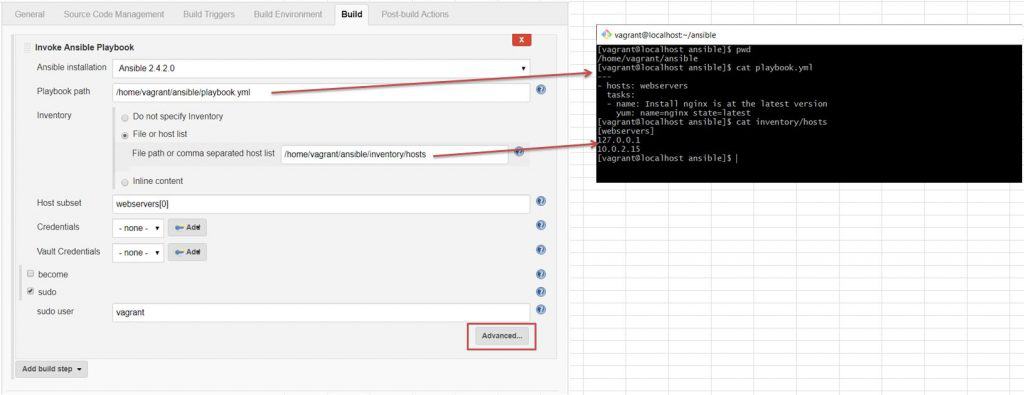
Invoke Ansible Playbook as in the picture below

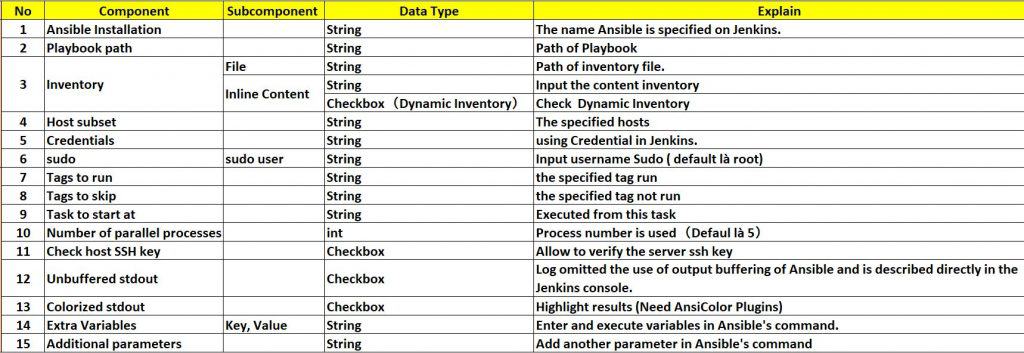
The explained component in Invoke Ansible Playbook as the picture below

Conclusion

Integrating Jenkins and Ansible not only automates the deployment process but also enhances the performance and reliability of your system. Through this detailed guide on installing the Ansible plugin on Jenkins, you can clearly see the benefits this integration brings. By automating configuration management and deployment tasks, you can focus more on developing and improving your products, minimizing risks and errors during deployment. Start integrating Jenkins and Ansible today to experience a significant difference in your DevOps processes.

Vagrant create ansible

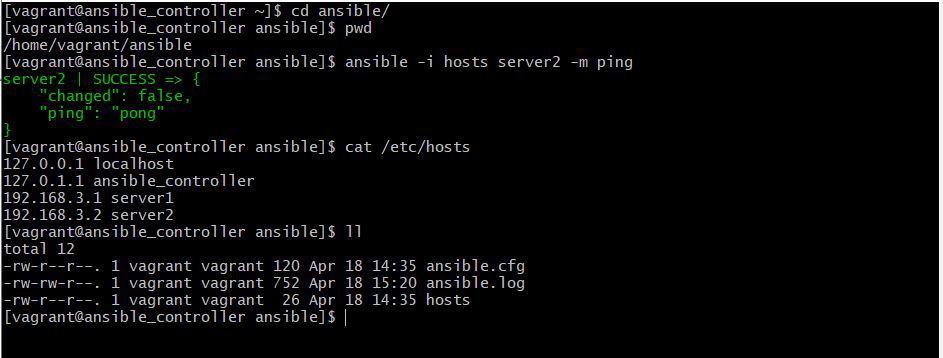
Vagrant is a Configuration management tool. In this tutorial, I will use Vagrant to create an Ansible practice environment. Quickstart Vagrant create ansible your environment developer.

Vagrant create ansible

Install the plugin for Vagrant

$ vagrant plugin install vagrant-hosts
$ vagrant plugin install vagrant-host-shell
$ vagrant plugin install vagrant-vbguest
$ vagrant plugin list
  • vagrant-hosts: Enable name resolution between guests
  • vagrant-host-shell: Make the host’s shell command executable in Vagrantfile
  • vagrant-vbguest: For shared folder (automatic installation of VirtualBox Guest Additions on the guest)

Working folder for Ansible

$ mkdir -p vagrant-ansible/ansible
$ cd vagrant-ansible
$ vagrant init -m centos/7

Note: I will use vagrant init -m to create a simple Vagrantfile

Vagrantfile

I will create an Ansible controller and servers.

Vagrant.configure("2") do |config|

  config.vm.define :ansible_controller do |ansible_controller|
    ansible_controller.vm.box = "centos/7"
    ENV["LC_ALL"] = "en_US.UTF-8"
    config.ssh.insert_key = false
	ansible_controller.vm.synced_folder "./ansible", "/home/vagrant/ansible", type: "rsync"
    ansible_controller.vm.network "private_network", ip: "192.168.3.10", :netmask => "255.255.255.0"
    ansible_controller.vm.provision :hosts, :sync_hosts => true
    ansible_controller.vm.provision :host_shell do |host_shell|
      host_shell.inline = 'scp -i ~/.vagrant.d/insecure_private_key -o "StrictHostKeyChecking no" ~/.vagrant.d/insecure_private_key vagrant@192.168.3.10:/home/vagrant/.ssh/id_rsa'
    end
    ansible_controller.vm.provision "shell", inline: <<-SHELL
      chmod 600 /home/vagrant/.ssh/id_rsa
      timedatectl set-timezone asia/ho_chi_minh
      yum install -y epel-release
      yum -y update
      yum -y install python36 python36-libs python36-devel
      python36 -m ensurepip
      /usr/bin/pip3 install --upgrade pip
      /usr/bin/pip3 install ansible
      SHELL
  end

  N=2
  (1..N).each do |i|
    config.vm.define "server#{i}" do |server|
      server.vm.box = "centos/7"
      config.ssh.insert_key = false
      server.vm.network "private_network", ip: "192.168.3.#{i}", :netmask => "255.255.255.0"
      server.vm.provision :hosts, :sync_hosts => true
    end
  end

end

Start vagrant

$ vagrant up
$ vagrant ssh ansible_controller
$ vagrant ssh server1
$ vagrant ssh server2

The output terminal ansible install in ansible_controller as below

$ vagrant ssh ansible_controller
Last login: Thu Apr 18 14:27:27 2019 from 10.0.2.2
[vagrant@ansible_controller ~]$ ansible --version
ansible 2.7.10
  config file = None
  configured module search path = ['/home/vagrant/.ansible/plugins/modules', '/usr/share/ansible/plugins/modules']
  ansible python module location = /usr/local/lib/python3.6/site-packages/ansible
  executable location = /usr/local/bin/ansible
  python version = 3.6.6 (default, Mar 29 2019, 00:03:27) [GCC 4.8.5 20150623 (Red Hat 4.8.5-36)]
[vagrant@ansible_controller ~]$

Initial setting of Ansible

Create a file ansible.cfg in the folder ansible as in the example below

$ cat ./ansible/ansible.cfg

The content as below

[defaults]
inventory = ./hosts
forks = 15
log_path=$HOME/ansible/ansible.log
host_key_chcking = False
gathering = smart

Create file hosts inventory as below

$ cat ./ansible/hosts

The content hosts file as below

[servers]
server1
server2

Try running Ansible

$ vagrant ssh ansible_controller
[vagrant@ansible_controller ~]$ ansible -i ansible/hosts server1 -m ping
[vagrant@ansible_controller ~]$ ansible -i ansible/hosts server2 -m ping

As the picture below

Conclusion

You have to use Vagrant create ansible. I hope will this your helpful. Thank you for reading the DevopsRoles page!

Install Grafana on Centos 7

Grafana is tool monitoring and Data visualization with support InfluxDB, Graphite, Prometheus, Elasticsearch, and many more databases.

In this tutorial, How to install Grafana on Linux. Link download manually here

Install Grafana on Centos 7

Add Grafana yum repository

[vagrant@DevopsRoles ~]$ cat <<EOF | sudo tee /etc/yum.repos.d/grafana.repo
[grafana]
name=grafana
baseurl=https://packages.grafana.com/oss/rpm
repo_gpgcheck=1
enabled=1
gpgcheck=1
gpgkey=https://packages.grafana.com/gpg.key
sslverify=1
sslcacert=/etc/pki/tls/certs/ca-bundle.crt
EOF

Update cache index as below

[vagrant@DevopsRoles ~]$ sudo yum makecache

Install Grafana

[vagrant@DevopsRoles ~]$ sudo yum -y install grafana

Start Grafana service

[vagrant@DevopsRoles ~]$ sudo systemctl enable --now grafana-server.service

The default port of Grafana used is 3000

Grafana write logs to /var/log/grafana directory and its SQLite database is located under /var/lib/grafana/grafana.db

Open firewall port for Grafana

[vagrant@DevopsRoles ~]$ sudo firewall-cmd --add-port=3000/tcp --permanent
[vagrant@DevopsRoles ~]$ sudo firewall-cmd --reload

Access Grafana Dashboard on Centos 7

Grafana web dashboard on http://[Server IP|Hostname]:3000

The default login as below

username: admin
Password: admin

The change password first login as below

You have Installed Grafana on Centos 7. Thank you for reading the DevopsRoles page!

Install nslookup on Linux

Introduction

In this tutorial, How to install on Linux. is part of the bind-utils package. The package bind-utils is not yet installed on Linux, then you type command not found on Linux.

To install nslookup on Linux, you need to install the dnsutils package, which contains the nslookup utility. The process for installing the package can vary depending on the Linux distribution you are using. Here are the commands for some popular distributions:

How to Install nslookup on Linux

Install nslookup for Centos

[vagrant@DevopsRoles ~]$ sudo yum install bind-utils

Install nslookup for Ubuntu

Use apt-cache to search the package for nslookup command.

[vagrant@DevopsRoles ~]$ apt-cache search nslookup

The result found 2 packages that are related to nslookup.

dnsutils - Clients provided with BIND
libnet-nslookup-perl - simple DNS lookup module for perl

so install nslookup

[vagrant@DevopsRoles ~]$ sudo apt-get install dnsutils

Once the installation is complete, you can use nslookup from the command line.

[vagrant@DevopsRoles ~]$ nslookup x.x.x.x

Conclusion

In this guide, we have covered how to install and use the nslookup command on Linux, specifically for CentOS and Ubuntu. Whether you’re troubleshooting DNS issues or simply querying domain name records, nslookup is a powerful and essential tool for network administrators and IT professionals.

By following the simple installation steps, you can quickly enable nslookup on your system and start resolving domain names with ease. If you encounter any issues, ensure that your system’s package manager is up to date and that you have the necessary permissions to install packages.

We hope this guide has been helpful! If you have any questions or need further assistance, feel free to leave a comment or check out our other Linux tutorials. Thank you for reading the DevopsRoles page!

TKPROF using trace analyzer to trace SQL

Introduction

In this tutorial, we will explore how to use TKPROF with a trace analyzer to trace SQL in an Oracle Database Server. Optimizing SQL performance is crucial for the efficiency and responsiveness of your database applications. One of the powerful tools available for this purpose is TKPROF, a trace file analyzer provided by Oracle.

This guide will introduce you to TKPROF and show you how to use it effectively to trace and analyze SQL performance. By understanding and utilizing TKPROF, you can gain deep insights into your SQL execution, identify performance bottlenecks, and make informed optimizations to enhance your database’s performance.

Syntax of the TKPROF Command

The TKPROF command has several options that allow you to customize its behavior. Here is the syntax:

tkprof tracefile outputfile [explain= ] [table= ]
              [print= ] [insert= ] [sys= ] [sort= ]

Options of TKPROF command

table=schema.tablename: Use 'schema.tablename' with 'explain=' option.
explain=user/password: Connect to ORACLE and issue EXPLAIN PLAN.
print=integer: List only the first 'integer' SQL statements.
aggregate=yes|no: Aggregate multiple trace files.
insert=filename: List SQL statements and data inside INSERT statements.
sys=no: TKPROF does not list SQL statements run as user SYS.
record=filename: Record non-recursive statements found in the trace file.
waits=yes|no: Record summary for any wait events found in the trace file.
sort=option: Set of zero or more of the following sort options:
  prscnt: number of times parse was called
  prscpu: CPU time parsing
  prsela: elapsed time parsing
  prsdsk: number of disk reads during parse
  prsqry: number of buffers for consistent read during parse
  prscu: number of buffers for current read during parse
  prsmis: number of misses in library cache during parse
  execnt: number of times execute was called
  execpu: CPU time spent executing
  exeela: elapsed time executing
  exedsk: number of disk reads during execute
  exeqry: number of buffers for consistent read during execute
  execu: number of buffers for current read during execute
  exerow: number of rows processed during execute
  exemis: number of library cache misses during execute
  fchcnt: number of times fetch was called
  fchcpu: CPU time spent fetching
  fchela: elapsed time fetching
  fchdsk: number of disk reads during fetch
  fchqry: number of buffers for consistent read during fetch
  fchcu: number of buffers for current read during fetch
  fchrow: number of rows fetched
  userid: user ID of the user that parsed the cursor

How to Use Trace Analyzer to Trace SQL

Connect to the Database

[oracle11g@DBdevopsroles ~]$ sqlplus DBUSER/DBUSER@ORACLE_SID
SQL> set termout off
SQL> alter session set timed_statistics = true;
SQL> alter session set sql_trace = true;
SQL> SELECT COUNT(*) from tablename01;
SQL> alter session set sql_trace = false;

Use Trace with TKPROF Command

[oracle11g@DBdevopsroles ~]$ tkprof /app/oracle11g/diag/rdbms/ORACLE_SID/trace/ORACLE_SID_ora_4196.trc ORACLE_SID_ora_4196.txt explain=DBUSER/DBUSER@ORACLE_SID width=200

Confirm Output Destination

SQL> show parameter user_dump_dest

Conclusion

In this tutorial, we covered how to use the TKPROF command with a trace analyzer to trace SQL in an Oracle Database. Using TKPROF to analyze SQL performance is an invaluable skill for any database administrator or developer. By following the steps outlined in this guide, you should now be able to trace and analyze SQL execution efficiently, uncover performance issues, and implement necessary optimizations.

Continuous monitoring and analysis with TKPROF will ensure that your SQL queries run smoothly and efficiently, contributing to the overall health and performance of your database systems. Keep exploring and mastering TKPROF to become proficient in SQL performance tuning. Thank you for reading the DevopsRoles page!

Install Prometheus on RHEL / CentOS 7

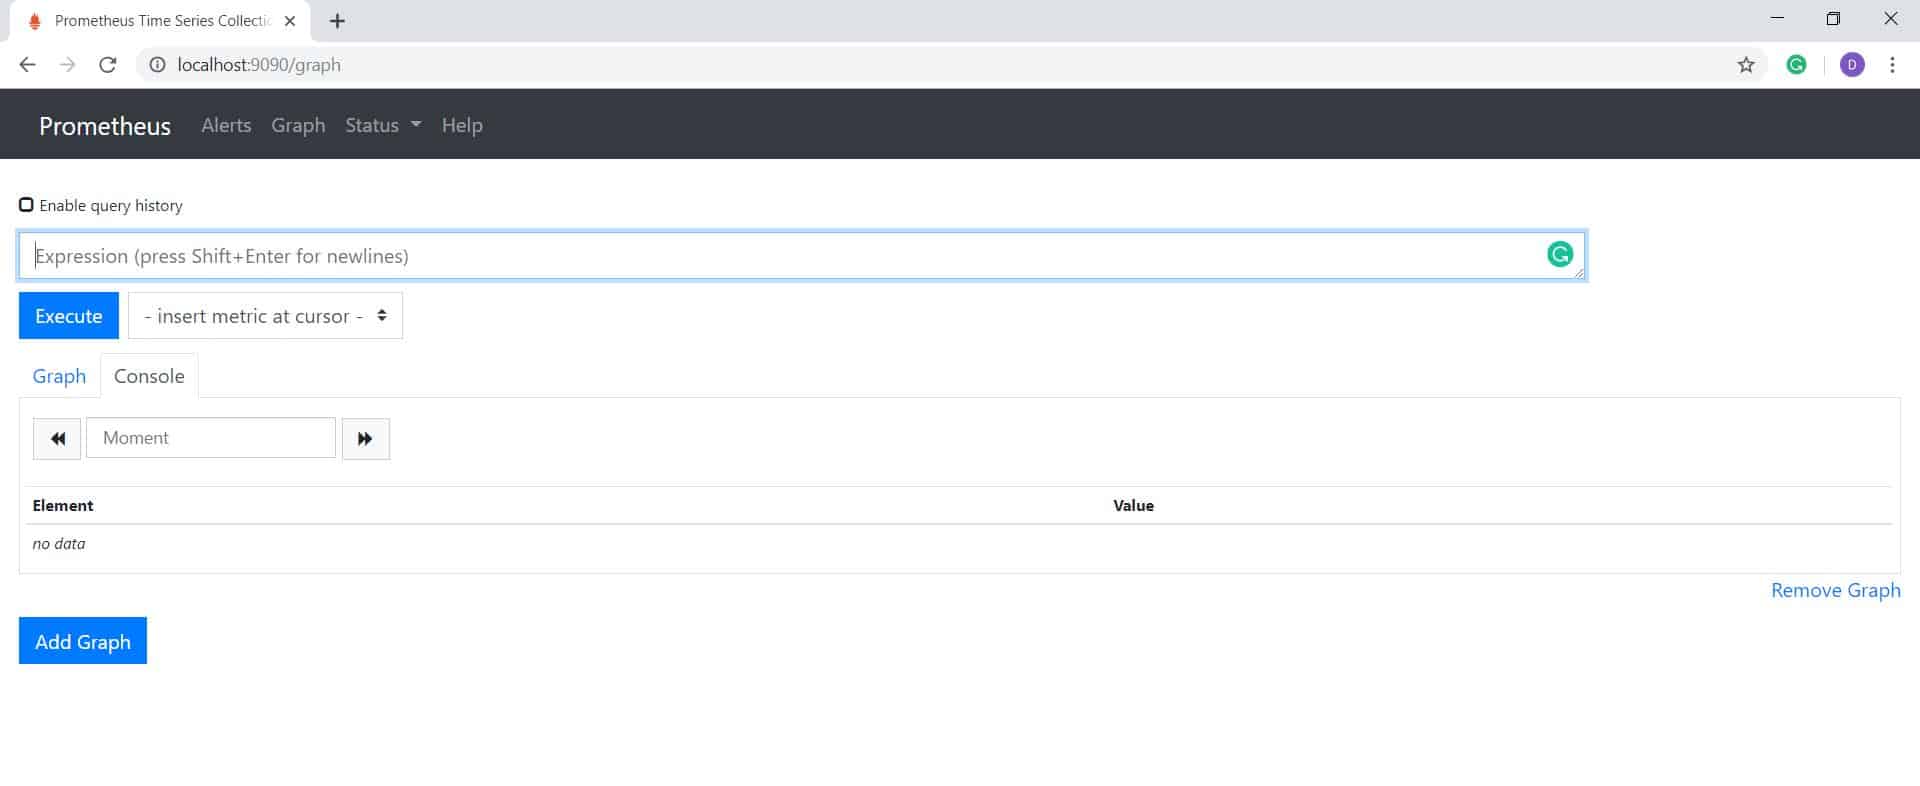
In this tutorial, How to install Prometheus on RHEL / CentOS 7. Prometheus is an open-source applications and microservices. Prometheus releases Github

Install Prometheus

Create user and group Prometheus system

sudo groupadd --system prometheus
sudo useradd -s /sbin/nologin --system -g prometheus prometheus

Create the data directory for Prometheus

sudo mkdir /var/lib/prometheus

Prometheus creates the configuration directory

sudo mkdir -p -m 775 /etc/prometheus/{rules,rules.d,files_sd}

Download and extract Prometheus

cd /tmp
export RELEASE=2.8.1
wget https://github.com/prometheus/prometheus/releases/download/v${RELEASE}/prometheus-${RELEASE}.linux-amd64.tar.gz
tar xvf prometheus-${RELEASE}.linux-amd64.tar.gz
cd prometheus-${RELEASE}.linux-amd64/

Copy Prometheus binary, consoles and console_libraries

sudo cp prometheus promtool /usr/local/bin/
sudo cp -r consoles/ console_libraries/ /etc/prometheus/

Create a Prometheus configuration file.

sudo vi /etc/prometheus/prometheus.yml

The content as below

# Global config
global: 
  scrape_interval:     15s # Set the scrape interval to every 15 seconds. Default is every 1 minute.  
  evaluation_interval: 15s # Evaluate rules every 15 seconds. The default is every 1 minute.  
  scrape_timeout: 15s  # scrape_timeout is set to the global default (10s).

# A scrape configuration containing exactly one endpoint to scrape:# Here it's Prometheus itself.
scrape_configs:
  # The job name is added as a label `job=<job_name>` to any timeseries scraped from this config.
  - job_name: 'prometheus'

    # metrics_path defaults to '/metrics'
    # scheme defaults to 'http'.

    static_configs:
    - targets: ['localhost:9090']

Create a Prometheus systemd service unit file.

sudo vi /etc/systemd/system/prometheus.service

The content Prometheus systemd service as below

[Unit]
Description=Prometheus
Documentation=https://prometheus.io/docs/introduction/overview/
Wants=network-online.target
After=network-online.target

[Service]
Type=simple
Environment="GOMAXPROCS=2"
User=prometheus
Group=prometheus
ExecReload=/bin/kill -HUP $MAINPID
ExecStart=/usr/local/bin/prometheus \
  --config.file=/etc/prometheus/prometheus.yml \
  --storage.tsdb.path=/var/lib/prometheus \
  --web.console.templates=/etc/prometheus/consoles \
  --web.console.libraries=/etc/prometheus/console_libraries \
  --web.listen-address=0.0.0.0:9090 \
  --web.external-url=

SyslogIdentifier=prometheus
Restart=always

[Install]
WantedBy=multi-user.target

Note: You remember to edit the line: Environment=”GOMAXPROCS=2 with replacing 2 is the number of vcpus on the server.

Clean install

rm -rf prometheus-${RELEASE}.linux-amd64.tar.gz
rm -rf prometheus-${RELEASE}.linux-amd64/

Change directory permission.

sudo chown -R prometheus:prometheus /etc/prometheus
sudo chown -R prometheus:prometheus /var/lib/prometheus/

Reload systemd daemon and start the Prometheus service

sudo systemctl daemon-reload
sudo systemctl start prometheus

Configure firewalld

sudo firewall-cmd --permanent --add-rich-rule 'rule family="ipv4" \
source address="192.168.10.0/24" port protocol="tcp" port="9090" accept'
sudo firewall-cmd --reload

Test access Prometheus service on port 9090

$ telnet localhost 9090

Access Prometheus Web dashboard on server

You have to install Prometheus on your system! You got it. Thank you for reading the DevopsRoles page!

Install InfluxDB on RHEL / Centos 7

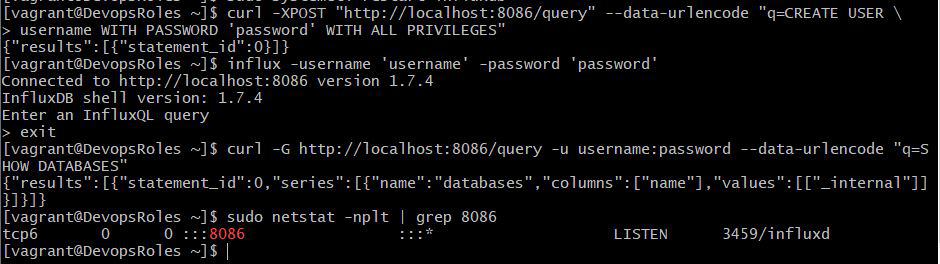
In this tutorial, How to install InfluxDB on RHEL / Centos 7. InfluxDB is an open-source time-series database. It is High availability storage and optimized for fast and metrics analysis.

To install InfluxDB on RHEL/CentOS 7, you can follow the steps below:

Install InfluxDB on RHEL / Centos 7

First, You add InfluxDB repository to your system using the command below

[vagrant@DevopsRoles ~]$ sudo vi  /etc/yum.repos.d/influxdb.repo

Add the content below:

[influxdb]
name = InfluxDB Repository
baseurl = https://repos.influxdata.com/rhel/7/x86_64/stable/
enabled = 1
gpgcheck = 1
gpgkey = https://repos.influxdata.com/influxdb.key

Install InfluxDB

[vagrant@DevopsRoles ~]$ sudo yum -y install influxdb

Enable the InfluxDB service to start on system boot:

[vagrant@DevopsRoles ~]$ sudo systemctl enable influxdb

Start InfluxDB services on RHEL / Centos 7

[vagrant@DevopsRoles ~]$ sudo systemctl start influxdb

To check the status of InfluxDB is running

[vagrant@DevopsRoles ~]$ sudo systemctl status influxdb

Configure InfluxDB Firewall on RHEL / Centos 7

The default, InfluxDB uses TCP port 8086 for client-server communication over HTTP API, and TCP port 8088 is used for backup and restore.

Open the port on the Firewall using the command below

[vagrant@DevopsRoles ~]$ sudo firewall-cmd --add-port=8086/tcp --permanent
[vagrant@DevopsRoles ~]$ sudo firewall-cmd --reload

Configure InfluxDB HTTP Authentication on RHEL / Centos 7

Enable HTTP authentication

[vagrant@DevopsRoles ~]$ sudo vi /etc/influxdb/influxdb.conf

Add the content below:

[http]
 auth-enabled = true

Restart the InfluxDB service.

[vagrant@DevopsRoles ~]$ sudo systemctl restart influxdb

Create a user with an Authentication password

[vagrant@DevopsRoles ~]$ curl -XPOST "http://localhost:8086/query" --data-urlencode "q=CREATE USER \
username WITH PASSWORD 'password' WITH ALL PRIVILEGES"

You need to run any Influxdb commands on the terminal with a specific username and password.

[vagrant@DevopsRoles ~]$ influx -username 'username' -password 'password'

For example, the curl command uses the -u option to specify a username and password.

[vagrant@DevopsRoles ~]$ curl -G http://localhost:8086/query -u username:password --data-urlencode "q=SHOW DATABASES"

Check Influxdb service is listening

[vagrant@DevopsRoles ~]$ sudo netstat -nplt | grep 8086

You have successfully installed InfluxDB on RHEL/CentOS 7. Thank you for reading the DevopsRoles page!

Install Netdata on RHEL 7 / CENTOS 7

In this tutorial, How to install Netdata on RHEL 7 / CENTOS 7.

Netdata is performance and health monitoring for systems and applications. It is a monitoring agent you install on all your systems.

Why use Netdata

  • High-resolution metrics
  • Monitors everything
  • Install and get results immediately
  • Requires zero dedicated resources
  • Open-source, free and very easy
  • Auto-scaling of chart units
  • Time-series back-ends supported – it can archive its metrics on graphite, , Prometheus, JSON document DBs, in the same or lower detail

Install Netdata on RHEL 7 / CENTOS 7 from source

Install EPEL Repository

[vagrant@DevopsRoles ~]$ sudo yum install -y epel-release

Installing all dependencies for Netdata.

[vagrant@DevopsRoles ~]$ sudo yum install Judy-devel libuv cmake json-devel autoconf-archive autogen json-c-devel libmnl-devel libuv-devel lz4-devel nmap-ncat openssl-devel python3 git zlib-devel libuuid-devel libmnl gcc make git autoconf automake pkgconfig curl findutils

Clone Netdata from Github

[vagrant@DevopsRoles ~]$ git clone https://github.com/netdata/netdata.git --depth=100
[vagrant@DevopsRoles ~]$ cd netdata/

The build and installation Netdata on RHEL 7 / CENTOS 7

[vagrant@DevopsRoles ~]$ sudo ./netdata-installer.sh

The output terminal as the picture below

Netdata service will start auto after installation.

To stop netdata run

[vagrant@DevopsRoles ~]$ sudo systemctl stop netdata

To start netdata run

[vagrant@DevopsRoles ~]$ sudo systemctl start netdata

Accesing Netdata from Browser

The default listens on all IPs on port 19999. If you have firewalld, allow access to this port within LAN.

[vagrant@DevopsRoles ~]$ sudo firewall-cmd --permanent --add-rich-rule 'rule family="ipv4" \
source address="192.168.1.0/24" port protocol="tcp" port="19999" accept'

Reload Firewalld to apply changes

[vagrant@DevopsRoles ~]$ sudo firewall-cmd --reload

Access Netdata Web dashboard on server

Thank you for reading the DevopsRoles page!

Devops Tutorial

Exit mobile version