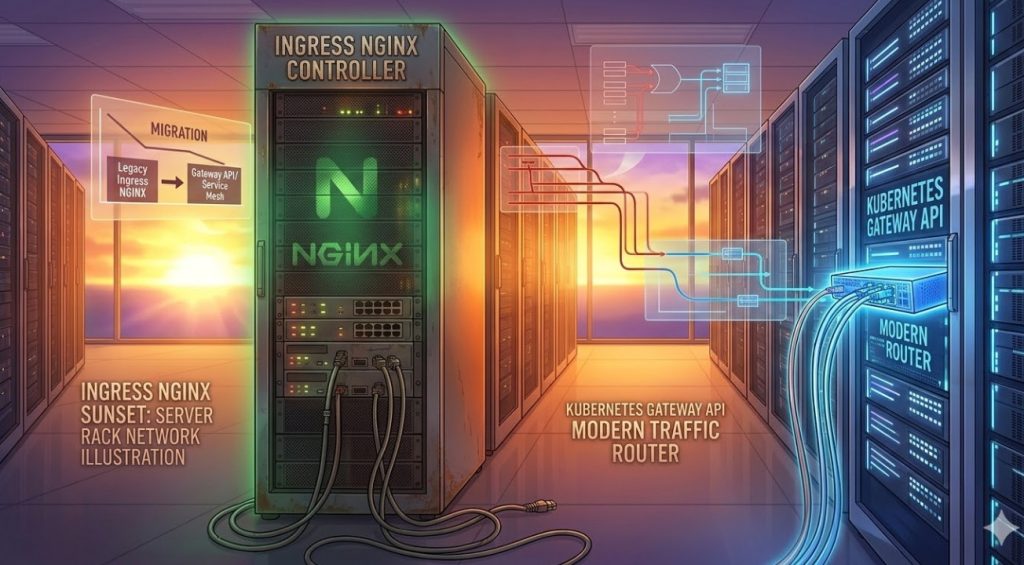
Introduction: The Ingress NGINX Sunset is officially upon us, and it is actively sending shockwaves through the Kubernetes ecosystem.
We have all relied on this trusty controller for years to route our critical production traffic.
Now, the landscape is shifting rapidly, and sticking to legacy solutions is a massive risk.

Let us be brutally honest about this situation.
Migrations are incredibly painful, and nobody actively wants to touch a perfectly functioning traffic layer.
However, ignoring this shift isn’t a strategy—it is a ticking time bomb for your cluster’s reliability and security.
Table of Contents
Understanding the Ingress NGINX Sunset
So, why is this happening right now?
The Kubernetes networking ecosystem is evolving past the basic capabilities of the original Ingress resource.
Maintainers are pushing for more extensible, role-oriented configurations.
The Ingress NGINX Sunset represents a transition away from monolithic, annotation-heavy routing configurations.
We are moving toward a future that demands better multi-tenant support and advanced traffic splitting.
If your team is still piling hundreds of annotations onto a single YAML file, you are living in the past.
It is time to adapt, or risk severe operational bottlenecks.
You can read the original catalyst for this discussion on Cloud Native Now.
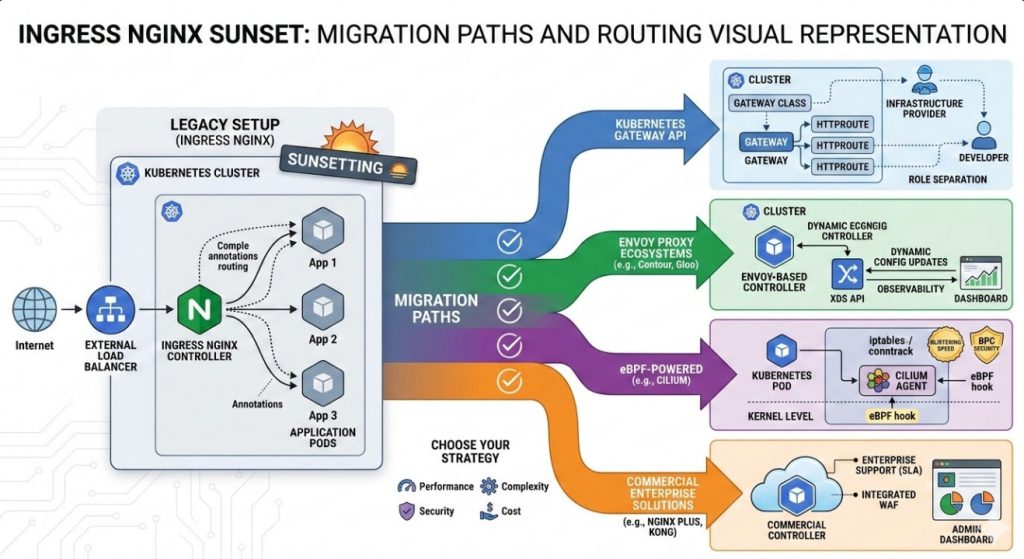
Strategy 1: Embrace the Kubernetes Gateway API
This is arguably the most future-proof path forward.
The Gateway API is the official successor to the traditional Ingress resource.
Instead of one massive file, it splits responsibilities between infrastructure providers and application developers.
During the Ingress NGINX Sunset, pivoting here makes the most architectural sense.
Here is why we highly recommend this approach:
- Role-Oriented: Cluster admins manage the `Gateway`, while devs manage the `HTTPRoute`.
- Standardized: It reduces the heavy reliance on proprietary vendor annotations.
- Advanced Routing: Header-matching and weight-based traffic splitting are natively supported.
Consider how clean a modern Gateway configuration looks:
apiVersion: gateway.networking.k8s.io/v1
kind: Gateway
metadata:
  name: prod-gateway
  namespace: infra
spec:
  gatewayClassName: acme-lb
  listeners:
  - name: http
    protocol: HTTP
    port: 80
This separation of concerns prevents a junior developer from accidentally taking down the entire ingress controller.
For a deep dive into the specifications, review the official Kubernetes documentation.
Strategy 2: Pivot to Envoy Proxy Ecosystems
If you need extreme performance and observability, Envoy is the gold standard.
Tools like Contour, Emissary-ingress, or Gloo Edge are specifically built around Envoy.
They handle dynamic configuration updates beautifully without requiring frustrating pod reloads.
As you navigate the Ingress NGINX Sunset, Envoy-based solutions offer incredible resilience.
We’ve witnessed massive traffic spikes completely overwhelm legacy NGINX setups.
Envoy, originally built by Lyft, handles those exact same spikes without breaking a sweat.
Key advantages of Envoy proxies include:
- Dynamic endpoint discovery (xDS API).
- First-class support for gRPC and WebSockets.
- Unmatched telemetry and tracing capabilities out of the box.
Don’t forget to review how your internal networking costs might shift. See our guide on [Internal Link: Kubernetes Cost Optimization] for more details.
Strategy 3: The eBPF Revolution with Cilium Ingress
Want to completely bypass the standard Linux networking stack?
Enter Cilium, powered by the incredible speed of eBPF.
This isn’t just a basic replacement; it is a fundamental networking paradigm shift.
Cilium handles routing directly at the kernel level, drastically reducing latency.
If the Ingress NGINX Sunset forces your hand, why not upgrade your entire network fabric?
We love this approach for highly secure, low-latency environments.
Here are the immediate benefits you will see:
- Blistering Speed: Packet processing happens before reaching user space.
- Security: Granular, identity-based network policies.
- Simplicity: You can consolidate your CNI and Ingress controller into one tool.
Check out the open-source repository on GitHub to see the massive community momentum.
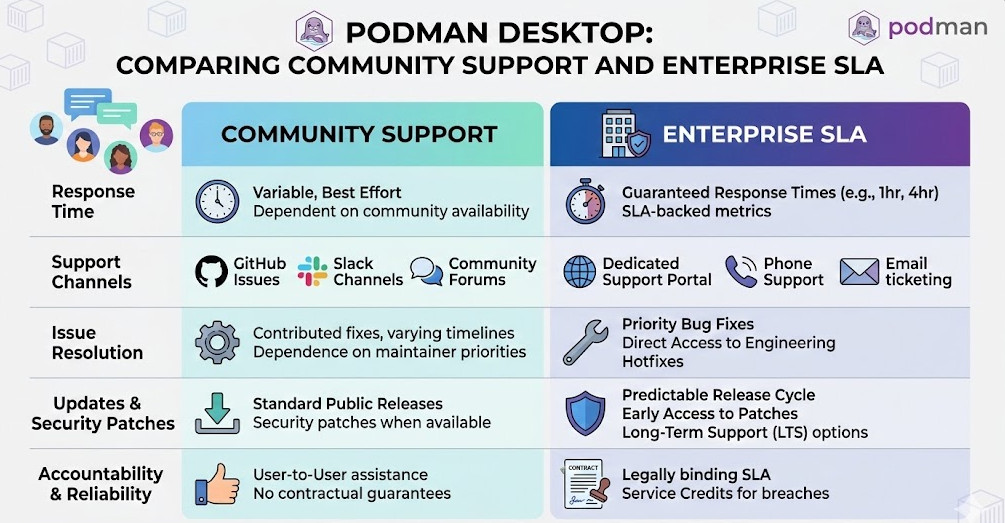
Strategy 4: Upgrading to Commercial Solutions Amid the Ingress NGINX Sunset
Sometimes, throwing money at the problem is actually the smartest engineering decision.
If your enterprise requires strict SLAs, FIPS compliance, and dedicated support, going commercial makes sense.
F5’s NGINX Plus or enterprise variants of Kong and Tyk provide exactly that safety net.
They abstract away the grueling maintenance overhead.
Navigating the Ingress NGINX Sunset doesn’t mean you have to use open-source exclusively.
Enterprise solutions often provide GUI dashboards, advanced WAF integrations, and guaranteed patches.
When millions of dollars in transaction revenue are on the line, paying for an enterprise license is simply cheap insurance.
The Ultimate Migration Checklist
Before you touch your production clusters, follow these critical steps.
Skipping even one of these can lead to catastrophic downtime.
- Audit Existing Annotations: Document every single NGINX annotation currently in use.
- Evaluate Replacements: Map those annotations to Gateway API concepts or Envoy filters.
- Run in Parallel: Deploy your new controller alongside the old one.
- DNS Cutover: Shift a small percentage of traffic (Canary release) to the new load balancer.
- Monitor Vigorously: Watch your 4xx and 5xx error rates like a hawk.
FAQ About the Ingress NGINX Sunset
Is Ingress NGINX completely dead today?
No, it is not dead immediately. However, the architectural momentum is entirely shifting toward the Gateway API. The Ingress NGINX Sunset is about the gradual deprecation of the older paradigms.
Do I need to migrate right this second?
You have a grace period, but you must start planning now. Technical debt compounds daily, and waiting until the last minute guarantees a stressful, error-prone migration.
Which strategy is best for a small startup?
If you have a simple architecture, transitioning natively to the Kubernetes Gateway API implementation provided by your cloud provider (like AWS VPC Lattice or GKE Gateway) is often the path of least resistance.

Conclusion: The Ingress NGINX Sunset isn’t a crisis; it is a vital opportunity to modernize your infrastructure. Whether you choose the Gateway API, Envoy, eBPF, or a commercial safety net, taking decisive action today ensures your cluster remains resilient for the next decade of traffic demands. Thank you for reading the DevopsRoles page!