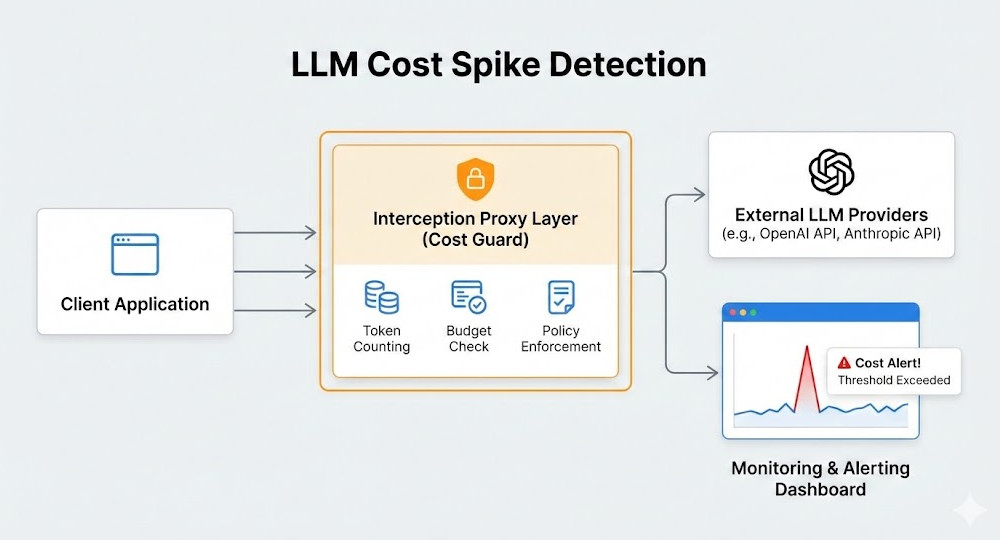
Introduction: I still remember the cold sweat. I woke up to a $14,000 OpenAI bill because a junior developer left a recursive agent running over the weekend. That was the day I realized LLM Cost Spike Detection isn’t just a nice-to-have; it’s a matter of startup survival.
You are probably flying blind right now.
Most teams rely on vendor dashboards that update 24 hours too late. By the time you see the spike, the cash is already gone.
Sure, you could install a bulky third-party SDK. But why add more dependency nightmares to your stack?
Today, we are doing it the veteran way. No fluff. No vendor lock-in.
We will build a transparent interception layer. We will capture everything at the network level.
While you are building this LLM Cost Spike Detection setup, you get latency tracking for free.
LLM providers are notorious for degrading performance during peak hours.
Your proxy measures the exact time between the request and the response. You can now track “Cost per Millisecond” or “Tokens per Second.”
If GPT-4 starts taking 30 seconds to respond, your proxy can automatically route the traffic to a faster, cheaper model like Claude Haiku.
This is what we call dynamic fallback routing. It saves money and preserves the user experience.
Advanced Techniques: Streaming Responses
I know what you are thinking. “But I use streaming responses for my chat UI!”
Streaming complicates things, but the No-SDK approach still works perfectly.
When you stream data via Server-Sent Events (SSE), OpenAI does not send the usage block by default in older API versions.
However, modern API updates now allow you to request the usage data in the final chunk of the stream.
Ensure you pass stream_options: {"include_usage": true} in your payload.
Have your proxy intercept the stream, yielding chunks to the client instantly.
When the final chunk arrives, parse the token count and log the cost.
You maintain a snappy, typing-effect UI for the user, while still getting perfectly accurate billing data.
FAQ Section
Does a proxy add latency? Yes, but it’s negligible. A well-written proxy in Rust or Go adds roughly 2-5ms of overhead. You won’t notice it on a 2-second LLM generation.
Can I use an API Gateway instead? Absolutely. Tools like Kong, Tyk, or AWS API Gateway can be configured to read headers and log usage metrics.
What if the provider changes their pricing? You update the pricing dictionary in your proxy. Your core app doesn’t need a code deployment.
Is LLM Cost Spike Detection hard to maintain? No. It’s much easier to maintain one centralized proxy than updating SDKs across 15 different microservices.
Conclusion: Blindly trusting your cloud bills is a rookie mistake. Implementing a No-SDK LLM Cost Spike Detection system gives you the ultimate control over your AI infrastructure.
By tracking usage at the endpoint, user, and prompt version levels, you turn unpredictable AI expenses into manageable, optimized SaaS metrics.
Stop paying the “stupid tax” to API providers. Build your proxy, tag your headers, and take your budget back today.Thank you for reading the DevopsRoles page!
pipeline {
    agent any
    stages {
        stage('Build & Test') {
            steps {
                sh 'make build'
            }
        }
    }
    post {
        failure {
            script {
                echo "Critical Failure! Engaging the AI Copilot..."
                // Send secure webhook to AWS API Gateway -> Lambda
                sh """
                    curl -X POST -H 'Content-Type: application/json' \
                    -d '{"build_url": "${env.BUILD_URL}"}' \
                    https://your-api-gateway-id.execute-api.us-east-1.amazonaws.com/prod/analyze
                """
            }
        }
    }
}
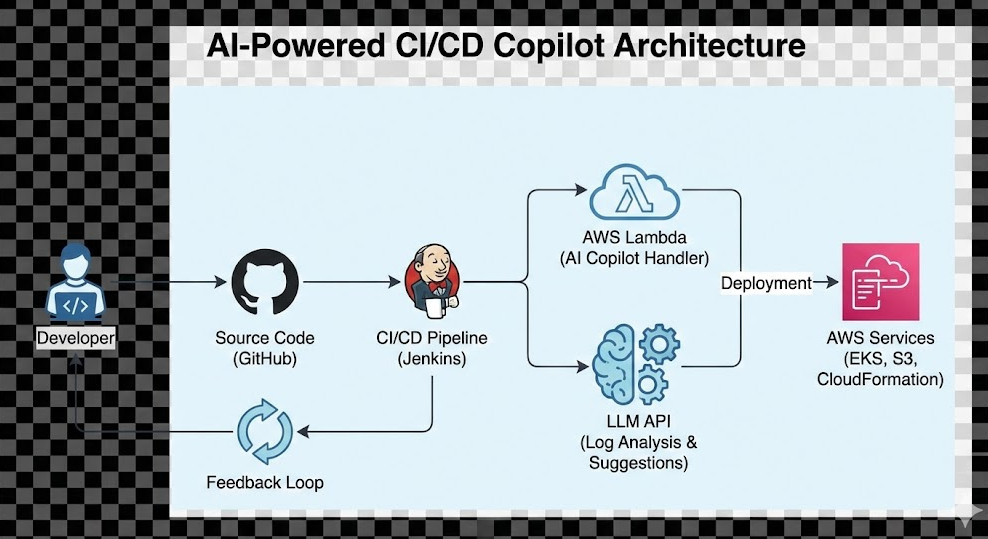
When the build crashes and burns, Jenkins automatically fires the payload.
The Lambda wakes up, pulls the console text via the Jenkins API, and gets to work immediately.
Advanced Prompt Engineering for your AI-Powered CI/CD Copilot
Let’s dig deeper into the actual prompt engineering mechanics.
A naive prompt will yield absolute garbage. You can’t just send a log and say “Fix this.”
LLMs are incredibly smart, but they lack your specific repository’s historical context.
You must spoon-feed them the boundaries of reality.
Here is a blueprint for the system prompt I use in production environments:
“You are a Senior Principal DevOps engineer. Analyze the following Jenkins build log. Identify the exact root cause of the failure. Provide a step-by-step fix. Format the exact shell commands needed in Markdown code blocks. Keep the explanation under 3 sentences and be brutally concise.”
See what I did there? Ruthless constraints.
By forcing the AI-Powered CI/CD Copilot to output strictly in code blocks, you can programmatically parse them.
Securing Your AI-Powered CI/CD Copilot
Security is not an afterthought. Not when an AI is reading your proprietary stack traces.
Let’s talk about AWS IAM (Identity and Access Management).
Your Lambda function must run under a draconian principle of least privilege.
It only needs permission to write logs to CloudWatch and perhaps invoke the LLM API.
If you are pulling Jenkins API tokens, use AWS Secrets Manager. Never, ever hardcode your keys.
Create a dedicated, isolated IAM role for the Lambda execution.
Attach inline policies strictly limited to necessary ARNs.
Implement a rigorous log scrubber before sending data to the outside world.
That last point is absolutely critical to your company’s survival.
Jenkins logs often leak environment variables, database passwords, or AWS access keys.
You must write a regex function in your Python script to sanitize the payload.
If an API token leaks into an LLM training dataset, you are having a very bad day.
The AI-Powered CI/CD Copilot must be entirely blind to your cryptographic secrets.
Cost Analysis: Running an AI-Powered CI/CD Copilot
Let’s talk dollars and cents, because executives love ROI.
How much does this serverless architecture actually cost to run at enterprise scale?
Shockingly little. The compute overhead is practically a rounding error.
AWS Lambda offers one million free requests per month on the free tier.
Unless your team is failing a million builds a month (in which case, you have bigger problems), the compute is free.
The real cost comes from the LLM API tokens.
You are looking at fractions of a single cent per log analysis.
Compare that to a Senior Engineer making $150k a year spending 40 minutes debugging a YAML typo.
The AI-Powered CI/CD Copilot pays for itself on the very first day of deployment.
War Story: How the AI-Powered CI/CD Copilot Saved a Friday Deployment
I remember a massive, high-stakes migration project last October.
We were porting a legacy monolithic application over to an EKS Kubernetes cluster.
The Helm charts were a tangled mess. Node dependencies were failing silently in the background.
Jenkins was throwing generic exit code 137 errors. Out of memory. But why?
We spent four hours staring at Grafana dashboards, application logs, and pod metrics.
Then, I hooked up the first raw prototype of our AI-Powered CI/CD Copilot.
Within 15 seconds, it parsed 10,000 lines of logs and highlighted a hidden Java memory leak in the integration test suite.
It suggested adding `-XX:+HeapDumpOnOutOfMemoryError` to the Maven options to catch the heap.
We found the memory leak in the very next automated run.
That is the raw power of having a tireless, instant pair of eyes on your pipelines.
FAQ Section
Is this architecture expensive to maintain? No. Serverless functions require zero patching. The LLM APIs cost pennies per pipeline run.
Can it automatically commit code fixes? Technically, yes. But I strongly recommend keeping a human in the loop. Approvals matter for compliance.
What if the Jenkins logs exceed token limits? Excellent question. You must truncate the logs. Send only the last 200 lines to the AI, where the actual stack trace lives.
Conclusion: Your engineering time is vastly better spent building revenue-generating features, not parsing cryptic Jenkins errors. Building an AI-Powered CI/CD Copilot is the highest ROI infrastructure project you can tackle this quarter. Stop doing manual log reviews and let the machines do what they do best. Thank you for reading the DevopsRoles page!
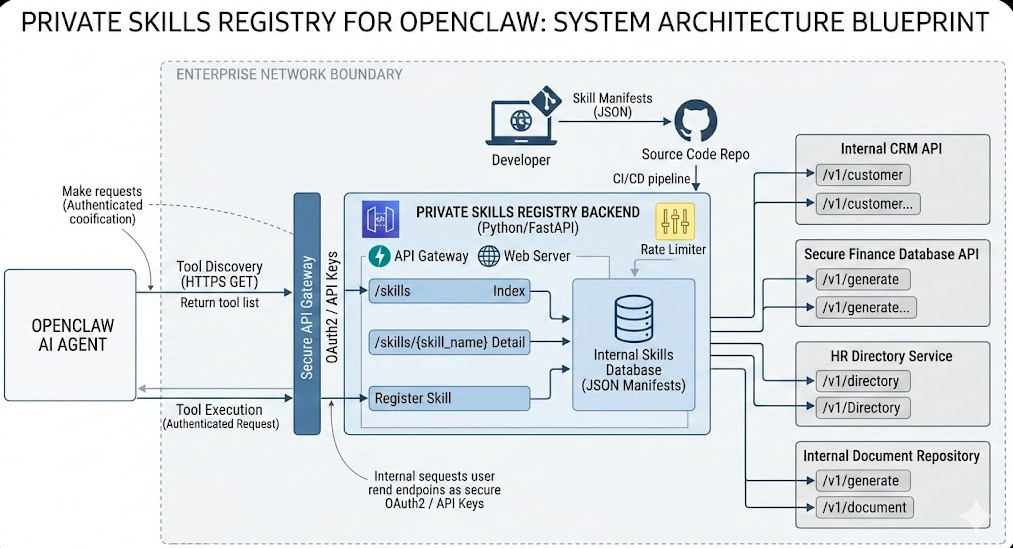
Introduction: I’ve spent the last two decades building infrastructure, and I’ll tell you right now: relying on public AI toolkits is a ticking time bomb. If you are serious about enterprise AI, you absolutely need a Private Skills Registry for OpenClaw.
I learned this the hard way back in 2024 when a client accidentally leaked proprietary data through a poorly vetted public skill. It was a nightmare.
You cannot control what you don’t host.
By bringing your tools in-house, you gain total authority over what your AI agents can and cannot execute.
Let’s roll up our sleeves and build one from scratch.
Why Building a Private Skills Registry for OpenClaw is Non-Negotiable
So, why does this matter? Why not just use the default public registry?
Two words: Data sovereignty.
When you use OpenClaw in a corporate environment, your agents interact with sensitive APIs, internal databases, and private documents.
If those skills are hosted externally, you introduce massive supply chain risks.
A malicious update to a public skill can compromise your entire AI workflow instantly.
A Private Skills Registry for OpenClaw acts as your secure vault.
It guarantees that every single piece of executable code your agent touches has been audited, version-controlled, and approved by your internal security team.
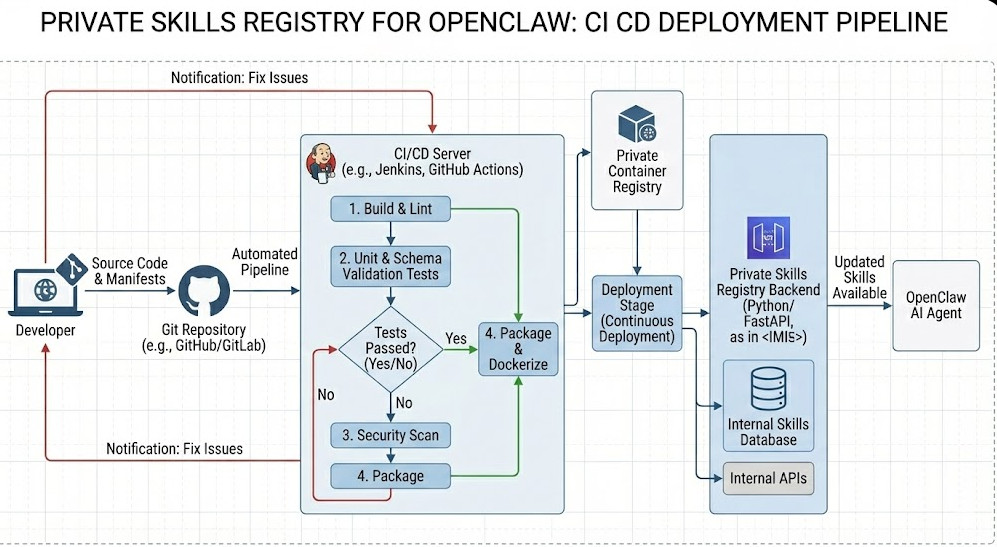
You treat your Private Skills Registry for OpenClaw like any other software product.
Keep your skill definitions in a Git repository.
Write unit tests that validate the JSON schemas before deployment.
When a developer pushes a new skill, your CI/CD pipeline should automatically run tests.
If the tests pass, the pipeline updates the FastAPI database or the static JSON files.
This guarantees that OpenClaw only ever sees validated, working skills.
FAQ Section
Can I host my Private Skills Registry for OpenClaw on AWS S3 instead of an API? Yes, if your skills are entirely static. You can host a static JSON file. However, an API allows for dynamic skill availability based on user roles.
Does this work with all versions of OpenClaw? It works with any version that supports custom registry URLs. Check your version’s release notes.
What if a skill fails during execution? The registry only provides the routing. OpenClaw handles the execution errors natively based on the agent’s internal logic.
How do I handle versioning? Include version numbers in the skill URLs or headers, ensuring backwards compatibility for older agents.
Conclusion: Taking control of your AI infrastructure isn’t just a best practice; it’s a survival tactic. Building a Private Skills Registry for OpenClaw ensures your data stays yours, your agents remain reliable, and your security team sleeps soundly at night. Get it built, secure it tight, and start deploying enterprise-grade agents with confidence. Thank you for reading the DevopsRoles page!
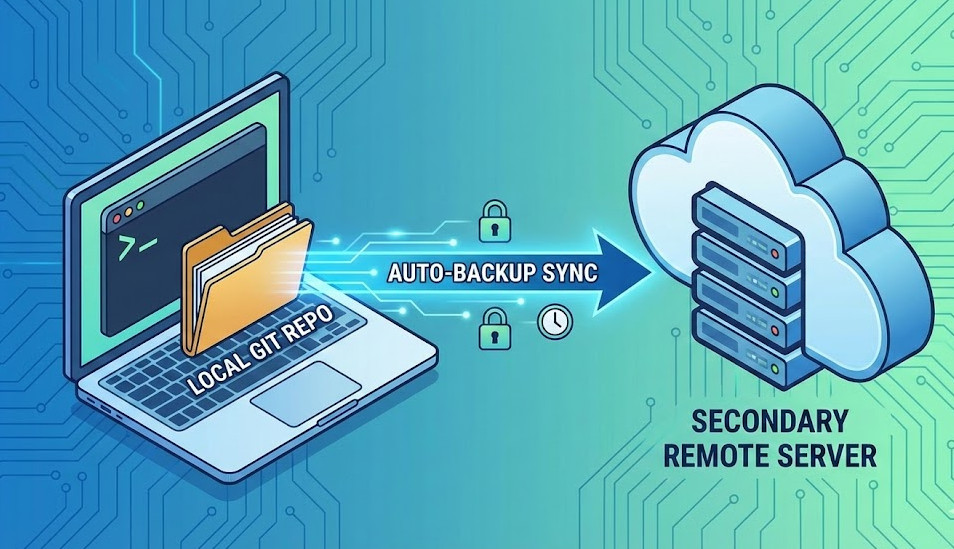
Consider setting up a private repo on GitLab, Bitbucket, or even a local NAS.
Open your terminal and add the new remote:
# Add a secondary remote named 'backup'
git remote add backup git@gitlab.com:yourusername/your-backup-repo.git
Verify that the remote was added correctly.
# List all remotes to confirm
git remote -v
You should now see both your origin and your backup remotes listed.
Step 2: Creating the Post-Commit Script
Now comes the fun part: writing the automation.
Navigate to the hidden .git/hooks directory inside your project.
You will see a bunch of sample files ending in .sample.
We are going to create a brand new file called post-commit.
Do not add a file extension. Just exactly post-commit.
Open it in your favorite text editor and paste the following bash script:
#!/bin/bash
# Auto-Backup Git Repo Script

echo "Triggering automatic backup to secondary remote..."

# Get the current branch name
BRANCH=$(git rev-parse --abbrev-ref HEAD)

# Push to the backup remote in the background
git push backup $BRANCH --force --quiet &

echo "Backup process running in background!"
Let’s break down what this script does.
First, it identifies the exact branch you are currently working on.
Then, it pushes that branch to the backup remote.
We use the & symbol at the end of the push command. This is crucial.
It forces the push to run in the background asynchronously.
Without it, your terminal would freeze and wait for the network upload to finish.
This keeps your workflow blazing fast. You won’t even notice it running.
Step 3: Making the Script Executable
This is where 90% of developers get stuck.
You’ve written the script, but Git won’t run it.
By default, newly created files in Unix systems don’t have execute permissions.
You must explicitly tell your operating system that this file is safe to run.
Run this simple command in your terminal:
# Grant execute permissions to the hook
chmod +x .git/hooks/post-commit
Boom. You are done.
Make a test commit and watch the magic happen.
Check your secondary remote, and your code will instantly appear there.
Advanced Tips for Your Auto-Backup Git Repo Workflow
The basic script works perfectly for standard personal projects.
But if you are working in a massive enterprise environment, you might need tweaks.
But what if you have 50 different microservices on your machine?
Manually copying the script into 50 different .git/hooks folders is a nightmare.
Thankfully, Git allows you to set a global hooks directory.
This forces every single repository on your computer to use the same scripts.
# Set a global hooks path
git config --global core.hooksPath ~/.githooks
Now, place your post-commit script in ~/.githooks.
Every commit, in every repo, will automatically attempt a backup.
Just ensure every repo actually has a remote named “backup” configured!
FAQ: Auto-Backup Git Repo Secrets
Does this slow down my committing speed? No. Because we push asynchronously, your local commit finishes instantly.
What if I push broken code? The backup remote is purely a mirror. It doesn’t trigger production CI/CD pipelines.
Can I backup to a local hard drive instead? Absolutely. Just set your remote URL to a local file path like /Volumes/ExternalDrive/backup.git.
Will this override my teammates’ work? Since you are pushing to a dedicated personal backup remote, it only affects your clone.
Is this safe for sensitive data? Always ensure your backup remote has the exact same strict access controls as your primary remote.
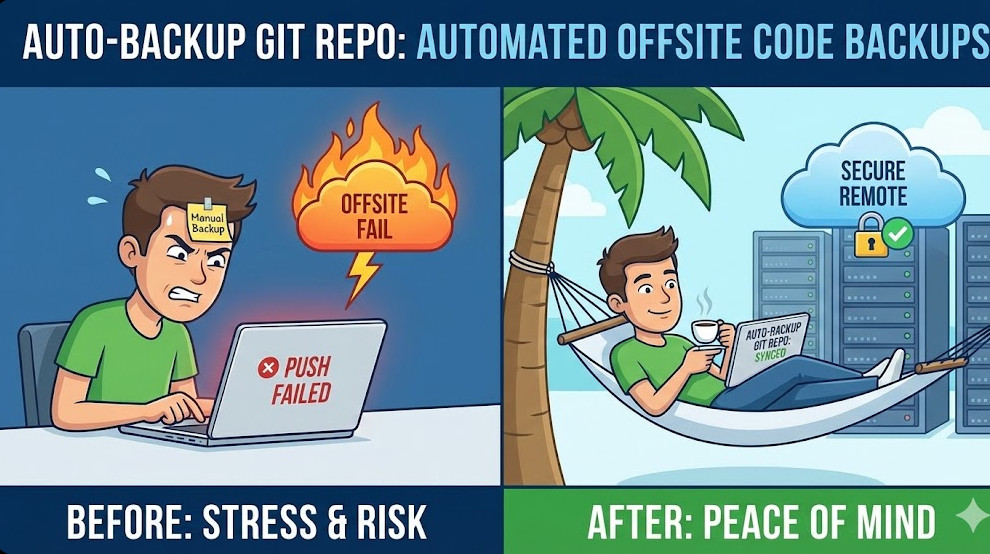
Conclusion: Setting up an Auto-Backup Git Repo system takes exactly five minutes, but it will save you weeks of agony.
We are humans. We forget to type git push. Hardware fails. Laptops die.
By delegating this critical task to a tiny automated script, you remove human error entirely.
You can finally code with absolute peace of mind.
Would you like me to walk you through setting up a script to automatically pull changes from the main branch next? Thank you for reading the DevopsRoles page!
Understanding the Mechanics of a Gated Content Bypass
So, why does this matter to you?
Because if you monetize digital assets, your authentication layer is your cash register. When traffic spikes, that cash register is the first thing to break.
A gated content bypass doesn’t usually happen because of elite hackers typing furiously in dark rooms. It happens because of architectural bottlenecks.
When 100,000 concurrent users try to log in simultaneously, your identity provider (IdP) chokes. Timeout errors cascade through your microservices.
To keep the site from completely crashing, misconfigured Content Delivery Networks (CDNs) often serve the requested asset anyway. They prioritize availability over authorization.
The True Financial Cost of Gated Content Bypass
It’s not just about the immediate lost sales.
When paying subscribers see non-paying users getting the exact same access during a major event, trust evaporates instantly.
I’ve seen chargeback rates skyrocket to 40% after a high-profile gated content bypass.
Your customer support team gets buried in angry tickets. Your engineering team loses a weekend putting out fires.
7 DevOps Strategies to Prevent Gated Content Bypass
You can’t just throw more RAM at a database and pray. You need strategic decoupling. Here are seven battle-tested strategies.
1. Move Authentication to the Edge
Never let unauthenticated traffic reach your origin servers during a spike.
By using Edge Computing (like Cloudflare Workers or AWS Lambda@Edge), you validate access tokens geographically close to the user.
If the JSON Web Token (JWT) is invalid or missing, the edge node drops the request immediately. Your origin server never even knows the user tried.
2. Implement Strict Rate Limiting
Brute force attacks and scrapers love high-traffic events. They hide in the noise of legitimate traffic.
Set up aggressive rate limiting on your login and authentication endpoints.
You want to block IP addresses that attempt hundreds of unauthorized requests per second before they trigger a gated content bypass.
3. Use “Stale-While-Revalidate” Carefully
Caching is your best friend, until it betrays you.
Many DevOps engineers misconfigure the stale-while-revalidate directive.
Make absolutely sure that this caching rule only applies to public assets, never to URLs containing premium media files.
4. Decouple the Auth Service from Delivery
If your main application database handles both user profiles and authentication, you are asking for trouble.
Split them up. Use an in-memory datastore like Redis strictly for fast token validation.
If you aren’t familiar with its performance limits, read the official Redis documentation. It can handle millions of operations per second.
5. Establish Circuit Breakers
When the authentication service gets slow, a circuit breaker stops sending it requests.
Instead of locking up the whole system waiting for a timeout, the circuit breaker instantly returns a “Service Unavailable” error.
This prevents a system-wide failure that might otherwise result in a fail-open gated content bypass.
6. Pre-Generate Signed URLs
Don’t rely on cookies alone for video streams or large file downloads.
Generate short-lived, cryptographically signed URLs for premium assets. If the URL expires in 60 seconds, it cannot be shared on Reddit.
Even if the CDN is misconfigured, the cloud storage bucket will reject the expired signature.
7. Real-Time Log Monitoring
If a bypass is happening, you need to know in seconds, not hours.
Set up alerting in Datadog or an ELK stack. Watch for a sudden spike in HTTP 200 (Success) responses on protected paths without corresponding Auth logs.
That discrepancy is the smoke. The fire is your revenue burning.
Code Example: Securing the Edge Against Gated Content Bypass
Let’s look at how you stop unauthorized access at the CDN level. This prevents the traffic from ever hitting your fragile backend.
Here is a simplified example of a Cloudflare Worker checking for a valid JWT before serving premium content.
// Edge Authentication Script to prevent gated content bypass
export default {
  async fetch(request, env) {
    const url = new URL(request.url);

    // Only protect premium routes
    if (!url.pathname.startsWith('/premium/')) {
      return fetch(request);
    }

    const authHeader = request.headers.get('Authorization');

    // Fail closed: No header, no access.
    if (!authHeader || !authHeader.startsWith('Bearer ')) {
      return new Response('Unauthorized', { status: 401 });
    }

    const token = authHeader.split(' ')[1];
    const isValid = await verifyJWT(token, env.SECRET_KEY);

    // Fail closed: Invalid token, no access.
    if (!isValid) {
      return new Response('Forbidden', { status: 403 });
    }

    // Pass the request to the origin only if valid
    return fetch(request);
  }
};

async function verifyJWT(token, secret) {
  // Production implementation requires robust crypto validation
  // This is a placeholder for standard JWT decoding logic
  return token === "valid-test-token";
}
Notice the logic here. It defaults to failing closed.
If the token is missing, it fails. If the token is bad, it fails. The origin server is completely shielded from this traffic.
Why Load Testing is Non-Negotiable
You can read all the blogs in the world, but until you simulate a traffic spike, you are flying blind.
A gated content bypass usually rears its head when server CPU utilization crosses 90%.
I highly recommend using tools like K6. You can find their open-source repository on GitHub.
Saturate your authentication endpoints. Watch how your system degrades. Does it show an error, or does it leak data?
Fix the leaks in staging before your users find them in production.
FAQ Section
What is a gated content bypass? It is a vulnerability where users gain access to premium, paywalled, or restricted content without proper authentication, often caused by server overload or caching errors.
Why does high traffic cause a gated content bypass? During traffic spikes, authentication servers can crash. If CDNs or proxies are configured to “fail-open” to keep the site online, they may serve restricted content to unauthorized users.
How do signed URLs help? Signed URLs append a cryptographic signature and an expiration timestamp to a media link. Once the time expires, the cloud provider blocks access, preventing users from sharing the link publicly.
Can a WAF stop a gated content bypass? A Web Application Firewall (WAF) can stop brute-force attacks and malicious scrapers, but it cannot fix a fundamental architectural flaw where your backend fails to validate active sessions.
Conclusion: Preparing for the Worst
High-traffic events should be a time for celebration, not panic attacks in the server room.
By moving authentication to the edge, decoupling your databases, and aggressively load-testing, you can sleep soundly during your next big launch.
Don’t let a gated content bypass ruin your biggest day of the year. Audit your authentication architecture today.
Would you like me to analyze a specific piece of your infrastructure to see where a bypass might occur? Thank you for reading the DevopsRoles page!
Let me tell you about a catastrophic Friday release from back in 2018.
My team pushed a massive update for a global streaming client, all green lights in staging. We popped the champagne.
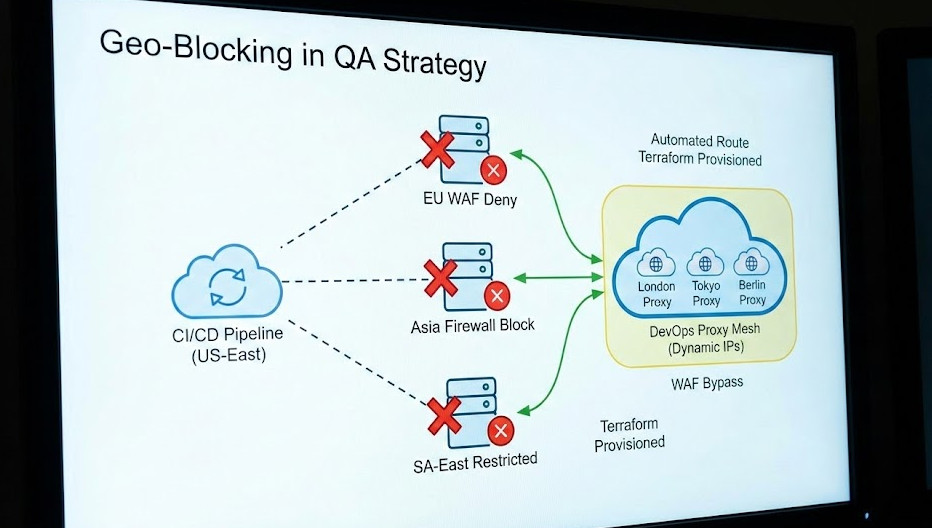
Ten minutes later, the monitoring board lit up red. Zero traffic from the entire European Union.
Why? Because our firewalls dropped international requests, and our test suites ran exclusively from a server in Ohio. Tackling Geo-Blocking in QA before production is not an option; it is a survival requirement.
If you have ever tried to test location-specific features, you know the pain. You hit an invisible wall of IP bans and 403 Forbidden errors.
It gets worse when the infrastructure team leaves you completely in the dark. No documentation, no architecture maps, just a vague “figure it out” from upper management.
Modern Web Application Firewalls (WAFs) are ruthless. They use massive databases to cross-reference your testing server’s IP against known geographical locations.
If your CI/CD pipeline lives in AWS US-East, but you are testing a GDPR-compliance banner meant for Germany, the WAF shuts you down immediately.
Testing Geo-Blocking in QA usually leads engineers to reach for the easiest, worst possible tool: a consumer VPN.
I cannot stress this enough: desktop VPNs are useless for automated deployment pipelines.
They drop connections, require manual desktop client interactions, and completely ruin your headless browser tests.
Why Traditional VPNs Fail the DevOps Test
You think your standard $5/month VPN account is going to cut it for a pipeline running 500 tests a minute? Think again.
First, VPN IP addresses are public knowledge. Enterprise firewalls subscribe to lists of known VPN exits and block them instantly.
Second, how do you automate a GUI-based VPN client inside a headless Docker container running on a Linux CI runner?
You don’t. It is a fragile, flaky mess that leads to false negatives in your test results.
We need a programmable, infrastructure-as-code solution. We need a DevOps approach.
Notice that we also spoof the HTML5 Geolocation API coordinates.
Many modern web apps check both the IP address and the browser’s internal GPS coordinates. You must spoof both.
If the IP says London, but the browser API says Ohio, the app will flag you as suspicious.
Need more context on browser permissions? Check the MDN Web Docs for the exact specifications.
Handling the “Without Documentation” Nightmare
Let’s address the elephant in the room. What happens when your own security team refuses to tell you how the WAF is configured?
This is the “without documentation” part of the job that separates the veterans from the rookies.
You have to treat your own application like a black box and reverse-engineer the defenses.
When dealing with Geo-Blocking in QA blind, I start by analyzing HTTP headers.
Header Injection and Packet Sniffing
Sometimes, firewalls aren’t doing deep packet inspection on the IP level.
Instead, they might rely on headers passed through a CDN, like Cloudflare or AWS CloudFront.
You can sometimes bypass the geographic block entirely by injecting specific headers into your test requests.
Try injecting X-Forwarded-For with an IP address from your target region.
Or, if you are behind Cloudflare, look into spoofing the CF-IPCountry header in your lower environments.
This is a dirty trick, but it saves thousands of dollars in infrastructure costs if it works.
Of course, this requires the application code to trust incoming headers, which is a massive security flaw in production.
But in a staging environment? It is a perfectly valid workaround to get your tests passing.
FAQ Section
Why is Geo-Blocking in QA necessary?
Because modern applications display different content, currencies, and compliance banners based on the user’s location. If you don’t test it, your foreign users will encounter fatal bugs.
Can I just use a free proxy list?
Absolutely not. Free proxies are notoriously slow, incredibly insecure, and almost universally blacklisted by enterprise WAFs. You will waste days debugging timeouts.
How much does a DevOps proxy mesh cost?
Pennies. By spinning up a cloud instance strictly for the duration of the 5-minute test run and destroying it immediately, you only pay for fractions of an hour.
What if my WAF blocks cloud provider IPs?
This happens with ultra-strict setups. In this case, you must route your automated tests through residential proxy networks (like Bright Data or Oxylabs), which route traffic through actual home ISPs.
Conclusion: Stop letting undocumented network configurations break your CI/CD pipelines.
By treating your test traffic exactly like your infrastructure—using code, automation, and targeted proxies-you take back control.
Conquering Geo-Blocking in QA isn’t just about making a test pass; it’s about guaranteeing a flawless experience for your global user base. Thank you for reading the DevopsRoles page!
I still remember the first time I realized the importance of Optimizing Slow Database Queries. It was 3:00 AM on a Saturday.
My pager (yes, we used pagers back then) was screaming because the main transactional database had locked up.
The CPU was pegged at 100%. The disk I/O was thrashing so hard I thought the server rack was going to take flight.
The culprit? A single, poorly written nested join that scanned a 50-million-row table without an index.
If you have been in this industry as long as I have, you know that Optimizing Slow Database Queries isn’t just a “nice to have.”
It is the difference between a peaceful weekend and a post-mortem meeting with an angry CTO.
In this guide, I’m going to skip the fluff. We are going to look at how to use native Linux utilities and open-source tools to identify and kill these performance killers.
Why Optimizing Slow Database Queries is Your #1 Priority
I’ve seen too many developers throw hardware at a software problem.
They see a slow application, so they upgrade the AWS instance type.
“Throw more RAM at it,” they say.
That might work for a week. But eventually, unoptimized queries will eat that RAM for breakfast.
Optimizing Slow Database Queries is about efficiency, not just raw power.
When you ignore query performance, you introduce latency that ripples through your entire stack.
Your API timeouts increase. Your frontend feels sluggish. Your users leave.
And frankly, it’s embarrassing to admit that your quad-core server is being brought to its knees by a `SELECT *`.
The Linux Toolkit for Diagnosing Latency
Before you even touch the database configuration, look at the OS.
Linux tells you everything if you know where to look. When I start Optimizing Slow Database Queries, I open the terminal first.
1. Top and Htop
It sounds basic, but `top` is your first line of defense.
Is the bottleneck CPU or Memory? If your `mysqld` or `postgres` process is at the top of the list with high CPU usage, you likely have a complex calculation or a sorting issue.
If the load average is high but CPU usage is low, you are waiting on I/O.
2. Iostat: The Disk Whisperer
Database queries live and die by disk speed.
Use `iostat -x 1` to watch your disk utilization in real-time.
This tool is invaluable for Optimizing Slow Database Queries because it groups similar queries and shows you the aggregate impact.
Using EXPLAIN to Dissect Logic
Once you isolate a bad SQL statement, you need to understand how the database executes it.
This is where `EXPLAIN` comes in.
Running `EXPLAIN` before a query shows you the execution plan.
Here is a simplified example of what you might see:
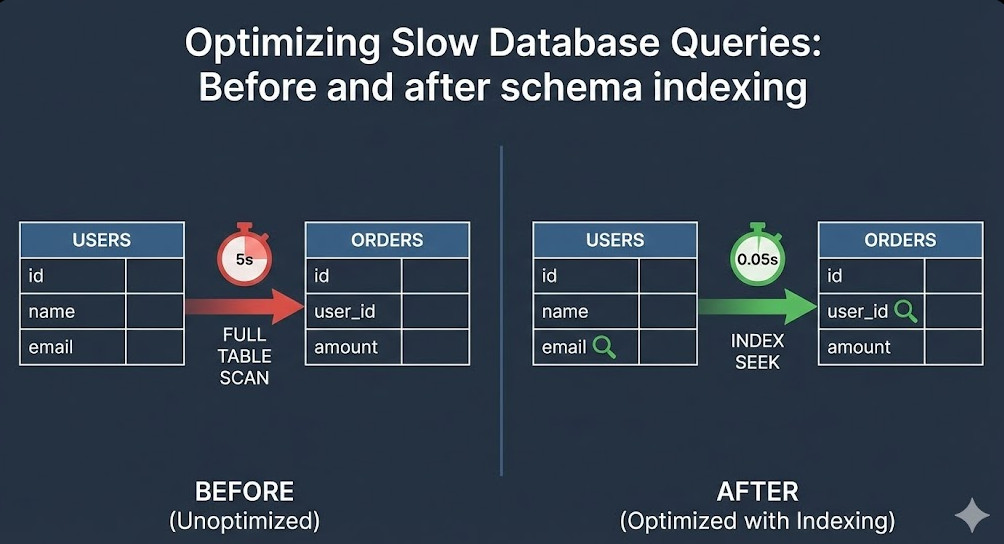
EXPLAIN SELECT * FROM users WHERE email = 'test@example.com';

+----+-------------+-------+------+---------------+------+---------+------+-------+-------------+
| id | select_type | table | type | possible_keys | key  | key_len | ref  | rows  | Extra       |
+----+-------------+-------+------+---------------+------+---------+------+-------+-------------+
|  1 | SIMPLE      | users | ALL  | NULL          | NULL | NULL    | NULL | 50000 | Using where |
+----+-------------+-------+------+---------------+------+---------+------+-------+-------------+
Look at the `type` column. It says `ALL`.
That means a Full Table Scan. It checked 50,000 rows to find one email.
That is a disaster. Optimizing Slow Database Queries in this case is as simple as adding an index on the `email` column.
Open Source Tools to Automate Optimization
I love the command line, but sometimes you need a dashboard.
There are fantastic open-source tools that visualize performance data for you.
1. PMM (Percona Monitoring and Management)
PMM is free and open-source. It hooks into your database and gives you Grafana dashboards out of the box.
It helps in Optimizing Slow Database Queries by correlating query spikes with system resource usage.
2. PgHero
If you are running PostgreSQL, PgHero is a lifesaver.
It instantly shows you unused indexes, duplicate indexes, and your most time-consuming queries.
Advanced Strategy: Caching and Archiving
Sometimes the best way to optimize a query is to not run it at all.
If you are Optimizing Slow Database Queries for a report that runs every time a user loads a dashboard, ask yourself: does this data need to be real-time?
Caching: Use Redis or Memcached to store the result of expensive queries.
Archiving: If your table has 10 years of data, but you only query the last 3 months, move the old data to an archive table.
Smaller tables mean faster indexes and faster scans.
Introduction: I have seen it happen more times than I care to count. A team spends months locking down their production cluster, configuring firewalls, and auditing every line of code. Yet, they leave their staging area wide open. Securing development environments is rarely a priority until it is too late.
I remember a specific incident in 2018. A junior dev pushed a hardcoded API key to a public repo because the dev cluster “didn’t matter.”
That key granted access to the production S3 bucket. Disaster ensued.
The truth is, attackers know your production environment is a fortress. That is why they attack your supply chain first.
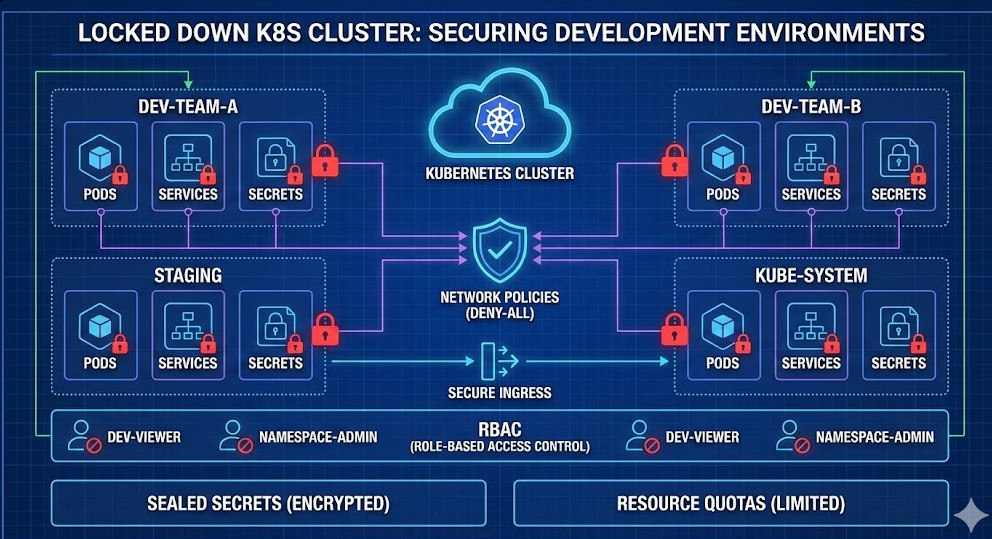
In this guide, we are going to fix that. We will look at practical, battle-tested ways to handle securing development environments within Kubernetes.
Why Securing Development Environments is Non-Negotiable
Let’s be honest for a second. We treat development clusters like the Wild West.
Developers want speed. Security teams want control. Usually, speed wins.
But here is the reality check: your development environment is a mirror of production. If an attacker owns your dev environment, they understand your architecture.
They see your variable names. They see your endpoints. They see your logic.
Securing development environments isn’t just about preventing downtime; it is about protecting your intellectual property and preventing lateral movement.
The “It’s Just Dev” Fallacy
Misconfiguration leakage: Dev configs often accidentally make it to prod.
Credential theft: Developers often have elevated privileges in dev.
Resource hijacking: Cryptominers love unsecured dev clusters.
So, how do we lock this down without making our developers hate us? Let’s dive into the technical details.
1. Network Policies: The First Line of Defense
By default, Kubernetes allows all pods to talk to all other pods. In a development environment, this is convenient. It is also dangerous.
If one compromised pod can scan your entire network, you have failed at securing development environments effectively.
You must implement a “Deny-All” policy by default. Then, whitelist only what is necessary.
Here is a standard NetworkPolicy I use to isolate namespaces:
I get it. `kubectl create clusterrolebinding` is easy.
It solves the “permission denied” errors instantly. But giving every developer `cluster-admin` access is a catastrophic failure in securing development environments.
If a developer’s laptop is compromised, the attacker now owns your cluster.
Implementing Namespace-Level Permissions
Instead, use Role-Based Access Control (RBAC) to restrict developers to their specific namespace.
They should be able to delete pods in `dev-team-a`, but they should not be able to list secrets in `kube-system`.
This approach limits the blast radius. It ensures that a mistake (or a breach) in one environment stays there.
3. Secrets Management: No More Plain Text
If I see one more `configMap` containing a database password, I might scream.
Kubernetes Secrets are base64 encoded, not encrypted. Anyone with API access can read them. This is not sufficient for securing development environments.
You need an external secrets manager. Tools like HashiCorp Vault or AWS Secrets Manager are industry standards.
However, for a lighter Kubernetes-native approach, I recommend using Sealed Secrets.
How Sealed Secrets Work
You encrypt the secret locally using a public key.
You commit the encrypted “SealedSecret” to Git (yes, it is safe).
The controller in the cluster decrypts it using the private key.
This enables GitOps without exposing credentials. It bridges the gap between usability and security.
4. Limit Resources and Quotas
Security is also about availability. A junior dev writing a memory leak loop can crash a shared node.
I once saw a single Java application consume 64GB of RAM in a dev cluster, evicting the ingress controller.
Securing development environments requires resource quotas.
This ensures that no single namespace can starve the others. It promotes good hygiene. If your app needs 8GB of RAM to run “Hello World,” you have bigger problems.
5. Automated Scanning in the CI/CD Pipeline
You cannot secure what you do not see. Manual audits are dead.
You must integrate security scanning into your CI/CD pipeline. This is often called “Shifting Left.”
Before a container ever reaches the development cluster, it should be scanned for vulnerabilities.
Tools of the Trade
Trivy: Excellent for scanning container images and filesystems.
Usually, it is friction. If security makes development painful, developers will bypass it.
“Security at the expense of usability comes at the expense of security.”
Make the secure path the easy path. Automate the creation of secure namespaces. Provide templates for NetworkPolicies.
Don’t just say “no.” Say “here is how to do it safely.”
FAQ Section
Q: Does securing development environments slow down the team?
A: Initially, yes. There is a learning curve. But fixing a security breach takes weeks. Configuring RBAC takes minutes.
Q: Can I just use a separate cluster for every developer?
A: You can, using tools like vCluster. It creates virtual clusters inside a host cluster. It is a fantastic way to achieve isolation.
Q: How often should I audit my dev environment?
A: Continuously. Use automated tools to audit daily. Do a manual review quarterly.
Conclusion:
Securing development environments is not glamorous. It won’t get you a keynote at KubeCon. But it might save your company.
We need to stop treating development clusters as playgrounds. They are part of your infrastructure. They contain your code, your secrets, and your future releases.
Start small. Implement a NetworkPolicy today. Review your RBAC tomorrow.
Take the steps. Lock it down. Sleep better at night.
Introduction: Let’s be honest: testing emails in a distributed system is usually an afterthought. But effective Email Flow Validation is the difference between a seamless user onboarding experience and a support ticket nightmare.
I remember the first time I deployed a microservice that was supposed to send “password reset” tokens. It worked perfectly on my local machine.
In production? Crickets. The queue was blocked, and the SMTP relay rejected the credentials.
In the monolith days, testing emails was easy. You had one application, one database, and likely one mail server connection.
Today, with microservices, the complexity explodes.
Your “Welcome Email” might involve an Auth Service, a User Service, a Notification Service, and a Message Queue (like RabbitMQ or Kafka) sitting in between.
Standard unit tests mock these interactions. They say, “If I call the send function, assume it returns true.”
But here is the problem:
Mocks don’t catch network latency issues.
Mocks don’t validate that the HTML template actually renders correctly.
Mocks don’t verify if the email subject line was dynamically populated.
True Email Flow Validation requires a real integration test. You need to see the email land in an inbox, parse it, and verify the contents.
The DevOps Approach to Email Testing
To solve this, we need to treat email as a traceable infrastructure component.
We shouldn’t just “fire and forget.” We need a feedback loop. This is where DevOps principles shine.
By integrating tools like Mailhog or Mailtrap into your CI/CD pipeline, you can create ephemeral SMTP servers. These catch outgoing emails during test runs, allowing your test suite to query them via API.
This transforms Email Flow Validation from a manual check into an automated gatekeeper.
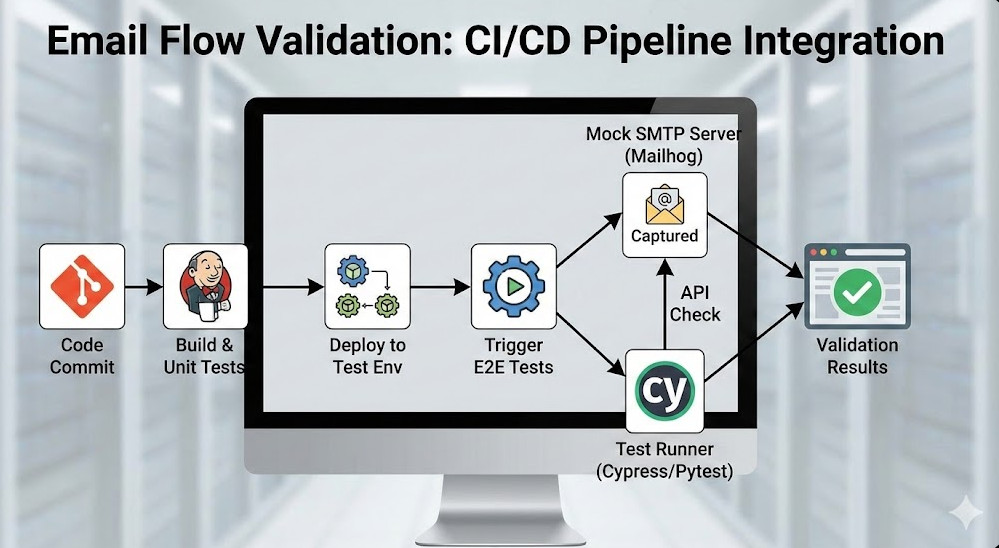
Architecture Overview
Here is how a robust validation flow looks in a DevOps environment:
Trigger: The test suite triggers an action (e.g., User Registration).
Process: The microservice processes the request and publishes an event.
Consumption: The Notification Service consumes the event and sends an SMTP request.
Capture: A containerized SMTP mock (like Mailhog) captures the email.
Validation: The test suite queries the SMTP mock API to verify the email arrived and contains the correct link.
Step-by-Step Implementation
Let’s get our hands dirty. We will set up a local environment that mimics this flow.
We will use Docker Compose to spin up our services alongside Mailhog for capturing emails.
1. Setting up the Infrastructure
First, define your services. We need our application and the mail catcher.
version: '3.8'
services:
  app:
    build: .
    environment:
      - SMTP_HOST=mailhog
      - SMTP_PORT=1025
    depends_on:
      - mailhog

  mailhog:
    image: mailhog/mailhog
    ports:
      - "1025:1025" # SMTP port
      - "8025:8025" # Web UI / API
This configuration ensures that when your app tries to send an email, it goes straight to Mailhog. No real users get spammed.
2. Writing the Validation Test
Now, let’s look at the code. This is where the magic of Email Flow Validation happens.
We need a script that triggers the email and then asks Mailhog, “Did you get it?”
Here is a Python example using `pytest` and `requests`:
import requests
import time

def test_registration_email_flow():
    # 1. Trigger the registration
    response = requests.post("http://localhost:3000/register", json={
        "email": "test@example.com",
        "password": "securepassword123"
    })
    assert response.status_code == 201

    # 2. Wait for async processing (crucial in microservices)
    time.sleep(2)

    # 3. Query Mailhog API for Email Flow Validation
    mailhog_url = "http://localhost:8025/api/v2/messages"
    messages = requests.get(mailhog_url).json()

    # 4. Filter for our specific email
    email_found = False
    for msg in messages['items']:
        if "test@example.com" in msg['Content']['Headers']['To'][0]:
            email_found = True
            body = msg['Content']['Body']
            assert "Welcome" in body
            assert "Verify your account" in body
            break

    assert email_found, "Email was not captured by Mailhog"
This script is simple but powerful. It validates the entire chain, not just the function call.
In microservices, things don’t happen instantly. The “eventual consistency” model means your email might send 500ms after your test checks for it.
This is the most common cause of flaky tests in Email Flow Validation.
Do not use static `sleep` timers like I did in the simple example above. In a real CI environment, 2 seconds might not be enough.
Instead, use a polling mechanism (retry logic) that checks the mailbox every 500ms for up to 10 seconds.
Advanced Polling Logic
def wait_for_email(recipient, timeout=10):
    start_time = time.time()
    while time.time() - start_time < timeout:
        messages = requests.get("http://localhost:8025/api/v2/messages").json()
        for msg in messages['items']:
            if recipient in msg['Content']['Headers']['To'][0]:
                return msg
        time.sleep(0.5)
    raise Exception(f"Timeout waiting for email to {recipient}")
Tools of the Trade
While we used Mailhog above, several tools can elevate your Email Flow Validation strategy.
Mailhog: Great for local development. Simple, lightweight, Docker-friendly.
Mailtrap: Excellent for staging environments. It offers persistent inboxes and team features.
AWS SES Simulator: If you are heavy on AWS, you can use their simulator, though it is harder to query programmatically.
Choosing the right tool depends on your specific pipeline needs.
Common Pitfalls to Avoid
I have seen many teams fail at this. Here is what you need to watch out for.
1. Ignoring Rate Limits
If you run parallel tests, you might flood your mock server. Ensure your Email Flow Validation infrastructure can handle the load.
2. Hardcoding Content Checks
Marketing teams change email copy all the time. If your test fails because “Welcome!” changed to “Hi there!”, your tests are too brittle.
Validate the structure and critical data (like tokens or links), not the fluff.
3. Forgetting to Clean Up
After a test run, clear the Mailhog inbox. If you don’t, your next test run might validate an old email from a previous session.
# Example API call to delete all messages in Mailhog
curl -X DELETE http://localhost:8025/api/v1/messages
Why This Matters for SEO and User Trust
You might wonder, “Why does a journalist care about email testing?”
Because broken emails break trust. If a user can’t reset their password, they churn. If they churn, your traffic drops.
Reliable Email Flow Validation ensures that your transactional emails—the lifeblood of user retention—are always functioning.
For further reading on the original inspiration for this workflow, check out the source at Dev.to.
FAQ Section
Can I use Gmail for testing? Technically yes, but you will hit rate limits and spam filters immediately. Use a mock server.
How do I test email links? Parse the email body (HTML or Text), extract the href using Regex or a DOM parser, and have your test runner visit that URL.
Is this relevant for monoliths? Absolutely. While Email Flow Validation is critical for microservices, monoliths benefit from the same rigor.
Conclusion: Stop guessing if your emails work. By implementing a robust Email Flow Validation strategy within your DevOps pipeline, you gain confidence, reduce bugs, and sleep better at night. Start small, dockerize your mail server, and automate the loop. Thank you for reading the DevopsRoles page!
In the fast-paced world of modern web development, building robust and scalable applications with React demands more than just proficient coding. It requires a development ecosystem that is consistent, reproducible, and efficient across all team members and stages of the software lifecycle. This is precisely where the power of React Isolated Development Environments DevOps comes into play. The perennial challenge of “it works on my machine” has plagued developers for decades, leading to wasted time, frustrating debugging sessions, and delayed project timelines. By embracing a DevOps approach to isolating React development environments, teams can unlock unparalleled efficiency, streamline collaboration, and ensure seamless transitions from development to production.
This deep-dive guide will explore the critical need for isolated development environments in React projects, delve into the core principles of a DevOps methodology, and highlight the open-source tools that make this vision a reality. We’ll cover practical implementation strategies, advanced best practices, and the transformative impact this approach has on developer productivity and overall project success. Prepare to elevate your React development workflow to new heights of consistency and reliability.
The Imperative for Isolated Development Environments in React
The complexity of modern React applications, often involving numerous dependencies, specific Node.js versions, and intricate build processes, makes environment consistency a non-negotiable requirement. Without proper isolation, developers frequently encounter discrepancies that hinder progress and introduce instability.
The “Works on My Machine” Syndrome
This infamous phrase is a symptom of inconsistent development environments. Differences in operating systems, Node.js versions, global package installations, or even environment variables can cause code that functions perfectly on one developer’s machine to fail inexplicably on another’s. This leads to significant time loss as developers struggle to replicate issues, often resorting to trial-and-error debugging rather than focused feature development.
Ensuring Consistency and Reproducibility
An isolated environment guarantees that every developer, tester, and CI/CD pipeline operates on an identical setup. This means the exact same Node.js version, npm/Yarn packages, and system dependencies are present, eliminating environmental variables as a source of bugs. Reproducibility is key for reliable testing, accurate bug reporting, and confident deployments, ensuring that what works in development will work in staging and production.
Accelerating Developer Onboarding
Bringing new team members up to speed on a complex React project can be a daunting task, often involving lengthy setup guides and troubleshooting sessions. With an isolated environment, onboarding becomes a matter of cloning a repository and running a single command. The entire development stack is pre-configured and ready to go, drastically reducing the time to productivity for new hires and contractors.
Mitigating Dependency Conflicts
React projects rely heavily on a vast ecosystem of npm packages. Managing these dependencies, especially across multiple projects or different versions, can lead to conflicts. Isolated environments, particularly those leveraging containerization, encapsulate these dependencies within their own sandboxes, preventing conflicts with other projects on a developer’s local machine or with global installations.
Core Principles of a DevOps Approach to Environment Isolation
Adopting a DevOps mindset is crucial for successfully implementing and maintaining isolated development environments. It emphasizes automation, collaboration, and continuous improvement across the entire software delivery pipeline.
Infrastructure as Code (IaC)
IaC is the cornerstone of a DevOps approach to environment isolation. Instead of manually configuring environments, IaC defines infrastructure (like servers, networks, and in our case, development environments) using code. For React development, this means defining your Node.js version, dependencies, and application setup in configuration files (e.g., Dockerfiles, Docker Compose files) that are version-controlled alongside your application code. This ensures consistency, enables easy replication, and allows for peer review of environment configurations.
Containerization (Docker)
Containers are the primary technology enabling true environment isolation. Docker, the leading containerization platform, allows developers to package an application and all its dependencies into a single, portable unit. This container can then run consistently on any machine that has Docker installed, regardless of the underlying operating system. For React, a Docker container can encapsulate the Node.js runtime, npm/Yarn, project dependencies, and even the application code itself, providing a pristine, isolated environment.
Automation and Orchestration
DevOps thrives on automation. Setting up and tearing down isolated environments should be an automated process, not a manual one. Tools like Docker Compose automate the orchestration of multiple containers (e.g., a React frontend container, a backend API container, a database container) that together form a complete development stack. This automation extends to CI/CD pipelines, where environments can be spun up for testing and then discarded, ensuring clean and repeatable builds.
Version Control for Environments
Just as application code is version-controlled, so too should environment definitions be. Storing Dockerfiles, Docker Compose files, and other configuration scripts in a Git repository alongside your React project ensures that changes to the environment are tracked, reviewed, and can be rolled back if necessary. This practice reinforces consistency and provides a clear history of environment evolution.
Key Open Source Tools for React Environment Isolation
Leveraging the right open-source tools is fundamental to building effective React Isolated Development Environments DevOps solutions. These tools provide the backbone for containerization, dependency management, and workflow automation.
Docker and Docker Compose: The Foundation
Docker is indispensable for creating isolated environments. A Dockerfile defines the steps to build a Docker image, specifying the base operating system, installing Node.js, copying application files, and setting up dependencies. Docker Compose then allows you to define and run multi-container Docker applications. For a React project, this might involve a container for your React frontend, another for a Node.js or Python backend API, and perhaps a third for a database like MongoDB or PostgreSQL. Docker Compose simplifies the management of these interconnected services, making it easy to spin up and tear down the entire development stack with a single command.
Node.js and npm/Yarn: React’s Core
React applications are built on Node.js, using npm or Yarn for package management. Within an isolated environment, a specific version of Node.js is installed inside the container, ensuring that all developers are using the exact same runtime. This eliminates issues arising from different Node.js versions or globally installed packages conflicting with project-specific requirements. The package.json and package-lock.json (or yarn.lock) files are crucial here, ensuring deterministic dependency installations within the container.
Version Managers (nvm, Volta)
While containers encapsulate Node.js versions, local Node.js version managers like nvm (Node Version Manager) or Volta still have a role. They can be used to manage the Node.js version *on the host machine* for tasks that might run outside a container, or for developing projects that haven’t yet adopted containerization. However, for truly isolated React development, the Node.js version specified within the Dockerfile takes precedence.
Code Editors and Extensions (VS Code, ESLint, Prettier)
Modern code editors like VS Code offer powerful integrations with Docker. Features like “Remote – Containers” allow developers to open a project folder that is running inside a Docker container. This means that all editor extensions (e.g., ESLint, Prettier, TypeScript support) run within the context of the container’s environment, ensuring that linting rules, formatting, and language services are consistent with the project’s defined dependencies and configurations. This seamless integration enhances the developer experience significantly.
CI/CD Tools (Jenkins, GitLab CI, GitHub Actions)
While not directly used for local environment isolation, CI/CD tools are integral to the DevOps approach. They leverage the same container images and Docker Compose configurations used in development to build, test, and deploy React applications. This consistency across environments minimizes deployment risks and ensures that the application behaves identically in all stages of the pipeline.
Practical Implementation: Building Your Isolated React Dev Environment
Setting up a React Isolated Development Environments DevOps workflow involves a few key steps, primarily centered around Docker and Docker Compose. Let’s outline a conceptual approach.
Setting Up Your Dockerfile for React
A basic Dockerfile for a React application typically starts with a Node.js base image. It then sets a working directory, copies the package.json and package-lock.json files, installs dependencies, copies the rest of the application code, and finally defines the command to start the React development server. For example:
# Use an official Node.js runtime as a parent image
FROM node:18-alpine

# Set the working directory
WORKDIR /app

# Copy package.json and package-lock.json
COPY package*.json ./

# Install app dependencies
RUN npm install

# Copy app source code
COPY . .

# Expose the port the app runs on
EXPOSE 3000

# Define the command to run the app
CMD ["npm", "start"]
This Dockerfile ensures that the environment is consistent, regardless of the host machine’s configuration.
Orchestrating with Docker Compose
For a more complex setup, such as a React frontend interacting with a Node.js backend API and a database, Docker Compose is essential. A docker-compose.yml file would define each service, their dependencies, exposed ports, and shared volumes. For instance:
This setup allows developers to bring up the entire application stack with a single docker-compose up command, providing a fully functional and isolated development environment.
Local Development Workflow within Containers
The beauty of this approach is that the local development workflow remains largely unchanged. Developers write code in their preferred editor on their host machine. Thanks to volume mounting (as shown in the Docker Compose example), changes made to the code on the host are immediately reflected inside the container, triggering hot module replacement (HMR) for React applications. This provides a seamless development experience while benefiting from the isolated environment.
Integrating Hot Module Replacement (HMR)
For React development, Hot Module Replacement (HMR) is crucial for a productive workflow. When running React applications inside Docker containers, ensuring HMR works correctly sometimes requires specific configurations. Often, setting environment variables like CHOKIDAR_USEPOLLING=true within the frontend service in your docker-compose.yml can resolve issues related to file change detection, especially on macOS or Windows with Docker Desktop, where file system events might not propagate instantly into the container.
Advanced Strategies and Best Practices
To maximize the benefits of React Isolated Development Environments DevOps, consider these advanced strategies and best practices.
Environment Variables and Configuration Management
Sensitive information and environment-specific configurations (e.g., API keys, database URLs) should be managed using environment variables. Docker Compose allows you to define these directly in the .env file or within the docker-compose.yml. For production, consider dedicated secret management solutions like Docker Secrets or Kubernetes Secrets, or cloud-native services like AWS Secrets Manager or Azure Key Vault, to securely inject these values into your containers.
Volume Mounting for Persistent Data and Code Sync
Volume mounting is critical for two main reasons: persisting data and syncing code. For databases, named volumes (like mongo-data in the example) ensure that data persists even if the container is removed. For code, bind mounts (e.g., ./frontend:/app) synchronize changes between your host machine’s file system and the container’s file system, enabling real-time development and HMR. It’s also good practice to mount /app/node_modules as a separate volume to prevent host-specific node_modules from interfering and to speed up container rebuilds.
Optimizing Container Images for Development
While production images should be as small as possible, development images can prioritize speed and convenience. This might mean including development tools, debuggers, or even multiple Node.js versions if necessary for specific tasks. However, always strive for a balance to avoid excessively large images that slow down build and pull times. Utilize multi-stage builds to create separate, optimized images for development and production.
Security Considerations in Isolated Environments
Even in isolated development environments, security is paramount. Regularly update base images to patch vulnerabilities. Avoid running containers as the root user; instead, create a non-root user within your Dockerfile. Be cautious about exposing unnecessary ports or mounting sensitive host directories into containers. Implement proper access controls for your version control system and CI/CD pipelines.
Scaling with Kubernetes (Brief Mention for Future)
While Docker and Docker Compose are excellent for local development and smaller deployments, for large-scale React applications and complex microservices architectures, Kubernetes becomes the orchestrator of choice. The principles of containerization and IaC learned with Docker translate directly to Kubernetes, allowing for seamless scaling, self-healing, and advanced deployment strategies in production environments.
The Transformative Impact on React Development and Team Collaboration
Embracing React Isolated Development Environments DevOps is not merely a technical adjustment; it’s a paradigm shift that profoundly impacts developer productivity, team dynamics, and overall project quality.
Enhanced Productivity and Focus
Developers spend less time troubleshooting environment-related issues and more time writing code and building features. The confidence that their local environment mirrors production allows them to focus on logic and user experience, leading to faster development cycles and higher-quality output.
Streamlined Code Reviews and Testing
With consistent environments, code reviews become more efficient as reviewers can easily spin up the exact environment used by the author. Testing becomes more reliable, as automated tests run in environments identical to development, reducing the likelihood of environment-specific failures and false positives.
Reduced Deployment Risks
The ultimate goal of DevOps is reliable deployments. By using the same container images and configurations across development, testing, and production, the risk of unexpected issues arising during deployment is significantly reduced. This consistency builds confidence in the deployment process and enables more frequent, smaller releases.
Fostering a Culture of Consistency
This approach cultivates a culture where consistency, automation, and collaboration are valued. It encourages developers to think about the entire software lifecycle, from local development to production deployment, fostering a more holistic and responsible approach to software engineering.
Key Takeaways
Eliminate “Works on My Machine” Issues: Isolated environments ensure consistency across all development stages.
Accelerate Onboarding: New developers can set up their environment quickly and efficiently.
Leverage DevOps Principles: Infrastructure as Code, containerization, and automation are central.
Utilize Open Source Tools: Docker and Docker Compose are foundational for React environment isolation.
Ensure Reproducibility: Consistent environments lead to reliable testing and deployments.
Enhance Productivity: Developers focus on coding, not environment setup and debugging.
Streamline Collaboration: Shared, consistent environments improve code reviews and team synergy.
FAQ Section
Q1: Is isolating React development environments overkill for small projects?
A1: While the initial setup might seem like an extra step, the benefits of isolated environments, even for small React projects, quickly outweigh the overhead. They prevent future headaches related to dependency conflicts, simplify onboarding, and ensure consistency as the project grows or new team members join. It establishes good practices from the start, making scaling easier.
Q2: How do isolated environments handle different Node.js versions for various projects?
A2: This is one of the primary advantages. Each isolated environment (typically a Docker container) specifies its own Node.js version within its Dockerfile. This means you can seamlessly switch between different React projects, each requiring a distinct Node.js version, without any conflicts or the need to manually manage versions on your host machine using tools like nvm or Volta. Each project’s environment is self-contained.
Q3: How do these isolated environments integrate with Continuous Integration/Continuous Deployment (CI/CD) pipelines?
A3: The integration is seamless and highly beneficial. The same Dockerfiles and Docker Compose configurations used for local development can be directly utilized in CI/CD pipelines. This ensures that the build and test environments in CI/CD are identical to the development environments, minimizing discrepancies and increasing confidence in automated tests and deployments. Containers provide a portable, consistent execution environment for every stage of the pipeline.
Conclusion
The journey to mastering React Isolated Development Environments DevOps is a strategic investment that pays dividends in developer productivity, project reliability, and team cohesion. By embracing containerization with Docker, defining environments as code, and automating the setup process, development teams can effectively banish the “works on my machine” syndrome and cultivate a truly consistent, reproducible, and efficient workflow. This approach not only streamlines the development of complex React applications but also fosters a culture of technical excellence and collaboration. As React continues to evolve, adopting these DevOps principles for environment isolation will remain a cornerstone of successful and sustainable web development. Start implementing these strategies today and transform your React development experience. Thank you for reading the DevopsRoles page!