Table of Contents
Introduction
In this tutorial, I write about the Systemd cheat sheet useful in Linux. Systemd provides a system and service that runs at PID 1. It tracks logged-in users and runs containers virtual machines and more.
The Linux Systemd Cheat Sheet is a handy guide that provides quick and easy-to-understand information about Systemd. Systemd is a system and service manager for Linux operating systems, and this cheat sheet is designed to help users navigate and utilize its features efficiently.
Whether you’re a beginner or an experienced Linux user, this cheat sheet covers essential commands and functions related to Systemd. From starting and stopping services to managing system processes, the cheat sheet is a valuable resource for anyone looking to streamline their Linux system management tasks.
With the Linux Systemd Cheat Sheet, you can quickly reference key Systemd commands, making it easier to troubleshoot issues, configure services, and optimize system performance. This user-friendly guide aims to empower Linux users with the knowledge they need to navigate Systemd effectively, ensuring a smoother and more efficient system administration experience.
Systemd Cheat Sheet in Linux
Logs with systemd
| The content | Command Line |
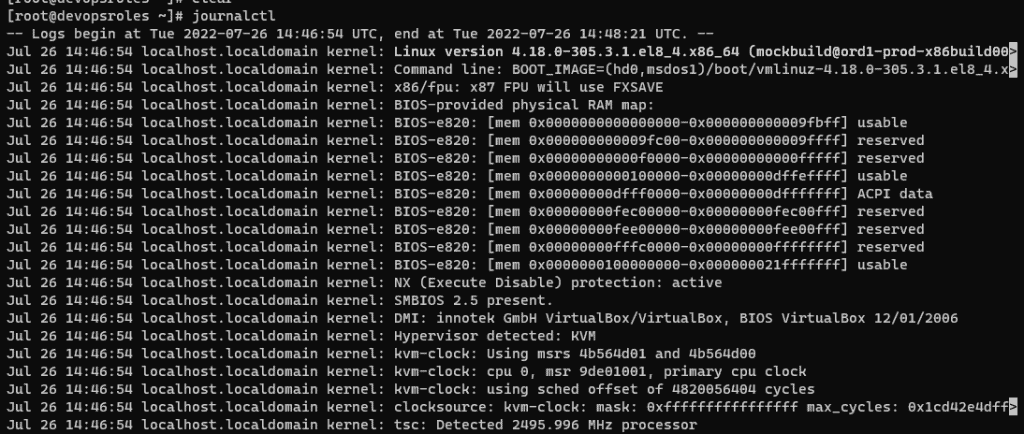
| View all system logs | journalctl |
| List boot numbers | journalctl –list-boots |
| View logs for unit ssh | journalctl –unit ssh |
| View system logs from the most recent | journalctl -xe |
For example the picture below


Introspection with systemd
| The content | Command Line |
| show unit file settings | systemctl show sshd |
| Show contents of the unit file | systemctl cat sshd |
| Show whether the unit is active | systemctl is-active sshd |
| Show whether the unit has failed | systemctl is-failed sshd |
| Edit unit file configuration | sudo systemctl edit sshd |
| Restart daemon | sudo systemctl daemon-reload |
Services
| The content | Command Line |
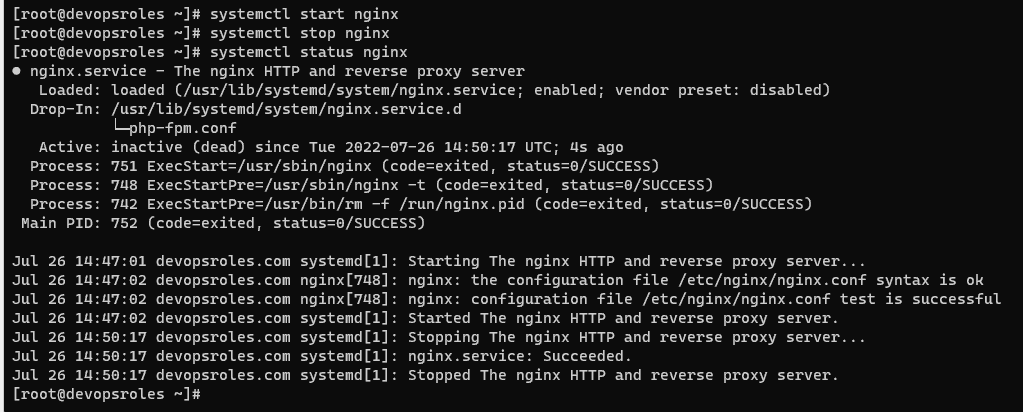
| Start service nginx | systemctl start nginx |
| Stop service nginx | systemctl stop nginx |
| Show status of service nginx | systemctl status nginx |
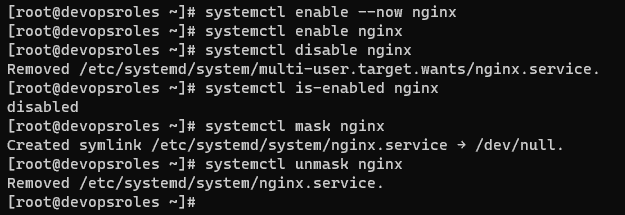
| Start nginx now and at system startup | systemctl enable –now nginx |
| At system startup, start (enable) nginx | systemctl enable nginx |
| At system startup, do not start nginx | systemctl disable nginx |
| Show whether service nginx is enabled | systemctl is-enabled nginx |
| Prevent service from starting (mask) | systemctl mask nginx |
| Unmask service, allowing it to be started | systemctl unmask nginx |
| List all available services | systemctl list-unit-files –-type service |
For example as below


Targets (runlevels)
Targets, also known as runlevels in Linux, play a crucial role in managing the system’s state and functionality. Think of targets as different modes or scenarios your computer can operate in, each with a specific set of services and processes.
In simpler terms, runlevels help define what your computer is supposed to do at different stages – be it during startup, regular operation, or shutdown. For instance, runlevel 3 might focus on a multi-user environment with networking capabilities, while runlevel 5 could include a graphical user interface for a more user-friendly experience.
These runlevels or targets allow users to customize and control the behavior of their Linux system based on their needs. Whether you’re setting up a server that doesn’t require a graphical interface or a desktop environment for everyday use, understanding and configuring runlevels is essential for tailoring your Linux experience.
| The content | Command line |
| List all available targets | systemctl list-unit-files –-type target |
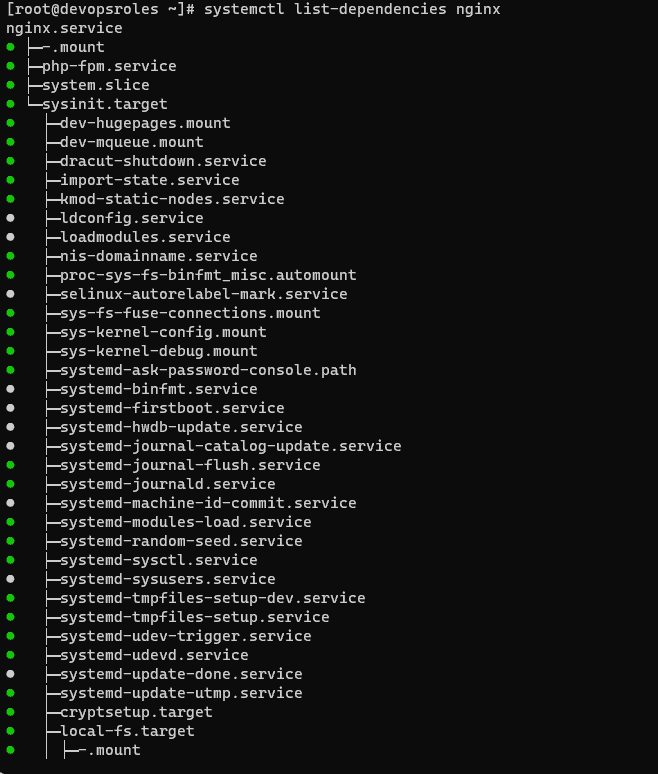
| Show dependencies of a target | systemctl list-dependencies nginx |
| Show default boot target | systemctl get-default |
| Boot to a text console | systemctl set-default multi-user |
| Boot to a graphical desktop | systemctl set-default graphical |

FAQ Section
1. What is the difference between systemctl and journalctl?
systemctl manages services, units, and targets, while journalctl is used to view logs maintained by Systemd.
2. Can Systemd work alongside other init systems?
Yes, but it’s not recommended as conflicts can arise. Most modern Linux distributions have fully transitioned to Systemd.
3. How do I troubleshoot failed services?
Use:
systemctl status <service-name>Then, check logs with:
journalctl -u <service-name>External Resources
Conclusion
You should utilize the helpful Systemd Cheat Sheet in Linux. The cheat sheet includes fundamental systemd commands, and there are even more advanced features and options to explore. For detailed information about specific commands or options, you can check the systemd documentation or man pages (man systemctl). I hope you find this information useful. Thank you for visiting the DevopsRoles page!”