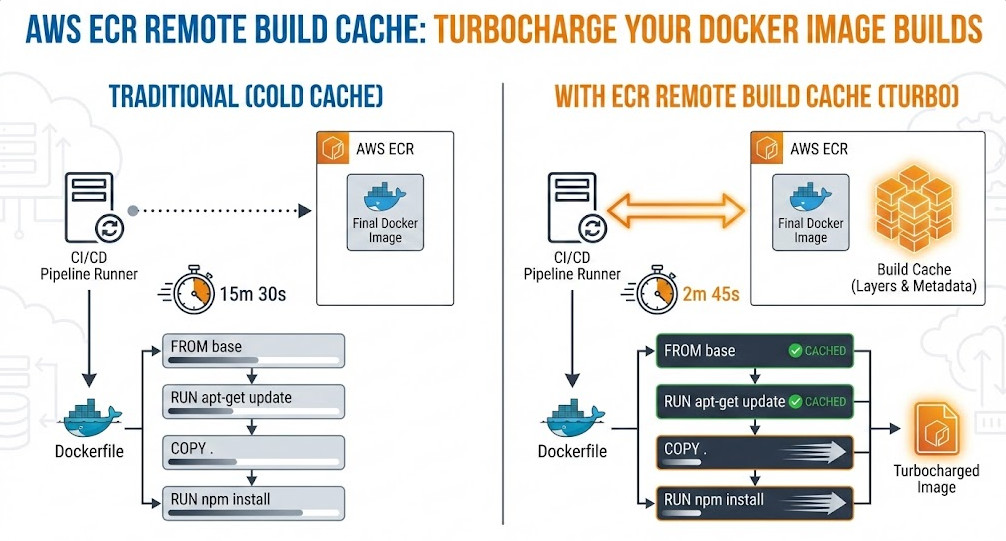
Deploy Dockerized App on ECS with Fargate: A Comprehensive Guide

Welcome to the definitive guide for DevOps engineers, SREs, and developers looking to master container orchestration on AWS. In today’s cloud-native landscape, running containers efficiently, securely, and at scale is paramount. While Kubernetes (EKS) often grabs the headlines, Amazon’s Elastic Container Service (ECS) paired with AWS Fargate offers a powerfully simple, serverless alternative. This article provides a deep, step-by-step tutorial to Deploy Dockerized App ECS Fargate, transforming your application from a local Dockerfile to a highly available, scalable service in the AWS cloud.

We’ll move beyond simple “click-ops” and focus on the “why” behind each step, from setting up your network infrastructure to configuring task definitions and load balancers. By the end, you’ll have a production-ready deployment pattern you can replicate and automate.

Why Choose ECS with Fargate?

Before we dive into the “how,” let’s establish the “why.” Why choose ECS with Fargate over other options like ECS on EC2 or even EKS?

The Serverless Container Experience

The primary advantage is Fargate. It’s a serverless compute engine for containers. When you use the Fargate launch type, you no longer need to provision, manage, or scale a cluster of EC2 instances to run your containers. You simply define your application’s requirements (CPU, memory), and Fargate launches and manages the underlying infrastructure for you. This means:

  • No Patching: You are not responsible for patching or securing the underlying host OS.
  • Right-Sized Resources: You pay for the vCPU and memory resources your application requests, not for an entire EC2 instance.
  • Rapid Scaling: Fargate can scale up and down quickly, launching new container instances in seconds without waiting for EC2 instances to boot.
  • Security Isolation: Each Fargate task runs in its own isolated kernel environment, enhancing security.

ECS vs. Fargate vs. EC2 Launch Types

It’s important to clarify the terms. ECS is the control plane (the orchestrator), while Fargate and EC2 are launch types (the data plane where containers run).

FeatureECS with FargateECS on EC2
Infrastructure ManagementNone. Fully managed by AWS.You manage the EC2 instances (patching, scaling, securing).
Pricing ModelPer-task vCPU and memory/second.Per-EC2 instance/second (regardless of utilization).
ControlLess control over the host environment.Full control. Can use specific AMIs, daemonsets, etc.
Use CaseMost web apps, microservices, batch jobs.Apps with specific compliance, GPU, or host-level needs.

For most modern applications, the simplicity and operational efficiency of Fargate make it the default choice. You can learn more directly from the official AWS Fargate page.

Prerequisites for Deployment

Before we begin the deployment, let’s gather our tools and assets.

1. A Dockerized Application

You need an application containerized with a Dockerfile. For this tutorial, we’ll use a simple Node.js “Hello World” web server. If you already have an image in ECR, you can skip to Step 2.

Create a directory for your app and add these three files:

Dockerfile

# Use an official Node.js runtime as a parent image
FROM node:18-alpine

# Set the working directory in the container
WORKDIR /usr/src/app

# Copy package.json and package-lock.json
COPY package*.json ./

# Install app dependencies
RUN npm install

# Bundle app's source
COPY . .

# Expose the port the app runs on
EXPOSE 8080

# Define the command to run the app
CMD [ "node", "index.js" ]

index.js

const http = require('http');

const port = 8080;

const server = http.createServer((req, res) => {
  res.statusCode = 200;
  res.setHeader('Content-Type', 'text/plain');
  res.end('Hello from ECS Fargate!\n');
});

server.listen(port, () => {
  console.log(`Server running at http://localhost:${port}/`);
});

package.json

{
  "name": "ecs-fargate-demo",
  "version": "1.0.0",
  "description": "Simple Node.js app for Fargate",
  "main": "index.js",
  "scripts": {
    "start": "node index.js"
  },
  "dependencies": {}
}

2. AWS Account & CLI

You’ll need an AWS account with IAM permissions to manage ECS, ECR, VPC, IAM roles, and Load Balancers. Ensure you have the AWS CLI installed and configured with your credentials.

3. Amazon ECR Repository

Your Docker image needs to live in a registry. We’ll use Amazon Elastic Container Registry (ECR).

Create a new repository:

aws ecr create-repository \
    --repository-name ecs-fargate-demo \
    --region us-east-1

Make a note of the repositoryUri in the output. It will look something like 123456789012.dkr.ecr.us-east-1.amazonaws.com/ecs-fargate-demo.

Step-by-Step Guide to Deploy Dockerized App ECS Fargate

This is the core of our tutorial. Follow these steps precisely to get your application running.

Step 1: Build and Push Your Docker Image to ECR

First, we build our local Dockerfile, tag it for ECR, and push it to our new repository.

# 1. Get your AWS Account ID
AWS_ACCOUNT_ID=$(aws sts get-caller-identity --query Account --output text)

# 2. Define repository variables
REPO_NAME="ecs-fargate-demo"
REGION="us-east-1"
REPO_URI="${AWS_ACCOUNT_ID}.dkr.ecr.${REGION}.amazonaws.com/${REPO_NAME}"

# 3. Log in to ECR
aws ecr get-login-password --region ${REGION} | docker login --username AWS --password-stdin ${REPO_URI}

# 4. Build the Docker image
# Make sure you are in the directory with your Dockerfile
docker build -t ${REPO_NAME} .

# 5. Tag the image for ECR
docker tag ${REPO_NAME}:latest ${REPO_URI}:latest

# 6. Push the image to ECR
docker push ${REPO_URI}:latest

Your application image is now stored in ECR, ready to be pulled by ECS.

Step 2: Set Up Your Networking (VPC)

A Fargate task *always* runs inside a VPC (Virtual Private Cloud). For a production-ready setup, we need:

  • A VPC.
  • At least two public subnets for our Application Load Balancer (ALB).
  • At least two private subnets for our Fargate tasks (for security).
  • An Internet Gateway (IGW) attached to the VPC.
  • A NAT Gateway in a public subnet to allow tasks in private subnets to access the internet (e.g., to pull images or talk to external APIs).
  • Route tables to connect everything.

Setting this up manually is tedious. The easiest way is to use the “VPC with public and private subnets” template in the AWS VPC Wizard or use an existing “default” VPC for simplicity (though not recommended for production).

For this guide, let’s assume you have a default VPC. We will use its public subnets for both the ALB and the Fargate task for simplicity. In production, always place tasks in private subnets.

We need a Security Group for our Fargate task. This acts as a virtual firewall.

# 1. Get your default VPC ID
VPC_ID=$(aws ec2 describe-vpcs --filters "Name=isDefault,Values=true" --query "Vpcs[0].VpcId" --output text)

# 2. Create a Security Group for the Fargate task
TASK_SG_ID=$(aws ec2 create-security-group \
    --group-name "fargate-task-sg" \
    --description "Allow traffic to Fargate task" \
    --vpc-id ${VPC_ID} \
    --query "GroupId" --output text)

# 3. Add a rule to allow traffic on port 8080 (our app's port)
# We will later restrict this to only the ALB's Security Group
aws ec2 authorize-security-group-ingress \
    --group-id ${TASK_SG_ID} \
    --protocol tcp \
    --port 8080 \
    --cidr 0.0.0.0/0

Step 3: Create an ECS Cluster

An ECS Cluster is a logical grouping of tasks or services. For Fargate, it’s just a namespace.

aws ecs create-cluster --cluster-name "fargate-demo-cluster"

That’s it. No instances to provision. Just a simple command.

Step 4: Configure an Application Load Balancer (ALB)

We need an ALB to distribute traffic to our Fargate tasks and give us a single DNS endpoint. This is a multi-step process.

# 1. Get two public subnet IDs from your default VPC
SUBNET_IDS=$(aws ec2 describe-subnets \
    --filters "Name=vpc-id,Values=${VPC_ID}" "Name=map-public-ip-on-launch,Values=true" \
    --query "Subnets[0:2].SubnetId" \
    --output text)

# 2. Create a Security Group for the ALB
ALB_SG_ID=$(aws ec2 create-security-group \
    --group-name "fargate-alb-sg" \
    --description "Allow HTTP traffic to ALB" \
    --vpc-id ${VPC_ID} \
    --query "GroupId" --output text)

# 3. Add ingress rule to allow HTTP (port 80) from the internet
aws ec2 authorize-security-group-ingress \
    --group-id ${ALB_SG_ID} \
    --protocol tcp \
    --port 80 \
    --cidr 0.0.0.0/0

# 4. Create the Application Load Balancer
ALB_ARN=$(aws elbv2 create-load-balancer \
    --name "fargate-demo-alb" \
    --subnets ${SUBNET_IDS} \
    --security-groups ${ALB_SG_ID} \
    --query "LoadBalancers[0].LoadBalancerArn" --output text)

# 5. Create a Target Group (where the ALB will send traffic)
TG_ARN=$(aws elbv2 create-target-group \
    --name "fargate-demo-tg" \
    --protocol HTTP \
    --port 8080 \
    --vpc-id ${VPC_ID} \
    --target-type ip \
    --health-check-path / \
    --query "TargetGroups[0].TargetGroupArn" --output text)

# 6. Create a Listener for the ALB (listens on port 80)
aws elbv2 create-listener \
    --load-balancer-arn ${ALB_ARN} \
    --protocol HTTP \
    --port 80 \
    --default-actions Type=forward,TargetGroupArn=${TG_ARN}

# 7. (Security Best Practice) Now, update the Fargate task SG
# to ONLY allow traffic from the ALB's security group
aws ec2 revoke-security-group-ingress \
    --group-id ${TASK_SG_ID} \
    --protocol tcp \
    --port 8080 \
    --cidr 0.0.0.0/0

aws ec2 authorize-security-group-ingress \
    --group-id ${TASK_SG_ID} \
    --protocol tcp \
    --port 8080 \
    --source-group ${ALB_SG_ID}

Step 5: Create an ECS Task Definition

The Task Definition is the blueprint for your application. It defines the container image, CPU/memory, ports, and IAM roles.

First, we need an ECS Task Execution Role. This role grants ECS permission to pull your ECR image and write logs to CloudWatch.

# 1. Create the trust policy for the role
cat > ecs-execution-role-trust.json <

Now, create the Task Definition JSON file. Replace YOUR_ACCOUNT_ID and YOUR_REGION or use the variables from Step 1.

task-definition.json

{
  "family": "fargate-demo-task",
  "networkMode": "awsvpc",
  "requiresCompatibilities": [
    "FARGATE"
  ],
  "cpu": "1024",
  "memory": "2048",
  "executionRoleArn": "arn:aws:iam::YOUR_ACCOUNT_ID:role/ecs-task-execution-role",
  "containerDefinitions": [
    {
      "name": "fargate-demo-container",
      "image": "YOUR_ACCOUNT_ID.dkr.ecr.YOUR_REGION.amazonaws.com/ecs-fargate-demo:latest",
      "portMappings": [
        {
          "containerPort": 8080,
          "hostPort": 8080,
          "protocol": "tcp"
        }
      ],
      "essential": true,
      "logConfiguration": {
        "logDriver": "awslogs",
        "options": {
          "awslogs-group": "/ecs/fargate-demo-task",
          "awslogs-region": "YOUR_REGION",
          "awslogs-stream-prefix": "ecs"
        }
      }
    }
  ]
}

Note: cpu: "1024" (1 vCPU) and memory: "2048" (2GB RAM) are defined. You can adjust these. Fargate has specific valid CPU/memory combinations.

Now, register this task definition:

# Don't forget to replace the placeholders in the JSON file first!
# You can use sed or just manually edit it.
# Example using sed:
# sed -i "s/YOUR_ACCOUNT_ID/${AWS_ACCOUNT_ID}/g" task-definition.json
# sed -i "s/YOUR_REGION/${REGION}/g" task-definition.json

aws ecs register-task-definition --cli-input-json file://task-definition.json

Step 6: Create the ECS Service

The final step! The ECS Service is responsible for running and maintaining a specified number (the "desired count") of your tasks. It connects the Task Definition, Cluster, ALB, and Networking.

# 1. Get your public subnet IDs again (we'll use them for the task)
# In production, these should be PRIVATE subnets.
SUBNET_ID_1=$(echo ${SUBNET_IDS} | awk '{print $1}')
SUBNET_ID_2=$(echo ${SUBNET_IDS} | awk '{print $2}')

# 2. Create the service
aws ecs create-service \
    --cluster "fargate-demo-cluster" \
    --service-name "fargate-demo-service" \
    --task-definition "fargate-demo-task" \
    --desired-count 2 \
    --launch-type "FARGATE" \
    --network-configuration "awsvpcConfiguration={subnets=[${SUBNET_ID_1},${SUBNET_ID_2}],securityGroups=[${TASK_SG_ID}],assignPublicIp=ENABLED}" \
    --load-balancers "targetGroupArn=${TG_ARN},containerName=fargate-demo-container,containerPort=8080" \
    --health-check-grace-period-seconds 60

# Note: assignPublicIp=ENABLED is only needed if tasks are in public subnets.
# If in private subnets with a NAT Gateway, set this to DISABLED.

Step 7: Verify the Deployment

Your service is now deploying. It will take a minute or two for the tasks to start, pass health checks, and register with the ALB.

You can check the status in the AWS ECS Console, or get the ALB's DNS name to access your app:

# Get the ALB's public DNS name
ALB_DNS=$(aws elbv2 describe-load-balancers \
    --load-balancer-arns ${ALB_ARN} \
    --query "LoadBalancers[0].DNSName" --output text)

echo "Your app is available at: http://${ALB_DNS}"

# You can also check the status of your service's tasks
aws ecs list-tasks --cluster "fargate-demo-cluster" --service-name "fargate-demo-service"

Open the http://... URL in your browser. You should see "Hello from ECS Fargate!"

Advanced Configuration and Best Practices

Managing Secrets with AWS Secrets Manager

Never hardcode secrets (like database passwords) in your Dockerfile or Task Definition. Instead, store them in AWS Secrets Manager or SSM Parameter Store. You can then inject them into your container at runtime by modifying the containerDefinitions in your task definition:

"secrets": [
    {
        "name": "DB_PASSWORD",
        "valueFrom": "arn:aws:secretsmanager:us-east-1:123456789012:secret:my-db-password-AbCdEf"
    }
]

This will inject the secret as an environment variable named DB_PASSWORD.

Configuring Auto Scaling for Your Service

A major benefit of ECS is auto-scaling. You can scale your service based on metrics like CPU, memory, or ALB request count.

# 1. Register the service as a scalable target
aws application-autoscaling register-scalable-target \
    --service-namespace ecs \
    --scalable-dimension ecs:service:DesiredCount \
    --resource-id service/fargate-demo-cluster/fargate-demo-service \
    --min-capacity 2 \
    --max-capacity 10

# 2. Create a scaling policy (e.g., target 75% CPU utilization)
aws application-autoscaling put-scaling-policy \
    --service-namespace ecs \
    --scalable-dimension ecs:service:DesiredCount \
    --resource-id service/fargate-demo-cluster/fargate-demo-service \
    --policy-name "ecs-cpu-scaling-policy" \
    --policy-type TargetTrackingScaling \
    --target-tracking-scaling-policy-configuration '{"TargetValue":75.0,"PredefinedMetricSpecification":{"PredefinedMetricType":"ECSServiceAverageCPUUtilization"},"ScaleInCooldown":300,"ScaleOutCooldown":60}'

CI/CD Pipelines for Automated Deployments

Manually running these commands isn't sustainable. The next step is to automate this entire process in a CI/CD pipeline using tools like AWS CodePipeline, GitHub Actions, or Jenkins. A typical pipeline would:

  1. Build: Run docker build.
  2. Test: Run unit/integration tests.
  3. Push: Push the new image to ECR.
  4. Deploy: Create a new Task Definition revision and update the ECS Service to use it, triggering a rolling deployment.

Frequently Asked Questions

What is the difference between ECS and EKS?

ECS is Amazon's proprietary container orchestrator. It's simpler to set up and manage, especially with Fargate. EKS (Elastic Kubernetes Service) is Amazon's managed Kubernetes service. It offers the full power and portability of Kubernetes but comes with a steeper learning curve and more operational overhead (even with Fargate for EKS).

Is Fargate more expensive than EC2 launch type?

On paper, Fargate's per-vCPU/GB-hour rates are higher than an equivalent EC2 instance. However, with the EC2 model, you pay for the *entire instance* 24/7, even if it's only 30% utilized. With Fargate, you pay *only* for the resources your tasks request. For spiky or under-utilized workloads, Fargate is often cheaper and always more operationally efficient.

How do I monitor my Fargate application?

Your first stop is Amazon CloudWatch Logs, which we configured in the task definition. For metrics, ECS provides default CloudWatch metrics for service CPU and memory utilization. For deeper, application-level insights (APM), you can integrate tools like AWS X-Ray, Datadog, or New Relic.

Can I use a private ECR repository?

Yes. The ecs-task-execution-role we created grants Fargate permission to pull from your ECR repositories. If your task is in a private subnet, you'll also need to configure a VPC Endpoint for ECR (com.amazonaws.us-east-1.ecr.dkr) so it can pull the image without going over the public internet.

Conclusion

Congratulations! You have successfully mastered the end-to-end process to Deploy Dockerized App ECS Fargate. We've gone from a local Dockerfile to a secure, scalable, and publicly accessible web service running on serverless container infrastructure. We've covered networking with VPCs, image management with ECR, load balancing with ALB, and the core ECS components of Clusters, Task Definitions, and Services.

By leveraging Fargate, you've removed the undifferentiated heavy lifting of managing server clusters, allowing your team to focus on building features, not patching instances. This pattern is the foundation for building robust microservices on AWS, and you now have the practical skills and terminal-ready commands to do it yourself.

Thank you for reading the DevopsRoles page!

Build AWS CI/CD Pipeline: A Step-by-Step Guide with CodePipeline + GitHub

In today’s fast-paced software development landscape, automation isn’t a luxury; it’s a necessity. The ability to automatically build, test, and deploy applications allows development teams to release features faster, reduce human error, and improve overall product quality. This is the core promise of CI/CD (Continuous Integration and Continuous Delivery/Deployment). This guide will provide a comprehensive walkthrough on how to build a robust AWS CI/CD Pipeline using the powerful suite of AWS developer tools, seamlessly integrated with your GitHub repository.

We’ll go from a simple Node.js application on your local machine to a fully automated deployment onto an EC2 instance every time you push a change to your code. This practical, hands-on tutorial is designed for DevOps engineers, developers, and system administrators looking to master automation on the AWS cloud.

What is an AWS CI/CD Pipeline?

Before diving into the “how,” let’s clarify the “what.” A CI/CD pipeline is an automated workflow that developers use to reliably deliver new software versions. It’s a series of steps that code must pass through before it’s released to users.

  • Continuous Integration (CI): This is the practice of developers frequently merging their code changes into a central repository (like GitHub). After each merge, an automated build and test sequence is run. The goal is to detect integration bugs as quickly as possible.
  • Continuous Delivery/Deployment (CD): This practice extends CI. It automatically deploys all code changes that pass the CI stage to a testing and/or production environment. Continuous Delivery means the final deployment to production requires manual approval, while Continuous Deployment means it happens automatically.

An AWS CI/CD Pipeline leverages AWS-native services to implement this workflow, offering a managed, scalable, and secure way to automate your software delivery process.

Core Components of Our AWS CI/CD Pipeline

AWS provides a suite of services, often called the “CodeSuite,” that work together to create a powerful pipeline. For this tutorial, we will focus on the following key components:

AWS CodePipeline

Think of CodePipeline as the orchestrator or the “glue” for our entire pipeline. It models, visualizes, and automates the steps required to release your software. You define a series of stages (e.g., Source, Build, Deploy), and CodePipeline ensures that your code changes move through these stages automatically upon every commit.

GitHub (Source Control)

While AWS offers its own Git repository service (CodeCommit), using GitHub is incredibly common. CodePipeline integrates directly with GitHub, allowing it to automatically pull the latest source code whenever a change is pushed to a specific branch.

AWS CodeBuild

CodeBuild is a fully managed continuous integration service that compiles source code, runs tests, and produces software packages that are ready to deploy. You don’t need to provision or manage any build servers. You simply define the build commands in a buildspec.yml file, and CodeBuild executes them in a clean, containerized environment. It scales automatically to meet your build volume.

AWS CodeDeploy

CodeDeploy is a service that automates application deployments to a variety of compute services, including Amazon EC2 instances, on-premises servers, AWS Fargate, or AWS Lambda. It handles the complexity of updating your applications, helping to minimize downtime during deployment and providing a centralized way to manage and monitor the process.

Prerequisites for Building Your Pipeline

Before we start building, make sure you have the following ready:

  • An AWS Account with administrative privileges.
  • A GitHub Account where you can create a new repository.
  • Basic familiarity with the AWS Management Console and Git commands.
  • A simple application to deploy. We will provide one below.

Step-by-Step Guide: Building Your AWS CI/CD Pipeline

Let’s get our hands dirty and build the pipeline from the ground up. We will create a simple “Hello World” Node.js application and configure the entire AWS stack to deploy it.

Step 1: Preparing Your Application and GitHub Repository

First, create a new directory on your local machine, initialize a Git repository, and create the following files.

1. `package.json` – Defines project dependencies.

{
      "name": "aws-codepipeline-demo",
      "version": "1.0.0",
      "description": "Simple Node.js app for CodePipeline demo",
      "main": "index.js",
      "scripts": {
        "start": "node index.js"
      },
      "dependencies": {
        "express": "^4.18.2"
      },
      "author": "",
      "license": "ISC"
    }

2. `index.js` – Our simple Express web server.

const express = require('express');
    const app = express();
    const port = 3000;
    
    app.get('/', (req, res) => {
      res.send('

Hello World from our AWS CI/CD Pipeline! V1

'); }); app.listen(port, () => { console.log(`App listening at http://localhost:${port}`); });

3. `buildspec.yml` – Instructions for AWS CodeBuild.

This file tells CodeBuild how to build our project. It installs dependencies and prepares the output artifacts that CodeDeploy will use.

version: 0.2
    
    phases:
      install:
        runtime-versions:
          nodejs: 18
        commands:
          - echo Installing dependencies...
          - npm install
      build:
        commands:
          - echo Build started on `date`
          - echo Compiling the Node.js code...
          # No actual build step needed for this simple app
      post_build:
        commands:
          - echo Build completed on `date`
    artifacts:
      files:
        - '**/*'

4. `appspec.yml` – Instructions for AWS CodeDeploy.

This file tells CodeDeploy how to deploy the application on the EC2 instance. It specifies where the files should be copied and includes “hooks” to run scripts at different stages of the deployment lifecycle.

version: 0.0
    os: linux
    files:
      - source: /
        destination: /var/www/html/my-app
        overwrite: true
    hooks:
      BeforeInstall:
        - location: scripts/before_install.sh
          timeout: 300
          runas: root
      ApplicationStart:
        - location: scripts/application_start.sh
          timeout: 300
          runas: root
      ValidateService:
        - location: scripts/validate_service.sh
          timeout: 300
          runas: root

5. Deployment Scripts

Create a `scripts` directory and add the following files. These are referenced by `appspec.yml`.

`scripts/before_install.sh`

    #!/bin/bash
    # Install Node.js and PM2
    curl -fsSL https://deb.nodesource.com/setup_18.x | sudo -E bash -
    sudo apt-get install -y nodejs
    sudo npm install pm2 -g
    
    # Create deployment directory if it doesn't exist
    DEPLOY_DIR="/var/www/html/my-app"
    if [ ! -d "$DEPLOY_DIR" ]; then
      mkdir -p "$DEPLOY_DIR"
    fi

`scripts/application_start.sh`

    #!/bin/bash
    # Start the application
    cd /var/www/html/my-app
    pm2 stop index.js || true
    pm2 start index.js

`scripts/validate_service.sh`

    #!/bin/bash
    # Validate the service is running
    sleep 5 # Give the app a moment to start
    curl -f http://localhost:3000

Finally, make the scripts executable, commit all files, and push them to a new repository on your GitHub account.

Step 2: Setting Up the Deployment Environment (EC2 and IAM)

We need a server to deploy our application to. We’ll launch an EC2 instance and configure it with the necessary permissions and software.

1. Create an IAM Role for EC2:

  • Go to the IAM console and create a new role.
  • Select “AWS service” as the trusted entity type and “EC2” as the use case.
  • Attach the permission policy: AmazonEC2RoleforAWSCodeDeploy. This allows the CodeDeploy agent on the EC2 instance to communicate with the CodeDeploy service.
  • Give the role a name (e.g., EC2CodeDeployRole) and create it.

2. Launch an EC2 Instance:

  • Go to the EC2 console and launch a new instance.
  • Choose an AMI, like Ubuntu Server 22.04 LTS.
  • Choose an instance type, like t2.micro (Free Tier eligible).
  • In the “Advanced details” section, select the EC2CodeDeployRole you just created for the “IAM instance profile.”
  • Add a tag to the instance, e.g., Key: Name, Value: WebServer. We’ll use this tag to identify the instance in CodeDeploy.
  • Configure the security group to allow inbound traffic on port 22 (SSH) from your IP and port 3000 (HTTP) from anywhere (0.0.0.0/0) for our app.
  • In the “User data” field under “Advanced details”, paste the following script. This will install the CodeDeploy agent when the instance launches.
#!/bin/bash
    sudo apt-get update
    sudo apt-get install ruby-full wget -y
    cd /home/ubuntu
    wget https://aws-codedeploy-us-east-1.s3.us-east-1.amazonaws.com/latest/install
    chmod +x ./install
    sudo ./install auto
    sudo service codedeploy-agent start
    sudo service codedeploy-agent status

Launch the instance.

Step 3: Configuring AWS CodeDeploy

Now, we’ll set up CodeDeploy to manage deployments to our new EC2 instance.

1. Create a CodeDeploy Application:

  • Navigate to the CodeDeploy console.
  • Click “Create application.”
  • Give it a name (e.g., MyWebApp) and select EC2/On-premises as the compute platform.

2. Create a Deployment Group:

  • Inside your new application, click “Create deployment group.”
  • Enter a name (e.g., WebApp-Production).
  • Create a new service role for CodeDeploy or use an existing one. This role needs permissions to interact with AWS services like EC2. The console can create one for you with the required AWSCodeDeployRole policy.
  • For the environment configuration, choose “Amazon EC2 instances” and select the tag you used for your instance (Key: Name, Value: WebServer).
  • Ensure the deployment settings are configured to your liking (e.g., CodeDeployDefault.OneAtATime).
  • Disable the load balancer for this simple setup.
  • Create the deployment group.

Step 4: Creating the AWS CodePipeline

This is the final step where we connect everything together.

  • Navigate to the AWS CodePipeline console and click “Create pipeline.”
  • Stage 1: Pipeline settings – Give your pipeline a name (e.g., GitHub-to-EC2-Pipeline). Let AWS create a new service role.
  • Stage 2: Source stage – Select GitHub (Version 2) as the source provider. Click “Connect to GitHub” and authorize the connection. Select your repository and the branch (e.g., main). Leave the rest as default.
  • Stage 3: Build stage – Select AWS CodeBuild as the build provider. Select your region, and then click “Create project.” A new window will pop up.
    • Project name: e.g., WebApp-Builder.
    • Environment: Managed image, Amazon Linux 2, Standard runtime, and select a recent image version.
    • Role: Let it create a new service role.
    • Buildspec: Choose “Use a buildspec file”. This will use the buildspec.yml in your repository.
    • Click “Continue to CodePipeline.”
  • Stage 4: Deploy stage – Select AWS CodeDeploy as the deploy provider. Select the application name (MyWebApp) and deployment group (WebApp-Production) you created earlier.
  • Stage 5: Review – Review all the settings and click “Create pipeline.”

Triggering and Monitoring Your Pipeline

Once you create the pipeline, it will automatically trigger its first run, pulling the latest code from your GitHub repository. You can watch the progress as it moves from the “Source” stage to “Build” and finally “Deploy.”

If everything is configured correctly, all stages will turn green. You can then navigate to your EC2 instance’s public IP address in a web browser (e.g., http://YOUR_EC2_IP:3000) and see your “Hello World” message!

To test the automation, go back to your local `index.js` file, change the message to “Hello World! V2 is live!”, commit, and push the change to GitHub. Within a minute or two, you will see CodePipeline automatically detect the change, run the build, and deploy the new version. Refresh your browser, and you’ll see the updated message without any manual intervention.

Frequently Asked Questions (FAQs)

Can I deploy to other services besides EC2?
Absolutely. CodeDeploy and CodePipeline support deployments to Amazon ECS (for containers), AWS Lambda (for serverless functions), and even S3 for static websites. You would just configure the Deploy stage of your pipeline differently.
How do I manage sensitive information like database passwords?
You should never hardcode secrets in your repository. The best practice is to use AWS Secrets Manager or AWS Systems Manager Parameter Store. CodeBuild can be given IAM permissions to fetch these secrets securely during the build process and inject them as environment variables.
What is the cost associated with this setup?
AWS has a generous free tier. You get one active CodePipeline for free per month. CodeBuild offers 100 build minutes per month for free. Your primary cost will be the running EC2 instance, which is also covered by the free tier for the first 12 months (for a t2.micro instance).
How can I add a manual approval step?
In CodePipeline, you can add a new stage before your production deployment. In this stage, you can add an “Approval” action. The pipeline will pause at this point and wait for a user with the appropriate IAM permissions to manually approve or reject the change before it proceeds.

Conclusion

Congratulations! You have successfully built a fully functional, automated AWS CI/CD Pipeline. By integrating GitHub with CodePipeline, CodeBuild, and CodeDeploy, you’ve created a powerful workflow that dramatically improves the speed and reliability of your software delivery process. This setup forms the foundation of modern DevOps practices on the cloud. From here, you can expand the pipeline by adding automated testing stages, deploying to multiple environments (staging, production), and integrating more advanced monitoring and rollback capabilities. Mastering this core workflow is a critical skill for any cloud professional looking to leverage the full power of AWS. Thank you for reading the DevopsRoles page!

AWS Lambda & GitHub Actions: Function Deployment Guide

In modern cloud development, speed and reliability are paramount. Manually deploying serverless functions is a recipe for inconsistency and human error. This is where a robust CI/CD pipeline becomes essential. By integrating AWS Lambda GitHub Actions, you can create a seamless, automated workflow that builds, tests, and deploys your serverless code every time you push to your repository. This guide will walk you through every step of building a production-ready serverless deployment pipeline, transforming your development process from a manual chore into an automated, efficient system.

Why Automate Lambda Deployments with GitHub Actions?

Before diving into the technical details, let’s understand the value proposition. Automating your Lambda deployments isn’t just a “nice-to-have”; it’s a cornerstone of modern DevOps and Site Reliability Engineering (SRE) practices.

  • Consistency: Automation eliminates the “it worked on my machine” problem. Every deployment follows the exact same process, reducing environment-specific bugs.
  • Speed & Agility: Push a commit and watch it go live in minutes. This rapid feedback loop allows your team to iterate faster and deliver value to users more quickly.
  • Reduced Risk: Manual processes are prone to error. An automated pipeline can include testing and validation steps, catching bugs before they ever reach production.
  • Developer Focus: By abstracting away the complexities of deployment, developers can focus on what they do best: writing code. The CI/CD for Lambda becomes a transparent part of the development lifecycle.

Prerequisites for Integrating AWS Lambda GitHub Actions

To follow this guide, you’ll need a few things set up. Ensure you have the following before you begin:

  • An AWS Account: You’ll need an active AWS account with permissions to create IAM roles and Lambda functions.
  • A GitHub Account: Your code will be hosted on GitHub, and we’ll use GitHub Actions for our automation.
  • A Lambda Function: Have a simple Lambda function ready. We’ll provide an example below. If you’re new, you can create one in the AWS console to start.
  • Basic Git Knowledge: You should be comfortable with basic Git commands like git clone, git add, git commit, and git push.

Step-by-Step Guide to Automating Your AWS Lambda GitHub Actions Pipeline

Let’s build our automated deployment pipeline from the ground up. We will use the modern, secure approach of OpenID Connect (OIDC) to grant GitHub Actions access to AWS, avoiding the need for long-lived static access keys.

Step 1: Setting Up Your Lambda Function Code

First, let’s create a simple Node.js Lambda function. Create a new directory for your project and add the following files.

Directory Structure:

my-lambda-project/
├── .github/
│   └── workflows/
│       └── deploy.yml
├── index.js
└── package.json

index.js:

exports.handler = async (event) => {
    console.log("Event: ", event);
    const response = {
        statusCode: 200,
        body: JSON.stringify('Hello from Lambda deployed via GitHub Actions!'),
    };
    return response;
};

package.json:

{
  "name": "my-lambda-project",
  "version": "1.0.0",
  "description": "A simple Lambda function",
  "main": "index.js",
  "scripts": {
    "test": "echo \"Error: no test specified\" && exit 1"
  },
  "author": "",
  "license": "ISC",
  "dependencies": {}
}

Initialize a Git repository in this directory and push it to a new repository on GitHub.

Step 2: Configuring IAM Roles for Secure Access (OIDC)

This is the most critical step for security. We will configure an IAM OIDC identity provider that allows GitHub Actions to assume a role in your AWS account temporarily.

A. Create the OIDC Identity Provider in AWS IAM

  1. Navigate to the IAM service in your AWS Console.
  2. In the left pane, click on Identity providers and then Add provider.
  3. Select OpenID Connect.
  4. For the Provider URL, enter https://token.actions.githubusercontent.com.
  5. Click Get thumbprint to verify the server certificate.
  6. For the Audience, enter sts.amazonaws.com.
  7. Click Add provider.

B. Create the IAM Role for GitHub Actions

  1. In IAM, go to Roles and click Create role.
  2. For the trusted entity type, select Web identity.
  3. Choose the identity provider you just created (token.actions.githubusercontent.com).
  4. Select sts.amazonaws.com for the Audience.
  5. Optionally, you can restrict this role to a specific GitHub repository. Add a condition:
    • Token component: sub (subject)
    • Operator: String like
    • Value: repo:YOUR_GITHUB_USERNAME/YOUR_REPO_NAME:* (e.g., repo:my-org/my-lambda-project:*)
  6. Click Next.
  7. On the permissions page, create a new policy. Click Create policy, switch to the JSON editor, and paste the following. This policy grants the minimum required permissions to update a Lambda function’s code. Replace YOUR_FUNCTION_NAME and the AWS account details.
{
    "Version": "2012-10-17",
    "Statement": [
        {
            "Sid": "AllowLambdaCodeUpdate",
            "Effect": "Allow",
            "Action": "lambda:UpdateFunctionCode",
            "Resource": "arn:aws:lambda:us-east-1:123456789012:function:YOUR_FUNCTION_NAME"
        }
    ]
}
  1. Name the policy (e.g., GitHubActionsLambdaDeployPolicy) and attach it to your role.
  2. Finally, give your role a name (e.g., GitHubActionsLambdaDeployRole) and create it.
  3. Once created, copy the ARN of this role. You’ll need it in the next step.

Step 3: Storing AWS Credentials Securely in GitHub

We need to provide the Role ARN to our GitHub workflow. The best practice is to use GitHub’s encrypted secrets.

  1. Go to your repository on GitHub and click on Settings > Secrets and variables > Actions.
  2. Click New repository secret.
  3. Name the secret AWS_ROLE_TO_ASSUME.
  4. Paste the IAM Role ARN you copied in the previous step into the Value field.
  5. Click Add secret.

Step 4: Crafting the GitHub Actions Workflow File

Now, we’ll create the YAML file that defines our CI/CD pipeline. Create the file .github/workflows/deploy.yml in your project.

name: Deploy Lambda Function

# Trigger the workflow on pushes to the main branch
on:
  push:
    branches:
      - main

jobs:
  deploy:
    runs-on: ubuntu-latest
    
    # These permissions are needed to authenticate with AWS via OIDC
    permissions:
      id-token: write
      contents: read

    steps:
      - name: Checkout repository
        uses: actions/checkout@v4

      - name: Configure AWS Credentials
        uses: aws-actions/configure-aws-credentials@v4
        with:
          role-to-assume: ${{ secrets.AWS_ROLE_TO_ASSUME }}
          aws-region: us-east-1 # Change to your desired AWS region

      - name: Setup Node.js
        uses: actions/setup-node@v4
        with:
          node-version: '18'

      - name: Install dependencies
        run: npm install

      - name: Create ZIP deployment package
        run: zip -r deployment-package.zip . -x ".git/*" ".github/*"

      - name: Deploy to AWS Lambda
        run: |
          aws lambda update-function-code \
            --function-name YOUR_FUNCTION_NAME \
            --zip-file fileb://deployment-package.zip

Make sure to replace YOUR_FUNCTION_NAME with the actual name of your Lambda function in AWS and update the aws-region if necessary.

Deep Dive into the GitHub Actions Workflow

Let’s break down the key sections of our deploy.yml file to understand how this serverless deployment pipeline works.

Triggering the Workflow

The on key defines what events trigger the workflow. Here, we’ve configured it to run automatically whenever code is pushed to the main branch.

on:
  push:
    branches:
      - main

Configuring AWS Credentials

This is the heart of our secure connection. The aws-actions/configure-aws-credentials action is the official action from AWS for this purpose. It handles the OIDC handshake behind the scenes. It requests a JSON Web Token (JWT) from GitHub, presents it to AWS, and uses the role specified in our AWS_ROLE_TO_ASSUME secret to get temporary credentials. These credentials are then available to subsequent steps in the job.

- name: Configure AWS Credentials
  uses: aws-actions/configure-aws-credentials@v4
  with:
    role-to-assume: ${{ secrets.AWS_ROLE_TO_ASSUME }}
    aws-region: us-east-1

Building and Packaging the Lambda Function

AWS Lambda requires a ZIP file for deployment. These steps ensure our code and its dependencies are properly packaged.

  1. Install dependencies: The npm install command reads your package.json file and installs the required libraries into the node_modules directory.
  2. Create ZIP package: The zip command creates an archive named deployment-package.zip. We exclude the .git and .github directories as they are not needed by the Lambda runtime.
- name: Install dependencies
  run: npm install

- name: Create ZIP deployment package
  run: zip -r deployment-package.zip . -x ".git/*" ".github/*"

Deploying the Function to AWS Lambda

The final step uses the AWS Command Line Interface (CLI), which is pre-installed on GitHub’s runners. The aws lambda update-function-code command takes our newly created ZIP file and updates the code of the specified Lambda function.

- name: Deploy to AWS Lambda
  run: |
    aws lambda update-function-code \
      --function-name YOUR_FUNCTION_NAME \
      --zip-file fileb://deployment-package.zip

Commit and push this workflow file to your GitHub repository. The action will run automatically, and you should see your Lambda function’s code updated in the AWS console!

Best Practices and Advanced Techniques

Our current setup is great, but in a real-world scenario, you’ll want more sophistication.

  • Managing Environments: Use different branches (e.g., develop, staging, main) to deploy to different AWS accounts or environments. You can create separate workflows or use conditional logic within a single workflow based on the branch name (if: github.ref == 'refs/heads/main').
  • Testing: Add a dedicated step in your workflow to run unit or integration tests before deploying. If the tests fail, the workflow stops, preventing a bad deployment.
    - name: Run unit tests
    run: npm test

  • Frameworks: For complex applications, consider using a serverless framework like AWS SAM or the Serverless Framework. They simplify resource definition (IAM roles, API Gateways, etc.) and have better deployment tooling that can be easily integrated into GitHub Actions.

Frequently Asked Questions

Q: Is using GitHub Actions for AWS deployments free?
A: GitHub provides a generous free tier for public repositories and a significant number of free minutes per month for private repositories. For most small to medium-sized projects, this is more than enough. Heavy usage might require a paid plan.

Q: Why use OIDC instead of storing AWS access keys in GitHub Secrets?
A: Security. Long-lived access keys are a major security risk. If compromised, they provide permanent access to your AWS account. OIDC uses short-lived tokens that are automatically generated for each workflow run, significantly reducing the attack surface. It’s the modern best practice.

Q: Can I use this workflow to deploy other AWS services?
A: Absolutely! The core concept of authenticating with aws-actions/configure-aws-credentials is universal. You just need to change the final `run` steps to use the appropriate AWS CLI commands for other services like S3, ECS, or CloudFormation.

Conclusion

You have successfully built a robust, secure, and automated CI/CD pipeline. By leveraging the power of an AWS Lambda GitHub Actions integration, you’ve removed manual steps, increased deployment velocity, and improved the overall stability of your serverless application. This foundation allows you to add more complex steps like automated testing, multi-environment deployments, and security scanning, enabling your team to build and innovate with confidence. Adopting this workflow is a significant step toward maturing your DevOps practices for serverless development. Thank you for reading the DevopsRoles page!

Kubernetes Security Diagram: Cheatsheet for Developers

Kubernetes has revolutionized how we deploy and manage applications, but its power and flexibility come with significant complexity, especially regarding security. For developers and DevOps engineers, navigating the myriad of security controls can be daunting. This is where a Kubernetes Security Diagram becomes an invaluable tool. It provides a mental model and a visual cheatsheet to understand the layered nature of K8s security, helping you build more resilient and secure applications from the ground up. This article will break down the components of a comprehensive security diagram, focusing on practical steps you can take at every layer.

Why a Kubernetes Security Diagram is Essential

A secure system is built in layers, like an onion. A failure in one layer should be contained by the next. Kubernetes is no different. Its architecture is inherently distributed and multi-layered, spanning from the physical infrastructure to the application code running inside a container. A diagram helps to:

  • Visualize Attack Surfaces: It allows teams to visually map potential vulnerabilities at each layer of the stack.
  • Clarify Responsibilities: In a cloud environment, the shared responsibility model can be confusing. A diagram helps delineate where the cloud provider’s responsibility ends and yours begins.
  • Enable Threat Modeling: By understanding how components interact, you can more effectively brainstorm potential threats and design appropriate mitigations.
  • Improve Communication: It serves as a common language for developers, operations, and security teams to discuss and improve the overall K8s security posture.

The most effective way to structure this diagram is by following the “4Cs of Cloud Native Security” model: Cloud, Cluster, Container, and Code. Let’s break down each layer.

Deconstructing the Kubernetes Security Diagram: The 4Cs

Imagine your Kubernetes environment as a set of concentric circles. The outermost layer is the Cloud (or your corporate data center), and the innermost is your application Code. Securing the system means applying controls at each of these boundaries.

Layer 1: Cloud / Corporate Data Center Security

This is the foundation upon which everything else is built. If your underlying infrastructure is compromised, no amount of cluster-level security can save you. Security at this layer involves hardening the environment where your Kubernetes nodes run.

Key Controls:

  • Network Security: Isolate your cluster’s network using Virtual Private Clouds (VPCs), subnets, and firewalls (Security Groups in AWS, Firewall Rules in GCP). Restrict all ingress and egress traffic to only what is absolutely necessary.
  • IAM and Access Control: Apply the principle of least privilege to the cloud provider’s Identity and Access Management (IAM). Users and service accounts that interact with the cluster infrastructure (e.g., creating nodes, modifying load balancers) should have the minimum required permissions.
  • Infrastructure Hardening: Ensure the virtual machines or bare-metal servers acting as your nodes are secure. This includes using hardened OS images, managing SSH key access tightly, and ensuring physical security if you’re in a private data center.
  • Provider-Specific Best Practices: Leverage security services offered by your cloud provider. For example, use AWS’s Key Management Service (KMS) for encrypting EBS volumes used by your nodes. Following frameworks like the AWS Well-Architected Framework is crucial.

Layer 2: Cluster Security

This layer focuses on securing the Kubernetes components themselves. It’s about protecting both the control plane (the “brains”) and the worker nodes (the “muscle”).

Control Plane Security

  • API Server: This is the gateway to your cluster. Secure it by enabling strong authentication (e.g., client certificates, OIDC) and authorization (RBAC). Disable anonymous access and limit access to trusted networks.
  • etcd Security: The `etcd` datastore holds the entire state of your cluster, including secrets. It must be protected. Encrypt `etcd` data at rest, enforce TLS for all client communication, and strictly limit access to only the API server.
  • Kubelet Security: The Kubelet is the agent running on each worker node. Use flags like --anonymous-auth=false and --authorization-mode=Webhook to prevent unauthorized requests.

Worker Node & Network Security

  • Node Hardening: Run CIS (Center for Internet Security) benchmarks against your worker nodes to identify and remediate security misconfigurations.
  • Network Policies: By default, all pods in a cluster can communicate with each other. This is a security risk. Use NetworkPolicy resources to implement network segmentation and restrict pod-to-pod communication based on labels.

Here’s an example of a NetworkPolicy that only allows ingress traffic from pods with the label app: frontend to pods with the label app: backend on port 8080.

apiVersion: networking.k8s.io/v1
kind: NetworkPolicy
metadata:
  name: backend-allow-frontend
  namespace: default
spec:
  podSelector:
    matchLabels:
      app: backend
  policyTypes:
  - Ingress
  ingress:
  - from:
    - podSelector:
        matchLabels:
          app: frontend
    ports:
    - protocol: TCP
      port: 8080

Layer 3: Container Security

This layer is all about securing the individual workloads running in your cluster. Security must be addressed both at build time (the container image) and at run time (the running container).

Image Security (Build Time)

  • Use Minimal Base Images: Start with the smallest possible base image (e.g., Alpine, or “distroless” images from Google). Fewer packages mean a smaller attack surface.
  • Vulnerability Scanning: Integrate image scanners (like Trivy, Clair, or Snyk) into your CI/CD pipeline to detect and block images with known vulnerabilities before they are ever pushed to a registry.
  • Don’t Run as Root: Define a non-root user in your Dockerfile and use the USER instruction.

Runtime Security

  • Security Contexts: Use Kubernetes SecurityContext to define privilege and access control settings for a Pod or Container. This is your most powerful tool for hardening workloads at runtime.
  • Pod Security Admission (PSA): The successor to Pod Security Policies, PSA enforces security standards (like Privileged, Baseline, Restricted) at the namespace level, preventing insecure pods from being created.
  • Runtime Threat Detection: Deploy tools like Falco or other commercial solutions to monitor container behavior in real-time and detect suspicious activity (e.g., a shell spawning in a container, unexpected network connections).

This manifest shows a pod with a restrictive securityContext, ensuring it runs as a non-root user with a read-only filesystem.

apiVersion: v1
kind: Pod
metadata:
  name: secure-pod-example
spec:
  containers:
  - name: nginx
    image: nginx:1.21
    securityContext:
      runAsNonRoot: true
      runAsUser: 1001
      allowPrivilegeEscalation: false
      readOnlyRootFilesystem: true
      capabilities:
        drop:
        - "ALL"
  # You need a writable volume for temporary files
  volumes:
  - name: tmp
    emptyDir: {}

Layer 4: Code Security

The final layer is the application code itself. A secure infrastructure can still be compromised by a vulnerable application.

Key Controls:

  • Secret Management: Never hardcode secrets (API keys, passwords, certificates) in your container images or manifests. Use Kubernetes Secrets, or for more robust security, integrate an external secrets manager like HashiCorp Vault or AWS Secrets Manager.
  • Role-Based Access Control (RBAC): If your application needs to talk to the Kubernetes API, grant it the bare minimum permissions required using a dedicated ServiceAccount, Role, and RoleBinding.
  • Service Mesh: For complex microservices architectures, consider using a service mesh like Istio or Linkerd. A service mesh can enforce mutual TLS (mTLS) for all service-to-service communication, provide fine-grained traffic control policies, and improve observability.

Here is an example of an RBAC Role that only allows a ServiceAccount to get and list pods in the default namespace.

apiVersion: rbac.authorization.k8s.io/v1
kind: Role
metadata:
  namespace: default
  name: pod-reader
rules:
- apiGroups: [""] # "" indicates the core API group
  resources: ["pods"]
  verbs: ["get", "list", "watch"]
---
apiVersion: rbac.authorization.k8s.io/v1
kind: RoleBinding
metadata:
  name: read-pods
  namespace: default
subjects:
- kind: ServiceAccount
  name: my-app-sa # The ServiceAccount used by your application
  apiGroup: ""
roleRef:
  kind: Role
  name: pod-reader
  apiGroup: rbac.authorization.k8s.io

Frequently Asked Questions

What is the most critical layer in Kubernetes security?

Every layer is critical. A defense-in-depth strategy is essential. However, the Cloud/Infrastructure layer is the foundation. A compromise at this level can undermine all other security controls you have in place.

How do Network Policies improve Kubernetes security?

They enforce network segmentation at Layer 3/4 (IP/port). By default, Kubernetes has a flat network where any pod can talk to any other pod. Network Policies act as a firewall for your pods, ensuring that workloads can only communicate with the specific services they are authorized to, drastically reducing the “blast radius” of a potential compromise.

What is the difference between Pod Security Admission (PSA) and Security Context?

SecurityContext is a setting within a Pod’s manifest that defines the security parameters for that specific workload (e.g., runAsNonRoot). Pod Security Admission (PSA) is a cluster-level admission controller that enforces security standards across namespaces. PSA acts as a gatekeeper, preventing pods that don’t meet a certain security standard (e.g., those requesting privileged access) from even being created in the first place.

Conclusion

Securing Kubernetes is not a one-time task but an ongoing process that requires vigilance at every layer of the stack. Thinking in terms of a layered defense model, as visualized by a Kubernetes Security Diagram based on the 4Cs, provides a powerful framework for developers and operators. It helps transform a complex ecosystem into a manageable set of security domains. By systematically applying controls at the Cloud, Cluster, Container, and Code layers, you can build a robust K8s security posture and confidently deploy your applications in production. Thank you for reading the DevopsRoles page!

Deploy AWS Lambda with Terraform: A Comprehensive Guide

In the world of cloud computing, serverless architectures and Infrastructure as Code (IaC) are two paradigms that have revolutionized how we build and manage applications. AWS Lambda, a leading serverless compute service, allows you to run code without provisioning servers. Terraform, an open-source IaC tool, enables you to define and manage infrastructure with code. Combining them is a match made in DevOps heaven. This guide provides a deep dive into deploying, managing, and automating your serverless functions with AWS Lambda Terraform, transforming your workflow from manual clicks to automated, version-controlled deployments.

Why Use Terraform for AWS Lambda Deployments?

While you can easily create a Lambda function through the AWS Management Console, this approach doesn’t scale and is prone to human error. Using Terraform to manage your Lambda functions provides several key advantages:

  • Repeatability and Consistency: Define your Lambda function, its permissions, triggers, and environment variables in code. This ensures you can deploy the exact same configuration across different environments (dev, staging, prod) with a single command.
  • Version Control: Store your infrastructure configuration in a Git repository. This gives you a full history of changes, the ability to review updates through pull requests, and the power to roll back to a previous state if something goes wrong.
  • Automation: Integrate your Terraform code into CI/CD pipelines to fully automate the deployment process. A `git push` can trigger a pipeline that plans, tests, and applies your infrastructure changes seamlessly.
  • Full Ecosystem Management: Lambda functions rarely exist in isolation. They need IAM roles, API Gateway triggers, S3 bucket events, or DynamoDB streams. Terraform allows you to define and manage this entire ecosystem of related resources in a single, cohesive configuration.

Prerequisites

Before we start writing code, make sure you have the following tools installed and configured on your system:

  • AWS Account: An active AWS account with permissions to create IAM roles and Lambda functions.
  • AWS CLI: The AWS Command Line Interface installed and configured with your credentials (e.g., via `aws configure`).
  • Terraform: The Terraform CLI (version 1.0 or later) installed.
  • A Code Editor: A text editor or IDE like Visual Studio Code.
  • Python 3: We’ll use Python for our example Lambda function, so ensure you have a recent version installed.

Core Components of an AWS Lambda Terraform Deployment

A typical serverless deployment involves more than just the function code. With Terraform, we define each piece as a resource. Let’s break down the essential components.

1. The Lambda Function Code (Python Example)

This is the actual application logic you want to run. For this guide, we’ll use a simple “Hello World” function in Python.

# src/lambda_function.py
import json

def lambda_handler(event, context):
    print("Lambda function invoked!")
    return {
        'statusCode': 200,
        'body': json.dumps('Hello from Lambda deployed by Terraform!')
    }

2. The Deployment Package (.zip)

AWS Lambda requires your code and its dependencies to be uploaded as a deployment package, typically a `.zip` file. Instead of creating this file manually, we can use Terraform’s built-in `archive_file` data source to do it automatically during the deployment process.

# main.tf
data "archive_file" "lambda_zip" {
  type        = "zip"
  source_dir  = "${path.module}/src"
  output_path = "${path.module}/dist/lambda_function.zip"
}

3. The IAM Role and Policy

Every Lambda function needs an execution role. This is an IAM role that grants the function permission to interact with other AWS services. At a minimum, it needs permission to write logs to Amazon CloudWatch. We define the role and attach a policy to it.

# main.tf

# IAM role that the Lambda function will assume
resource "aws_iam_role" "lambda_exec_role" {
  name = "lambda_basic_execution_role"

  assume_role_policy = jsonencode({
    Version   = "2012-10-17",
    Statement = [
      {
        Action    = "sts:AssumeRole",
        Effect    = "Allow",
        Principal = {
          Service = "lambda.amazonaws.com"
        }
      }
    ]
  })
}

# Attaching the basic execution policy to the role
resource "aws_iam_role_policy_attachment" "lambda_policy_attachment" {
  role       = aws_iam_role.lambda_exec_role.name
  policy_arn = "arn:aws:iam::aws:policy/service-role/AWSLambdaBasicExecutionRole"
}

The `assume_role_policy` document specifies that the AWS Lambda service is allowed to “assume” this role. We then attach the AWS-managed `AWSLambdaBasicExecutionRole` policy, which provides the necessary CloudWatch Logs permissions. For more details, refer to the official documentation on AWS Lambda Execution Roles.

4. The Lambda Function Resource (`aws_lambda_function`)

This is the central resource that ties everything together. It defines the Lambda function itself, referencing the IAM role and the deployment package.

# main.tf
resource "aws_lambda_function" "hello_world_lambda" {
  function_name = "HelloWorldLambdaTerraform"
  
  # Reference to the zipped deployment package
  filename         = data.archive_file.lambda_zip.output_path
  source_code_hash = data.archive_file.lambda_zip.output_base64sha256

  # Reference to the IAM role
  role = aws_iam_role.lambda_exec_role.arn
  
  # Function configuration
  handler = "lambda_function.lambda_handler" # filename.handler_function_name
  runtime = "python3.9"
}

Notice the `source_code_hash` argument. This is crucial. It tells Terraform to trigger a new deployment of the function only when the content of the `.zip` file changes.

Step-by-Step Guide: Your First AWS Lambda Terraform Project

Let’s put all the pieces together into a working project.

Step 1: Project Structure

Create a directory for your project with the following structure:

my-lambda-project/
├── main.tf
└── src/
    └── lambda_function.py

Step 2: Writing the Lambda Handler

Place the simple Python “Hello World” code into `src/lambda_function.py` as shown in the previous section.

Step 3: Defining the Full Terraform Configuration

Combine all the Terraform snippets into your `main.tf` file. This single file will define our entire infrastructure.

# main.tf

# Configure the AWS provider
provider "aws" {
  region = "us-east-1" # Change to your preferred region
}

# 1. Create a zip archive of our Python code
data "archive_file" "lambda_zip" {
  type        = "zip"
  source_dir  = "${path.module}/src"
  output_path = "${path.module}/dist/lambda_function.zip"
}

# 2. Create the IAM role for the Lambda function
resource "aws_iam_role" "lambda_exec_role" {
  name = "lambda_basic_execution_role"

  assume_role_policy = jsonencode({
    Version   = "2012-10-17",
    Statement = [
      {
        Action    = "sts:AssumeRole",
        Effect    = "Allow",
        Principal = {
          Service = "lambda.amazonaws.com"
        }
      }
    ]
  })
}

# 3. Attach the basic execution policy to the role
resource "aws_iam_role_policy_attachment" "lambda_policy_attachment" {
  role       = aws_iam_role.lambda_exec_role.name
  policy_arn = "arn:aws:iam::aws:policy/service-role/AWSLambdaBasicExecutionRole"
}

# 4. Create the Lambda function resource
resource "aws_lambda_function" "hello_world_lambda" {
  function_name = "HelloWorldLambdaTerraform"
  
  filename         = data.archive_file.lambda_zip.output_path
  source_code_hash = data.archive_file.lambda_zip.output_base64sha256

  role    = aws_iam_role.lambda_exec_role.arn
  handler = "lambda_function.lambda_handler"
  runtime = "python3.9"

  # Ensure the IAM role is created before the Lambda function
  depends_on = [
    aws_iam_role_policy_attachment.lambda_policy_attachment,
  ]

  tags = {
    ManagedBy = "Terraform"
  }
}

# 5. Output the Lambda function name
output "lambda_function_name" {
  value = aws_lambda_function.hello_world_lambda.function_name
}

Step 4: Deploying the Infrastructure

Now, open your terminal in the `my-lambda-project` directory and run the standard Terraform workflow commands:

  1. Initialize Terraform: This downloads the necessary AWS provider plugin.
    terraform init

  2. Plan the deployment: This shows you what resources Terraform will create. It’s a dry run.
    terraform plan

  3. Apply the changes: This command actually creates the resources in your AWS account.
    terraform apply

Terraform will prompt you to confirm the action. Type `yes` and hit Enter. After a minute, your IAM role and Lambda function will be deployed!

Step 5: Invoking and Verifying the Lambda Function

You can invoke your newly deployed function directly from the AWS CLI:

aws lambda invoke \
--function-name HelloWorldLambdaTerraform \
--region us-east-1 \
output.json

This command calls the function and saves the response to `output.json`. If you inspect the file (`cat output.json`), you should see:

{"statusCode": 200, "body": "\"Hello from Lambda deployed by Terraform!\""}

Success! You’ve just automated a serverless deployment.

Advanced Concepts and Best Practices

Let’s explore some more advanced topics to make your AWS Lambda Terraform deployments more robust and feature-rich.

Managing Environment Variables

You can securely pass configuration to your Lambda function using environment variables. Simply add an `environment` block to your `aws_lambda_function` resource.

resource "aws_lambda_function" "hello_world_lambda" {
  # ... other arguments ...

  environment {
    variables = {
      LOG_LEVEL = "INFO"
      API_URL   = "https://api.example.com"
    }
  }
}

Triggering Lambda with API Gateway

A common use case is to trigger a Lambda function via an HTTP request. Terraform can manage the entire API Gateway setup for you. Here’s a minimal example of creating an HTTP endpoint that invokes our function.

# Create the API Gateway
resource "aws_apigatewayv2_api" "lambda_api" {
  name          = "lambda-gw-api"
  protocol_type = "HTTP"
}

# Create the integration between API Gateway and Lambda
resource "aws_apigatewayv2_integration" "lambda_integration" {
  api_id           = aws_apigatewayv2_api.lambda_api.id
  integration_type = "AWS_PROXY"
  integration_uri  = aws_lambda_function.hello_world_lambda.invoke_arn
}

# Define the route (e.g., GET /hello)
resource "aws_apigatewayv2_route" "api_route" {
  api_id    = aws_apigatewayv2_api.lambda_api.id
  route_key = "GET /hello"
  target    = "integrations/${aws_apigatewayv2_integration.lambda_integration.id}"
}

# Grant API Gateway permission to invoke the Lambda
resource "aws_lambda_permission" "api_gw_permission" {
  statement_id  = "AllowAPIGatewayInvoke"
  action        = "lambda:InvokeFunction"
  function_name = aws_lambda_function.hello_world_lambda.function_name
  principal     = "apigateway.amazonaws.com"
  source_arn    = "${aws_apigatewayv2_api.lambda_api.execution_arn}/*/*"
}

output "api_endpoint" {
  value = aws_apigatewayv2_api.lambda_api.api_endpoint
}

Frequently Asked Questions

How do I handle function updates with Terraform?
Simply change your Python code in the `src` directory. The next time you run `terraform plan` and `terraform apply`, the `archive_file` data source will compute a new `source_code_hash`, and Terraform will automatically upload the new version of your code.

What’s the best way to manage secrets for my Lambda function?
Avoid hardcoding secrets in Terraform files or environment variables. The best practice is to use AWS Secrets Manager or AWS Systems Manager Parameter Store. You can grant your Lambda’s execution role permission to read from these services and fetch secrets dynamically at runtime.

Can I use Terraform to manage multiple Lambda functions in one project?
Absolutely. You can define multiple `aws_lambda_function` resources. For better organization, consider using Terraform modules to create reusable templates for your Lambda functions, each with its own code, IAM role, and configuration.

How does the `source_code_hash` argument work?
It’s a base64-encoded SHA256 hash of the content of your deployment package. Terraform compares the hash in your state file with the newly computed hash from the `archive_file` data source. If they differ, Terraform knows the code has changed and initiates an update to the Lambda function. For more details, consult the official Terraform documentation.

Conclusion

You have successfully configured, deployed, and invoked a serverless function using an Infrastructure as Code approach. By leveraging Terraform, you’ve created a process that is automated, repeatable, and version-controlled. This foundation is key to building complex, scalable, and maintainable serverless applications on AWS. Adopting an AWS Lambda Terraform workflow empowers your team to move faster and with greater confidence, eliminating manual configuration errors and providing a clear, auditable history of your infrastructure’s evolution. Thank you for reading the DevopsRoles page!

Debian 13 Linux: Major Updates for Linux Users in Trixie

The open-source community is eagerly anticipating the next major release from one of its most foundational projects. Codenamed ‘Trixie’, the upcoming Debian 13 Linux is set to be a landmark update, and this guide will explore the key features that make this release essential for all users.

‘Trixie’ promises a wealth of improvements, from critical security enhancements to a more polished user experience. It will feature a modern kernel, an updated software toolchain, and refreshed desktop environments, ensuring a more powerful and efficient system from the ground up.

For the professionals who depend on Debian’s legendary stability—including system administrators, DevOps engineers, and developers—understanding these changes is crucial. We will unpack what makes this a release worth watching and preparing for.

The Road to Debian 13 “Trixie”: Release Cycle and Expectations

Before diving into the new features, it’s helpful to understand where ‘Trixie’ fits within Debian’s methodical release process. This process is the very reason for its reputation as a rock-solid distribution.

Understanding the Debian Release Cycle

Debian’s development is split into three main branches:

  • Stable: This is the official release, currently Debian 12 ‘Bookworm’. It receives long-term security support and is recommended for production environments.
  • Testing: This branch contains packages that are being prepared for the next stable release. Right now, ‘Trixie’ is the testing distribution.
  • Unstable (Sid): This is the development branch where new packages are introduced and initial testing occurs.

Packages migrate from Unstable to Testing after meeting certain criteria, such as a lack of release-critical bugs. Eventually, the Testing branch is “frozen,” signaling the final phase of development before it becomes the new Stable release.

Projected Release Date for Debian 13 Linux

The Debian Project doesn’t operate on a fixed release schedule, but it has consistently followed a two-year cycle for major releases. Debian 12 ‘Bookworm’ was released in June 2023. Following this pattern, we can expect Debian 13 ‘Trixie’ to be released in mid-2025. The development freeze will likely begin in early 2025, giving developers and users a clear picture of the final feature set.

What’s New? Core System and Kernel Updates in Debian 13 Linux

The core of any Linux distribution is its kernel and system libraries. ‘Trixie’ will bring significant updates in this area, enhancing performance, hardware support, and security.

The Heart of Trixie: A Modern Linux Kernel

Debian 13 is expected to ship with a much newer Linux Kernel, likely version 6.8 or newer. This is a massive leap forward, bringing a host of improvements:

  • Expanded Hardware Support: Better support for the latest Intel and AMD CPUs, new GPUs (including Intel Battlemage and AMD RDNA 3), and emerging technologies like Wi-Fi 7.
  • Performance Enhancements: The new kernel includes numerous optimizations to the scheduler, I/O handling, and networking stack, resulting in a more responsive and efficient system.
  • Filesystem Improvements: Significant updates for filesystems like Btrfs and EXT4, including performance boosts and new features.
  • Enhanced Security: Newer kernels incorporate the latest security mitigations for hardware vulnerabilities and provide more robust security features.

Toolchain and Core Utilities Upgrade

The core toolchain—the set of programming tools used to create the operating system itself—is receiving a major refresh. We anticipate updated versions of:

  • GCC (GNU Compiler Collection): Likely version 13 or 14, offering better C++20/23 standard support, improved diagnostics, and better code optimization.
  • Glibc (GNU C Library): A newer version will provide critical bug fixes, performance improvements, and support for new kernel features.
  • Binutils: Updated versions of tools like the linker (ld) and assembler (as) are essential for building modern software.

These updates are vital for developers who need to build and run software on a modern, secure, and performant platform.

A Refreshed Desktop Experience: DE Updates

Debian isn’t just for servers; it’s also a powerful desktop operating system. ‘Trixie’ will feature the latest versions of all major desktop environments, offering a more polished and feature-rich user experience.

GNOME 47/48: A Modernized Interface

Debian’s default desktop, GNOME, will likely be updated to version 47 or 48. Users can expect continued refinement of the user interface, improved Wayland support, better performance, and enhancements to core apps like Nautilus (Files) and the GNOME Software center. The focus will be on usability, accessibility, and a clean, modern aesthetic.

KDE Plasma 6: The Wayland-First Future

One of the most exciting updates will be the inclusion of KDE Plasma 6. This is a major milestone for the KDE project, built on the new Qt 6 framework. Key highlights include:

  • Wayland by Default: Plasma 6 defaults to the Wayland display protocol, offering smoother graphics, better security, and superior handling of modern display features like fractional scaling.
  • Visual Refresh: A cleaner, more modern look and feel with updated themes and components.
  • Core App Rewrite: Many core KDE applications have been ported to Qt 6, improving performance and maintainability.

Updates for XFCE, MATE, and Other Environments

Users of other desktop environments won’t be left out. Debian 13 will include the latest stable versions of XFCE, MATE, Cinnamon, and LXQt, all benefiting from their respective upstream improvements, bug fixes, and feature additions.

For Developers and SysAdmins: Key Package Upgrades

Debian 13 will be an excellent platform for development and system administration, thanks to updated versions of critical software packages.

Programming Languages and Runtimes

Expect the latest stable versions of major programming languages, including:

  • Python 3.12+
  • PHP 8.3+
  • Ruby 3.2+
  • Node.js 20+ (LTS) or newer
  • Perl 5.38+

Server Software and Databases

Server administrators will appreciate updated versions of essential software:

  • Apache 2.4.x
  • Nginx 1.24.x+
  • PostgreSQL 16+
  • MariaDB 10.11+

These updates bring not just new features but also crucial security patches and performance optimizations, ensuring that servers running Debian remain secure and efficient. Maintaining up-to-date systems is a core principle recommended by authorities like the Cybersecurity and Infrastructure Security Agency (CISA).

How to Prepare for the Upgrade to Debian 13

While the final release is still some time away, it’s never too early to plan. A smooth upgrade from Debian 12 to Debian 13 requires careful preparation.

Best Practices for a Smooth Transition

  1. Backup Everything: Before attempting any major upgrade, perform a full backup of your system and critical data. Tools like rsync or dedicated backup solutions are your best friend.
  2. Update Your Current System: Ensure your Debian 12 system is fully up-to-date. Run sudo apt update && sudo apt full-upgrade and resolve any pending issues.
  3. Read the Release Notes: Once they are published, read the official Debian 13 release notes thoroughly. They will contain critical information about potential issues and configuration changes.

A Step-by-Step Upgrade Command Sequence

When the time comes, the upgrade process involves changing your APT sources and running the upgrade commands. First, edit your /etc/apt/sources.list file and any files in /etc/apt/sources.list.d/, changing every instance of bookworm (Debian 12) to trixie (Debian 13).

After modifying your sources, execute the following commands in order:

# Step 1: Update the package lists with the new 'trixie' sources
sudo apt update

# Step 2: Perform a minimal system upgrade first
# This upgrades packages that can be updated without removing or installing others
sudo apt upgrade --without-new-pkgs

# Step 3: Perform the full system upgrade to Debian 13
# This will handle changing dependencies, installing new packages, and removing obsolete ones
sudo apt full-upgrade

# Step 4: Clean up obsolete packages
sudo apt autoremove

# Step 5: Reboot into your new Debian 13 system
sudo reboot

Frequently Asked Questions

When will Debian 13 “Trixie” be released?

Based on Debian’s typical two-year release cycle, the stable release of Debian 13 is expected in mid-2025.

What Linux kernel version will Debian 13 use?

It is expected to ship with a modern kernel, likely version 6.8 or a newer long-term support (LTS) version available at the time of the freeze.

Is it safe to upgrade from Debian 12 to Debian 13 right after release?

For production systems, it is often wise to wait a few weeks or for the first point release (e.g., 13.1) to allow any early bugs to be ironed out. For non-critical systems, upgrading shortly after release is generally safe if you follow the official instructions.

Will Debian 13 still support 32-bit (i386) systems?

This is a topic of ongoing discussion. While support for the 32-bit PC (i386) architecture may be dropped, a final decision will be confirmed closer to the release. For the most current information, consult the official Debian website.

What is the codename “Trixie” from?

Debian release codenames are traditionally taken from characters in the Disney/Pixar “Toy Story” movies. Trixie is the blue triceratops toy.

Conclusion

Debian 13 ‘Trixie’ is poised to be another outstanding release, reinforcing Debian’s commitment to providing a free, stable, and powerful operating system. With a modern Linux kernel, refreshed desktop environments like KDE Plasma 6, and updated versions of thousands of software packages, it offers compelling reasons to upgrade for both desktop users and system administrators. The focus on improved hardware support, performance, and security ensures that the Debian 13 Linux distribution will continue to be a top-tier choice for servers, workstations, and embedded systems for years to come. As the development cycle progresses, we can look forward to a polished and reliable OS that continues to power a significant portion of the digital world. Thank you for reading the DevopsRoles page!

Deploy DeepSeek-R1 on Kubernetes: A Comprehensive MLOps Guide

The era of Large Language Models (LLMs) is transforming industries, but moving these powerful models from research to production presents significant operational challenges. DeepSeek-R1, a cutting-edge model renowned for its reasoning and coding capabilities, is a prime example. While incredibly powerful, its size and computational demands require a robust, scalable, and resilient infrastructure. This is where orchestrating a DeepSeek-R1 Kubernetes deployment becomes not just an option, but a strategic necessity for any serious MLOps team. This guide will walk you through the entire process, from setting up your GPU-enabled cluster to serving inference requests at scale.

Why Kubernetes for LLM Deployment?

Deploying a massive model like DeepSeek-R1 on a single virtual machine is fraught with peril. It lacks scalability, fault tolerance, and efficient resource utilization. Kubernetes, the de facto standard for container orchestration, directly addresses these challenges, making it the ideal platform for production-grade LLM inference.

  • Scalability: Kubernetes allows you to scale your model inference endpoints horizontally by simply increasing the replica count of your pods. With tools like the Horizontal Pod Autoscaler (HPA), this process can be automated based on metrics like GPU utilization or request latency.
  • High Availability: By distributing pods across multiple nodes, Kubernetes ensures that your model remains available even if a node fails. Its self-healing capabilities will automatically reschedule failed pods, providing a resilient service.
  • Resource Management: Kubernetes provides fine-grained control over resource allocation. You can explicitly request specific resources, like NVIDIA GPUs, ensuring your LLM workloads get the dedicated hardware they need to perform optimally.
  • Ecosystem and Portability: The vast Cloud Native Computing Foundation (CNCF) ecosystem provides tools for every aspect of the deployment lifecycle, from monitoring (Prometheus) and logging (Fluentd) to service mesh (Istio). This creates a standardized, cloud-agnostic environment for your MLOps workflows.

Prerequisites for Deploying DeepSeek-R1 on Kubernetes

Before you can deploy the model, you need to prepare your Kubernetes cluster. This setup is critical for handling the demanding nature of GPU workloads on Kubernetes.

1. A Running Kubernetes Cluster

You need access to a Kubernetes cluster. This can be a managed service from a cloud provider like Google Kubernetes Engine (GKE), Amazon Elastic Kubernetes Service (EKS), or Azure Kubernetes Service (AKS). Alternatively, you can use an on-premise cluster. The key requirement is that you have nodes equipped with powerful NVIDIA GPUs.

2. GPU-Enabled Nodes

DeepSeek-R1 requires significant GPU memory and compute power. Nodes with NVIDIA A100, H100, or L40S GPUs are ideal. Ensure your cluster’s node pool consists of these machines. You can verify that your nodes are recognized by Kubernetes and see their GPU capacity:

kubectl get nodes "-o=custom-columns=NAME:.metadata.name,GPU-CAPACITY:.status.capacity.nvidia\.com/gpu"

If the `GPU-CAPACITY` column is empty or shows `0`, you need to install the necessary drivers and device plugins.

3. NVIDIA GPU Operator

The easiest way to manage NVIDIA GPU drivers, the container runtime, and related components within Kubernetes is by using the NVIDIA GPU Operator. It uses the operator pattern to automate the management of all NVIDIA software components needed to provision GPUs.

Installation is typically done via Helm:

helm repo add nvidia https://helm.ngc.nvidia.com/nvidia
helm repo update
helm install --wait --generate-name \
  -n gpu-operator --create-namespace \
  nvidia/gpu-operator

After installation, the operator will automatically install drivers on your GPU nodes, making them available for pods to request.

4. Kubectl and Helm Installed

Ensure you have `kubectl` (the Kubernetes command-line tool) and `Helm` (the Kubernetes package manager) installed and configured to communicate with your cluster.

Choosing a Model Serving Framework

You can’t just run a Python script in a container to serve an LLM in production. You need a specialized serving framework optimized for high-throughput, low-latency inference. These frameworks handle complex tasks like request batching, memory management with paged attention, and optimized GPU kernel execution.

  • vLLM: An open-source library from UC Berkeley, vLLM is incredibly popular for its high performance. It introduces PagedAttention, an algorithm that efficiently manages the GPU memory required for attention keys and values, significantly boosting throughput. It also provides an OpenAI-compatible API server out of the box.
  • Text Generation Inference (TGI): Developed by Hugging Face, TGI is another production-ready toolkit for deploying LLMs. It’s highly optimized and widely used, offering features like continuous batching and quantized inference.

For this guide, we will use vLLM due to its excellent performance and ease of use for deploying a wide range of models.

Step-by-Step Guide: Deploying DeepSeek-R1 with vLLM on Kubernetes

Now we get to the core of the deployment. We will create a Kubernetes Deployment to manage our model server pods and a Service to expose them within the cluster.

Step 1: Understanding the vLLM Container

We don’t need to build a custom Docker image. The vLLM project provides a pre-built Docker image that can download and serve any model from the Hugging Face Hub. We will use the `vllm/vllm-openai:latest` image, which includes the OpenAI-compatible API server.

We will configure the model to be served by passing command-line arguments to the container. The key arguments are:

  • --model deepseek-ai/deepseek-r1: Specifies the model to download and serve.
  • --tensor-parallel-size N: The number of GPUs to use for tensor parallelism. This should match the number of GPUs requested by the pod.
  • --host 0.0.0.0: Binds the server to all network interfaces inside the container.

Step 2: Crafting the Kubernetes Deployment YAML

The Deployment manifest is the blueprint for our application. It defines the container image, resource requirements, replica count, and other configurations. Save the following content as `deepseek-deployment.yaml`.

apiVersion: apps/v1
kind: Deployment
metadata:
  name: deepseek-r1-deployment
  labels:
    app: deepseek-r1
spec:
  replicas: 1 # Start with 1 and scale later
  selector:
    matchLabels:
      app: deepseek-r1
  template:
    metadata:
      labels:
        app: deepseek-r1
    spec:
      containers:
      - name: vllm-container
        image: vllm/vllm-openai:latest
        args: [
            "--model", "deepseek-ai/deepseek-r1",
            "--tensor-parallel-size", "1", # Adjust based on number of GPUs
            "--host", "0.0.0.0"
        ]
        ports:
        - containerPort: 8000
        resources:
          limits:
            nvidia.com/gpu: 1 # Request 1 GPU
          requests:
            nvidia.com/gpu: 1 # Request 1 GPU
        volumeMounts:
        - mountPath: /root/.cache/huggingface
          name: model-cache-volume
      volumes:
      - name: model-cache-volume
        emptyDir: {} # For simplicity; use a PersistentVolume in production

Key points in this manifest:

  • spec.replicas: 1: We are starting with a single pod running the model.
  • image: vllm/vllm-openai:latest: The official vLLM image.
  • args: This is where we tell vLLM which model to run.
  • resources.limits: This is the most critical part for GPU workloads. nvidia.com/gpu: 1 tells the Kubernetes scheduler to find a node with at least one available NVIDIA GPU and assign it to this pod.
  • volumeMounts and volumes: We use an emptyDir volume to cache the downloaded model. This means the model will be re-downloaded if the pod is recreated. For faster startup times in production, you should use a `PersistentVolume` with a `ReadWriteMany` access mode.

Step 3: Creating the Kubernetes Service

A Deployment alone isn’t enough. We need a stable network endpoint to send requests to the pods. A Kubernetes Service provides this. It load-balances traffic across all pods managed by the Deployment.

Save the following as `deepseek-service.yaml`:

apiVersion: v1
kind: Service
metadata:
  name: deepseek-r1-service
spec:
  selector:
    app: deepseek-r1
  ports:
    - protocol: TCP
      port: 80
      targetPort: 8000
  type: ClusterIP # Exposes the service only within the cluster

This creates a `ClusterIP` service named `deepseek-r1-service`. Other applications inside the cluster can now reach our model at `http://deepseek-r1-service`.

Step 4: Applying the Manifests and Verifying the Deployment

Now, apply these configuration files to your cluster:

kubectl apply -f deepseek-deployment.yaml
kubectl apply -f deepseek-service.yaml

Check the status of your deployment. It may take several minutes for the pod to start, especially the first time, as it needs to pull the container image and download the large DeepSeek-R1 model.

# Check pod status (should eventually be 'Running')
kubectl get pods -l app=deepseek-r1

# Watch the logs to monitor the model download and server startup
kubectl logs -f -l app=deepseek-r1

Once you see a message in the logs indicating the server is running (e.g., “Uvicorn running on http://0.0.0.0:8000”), your model is ready to serve requests.

Testing the Deployed Model

Since we used the `vllm/vllm-openai` image, the server exposes an API that is compatible with the OpenAI Chat Completions API. This makes it incredibly easy to integrate with existing tools.

To test it from within the cluster, you can launch a temporary pod and use `curl`:

kubectl run -it --rm --image=curlimages/curl:latest temp-curl -- sh

Once inside the temporary pod’s shell, send a request to your service:

curl http://deepseek-r1-service/v1/chat/completions \
  -H "Content-Type: application/json" \
  -d '{
    "model": "deepseek-ai/deepseek-r1",
    "messages": [
      {"role": "system", "content": "You are a helpful assistant."},
      {"role": "user", "content": "What is the purpose of a Kubernetes Deployment?"}
    ]
  }'

You should receive a JSON response from the model with its answer, confirming your DeepSeek-R1 Kubernetes deployment is working correctly!

Advanced Considerations and Best Practices

Getting a single replica running is just the beginning. A production-ready MLOps setup requires more.

  • Model Caching: Use a `PersistentVolume` (backed by a fast network storage like NFS or a cloud provider’s file store) to cache the model weights. This dramatically reduces pod startup time after the initial download.
  • Autoscaling: Use the Horizontal Pod Autoscaler (HPA) to automatically scale the number of replicas based on CPU or memory. For more advanced GPU-based scaling, consider KEDA (Kubernetes Event-driven Autoscaling), which can scale based on metrics scraped from Prometheus, like GPU utilization.
  • Monitoring: Deploy Prometheus and Grafana to monitor your cluster. Use the DCGM Exporter (part of the GPU Operator) to get detailed GPU metrics (utilization, memory usage, temperature) into Prometheus. This is essential for understanding performance and cost.
  • Ingress: To expose your service to the outside world securely, use an Ingress controller (like NGINX or Traefik) along with an Ingress resource to handle external traffic, TLS termination, and routing.

Frequently Asked Questions

What are the minimum GPU requirements for DeepSeek-R1?
DeepSeek-R1 is a very large model. You will need a high-end data center GPU with at least 48GB of VRAM, such as an NVIDIA A100 (80GB) or H100, to run it effectively, even for inference. Always check the model card on Hugging Face for the latest requirements.

Can I use a different model serving framework?
Absolutely. While this guide uses vLLM, you can adapt the Deployment manifest to use other frameworks like Text Generation Inference (TGI), TensorRT-LLM, or OpenLLM. The core concepts of requesting GPU resources and using a Service remain the same.

How do I handle model updates or versioning?
Kubernetes Deployments support rolling updates. To update to a new model version, you can change the `–model` argument in your Deployment YAML. When you apply the new manifest, Kubernetes will perform a rolling update, gradually replacing old pods with new ones, ensuring zero downtime.

Is it cost-effective to run LLMs on Kubernetes?
While GPU instances are expensive, Kubernetes can improve cost-effectiveness through efficient resource utilization. By packing multiple workloads onto shared nodes and using autoscaling to match capacity with demand, you can avoid paying for idle resources, which is a common issue with statically provisioned VMs.

Conclusion

You have successfully navigated the process of deploying a state-of-the-art language model on a production-grade orchestration platform. By combining the power of DeepSeek-R1 with the scalability and resilience of Kubernetes, you unlock the ability to build and serve sophisticated AI applications that can handle real-world demand. The journey from a simple configuration to a fully automated, observable, and scalable system is the essence of MLOps. This DeepSeek-R1 Kubernetes deployment serves as a robust foundation, empowering you to innovate and build the next generation of AI-driven services. Thank you for reading the DevopsRoles page!

Test Terraform with LocalStack Go Client

In modern cloud engineering, Infrastructure as Code (IaC) is the gold standard for managing resources. Terraform has emerged as a leader in this space, allowing teams to define and provision infrastructure using a declarative configuration language. However, a significant challenge remains: how do you test your Terraform configurations efficiently without spinning up costly cloud resources and slowing down your development feedback loop? The answer lies in local cloud emulation. This guide provides a comprehensive walkthrough on how to leverage the powerful combination of Terraform LocalStack and the Go programming language to create a robust, local testing framework for your AWS infrastructure. This approach enables rapid, cost-effective integration testing, ensuring your code is solid before it ever touches a production environment.

Why Bother with Local Cloud Development?

The traditional “code, push, and pray” approach to infrastructure changes is fraught with risk and inefficiency. Testing against live AWS environments incurs costs, is slow, and can lead to resource conflicts between developers. A local cloud development strategy, centered around tools like LocalStack, addresses these pain points directly.

  • Cost Efficiency: By emulating AWS services on your local machine, you eliminate the need to pay for development or staging resources. This is especially beneficial when testing services that can be expensive, like multi-AZ RDS instances or EKS clusters.
  • Speed and Agility: Local feedback loops are orders of magnitude faster. Instead of waiting several minutes for a deployment pipeline to provision resources in the cloud, you can apply and test changes in seconds. This dramatically accelerates development and debugging.
  • Offline Capability: Develop and test your infrastructure configurations even without an internet connection. This is perfect for remote work or travel.
  • Isolated Environments: Each developer can run their own isolated stack, preventing the “it works on my machine” problem and eliminating conflicts over shared development resources.
  • Enhanced CI/CD Pipelines: Integrating local testing into your continuous integration (CI) pipeline allows you to catch errors early. You can run a full suite of integration tests against a LocalStack instance for every pull request, ensuring a higher degree of confidence before merging.

Setting Up Your Development Environment

Before we dive into the code, we need to set up our toolkit. This involves installing the necessary CLIs and getting LocalStack up and running with Docker.

Installing Core Tools

Ensure you have the following tools installed on your system. Most can be installed easily with package managers like Homebrew (macOS) or Chocolatey (Windows).

  • Terraform: The core IaC tool we’ll be using.
  • Go: The programming language for writing our integration tests.
  • Docker: The container platform needed to run LocalStack.
  • AWS CLI v2: Useful for interacting with and debugging our LocalStack instance.

Running LocalStack with Docker Compose

The easiest way to run LocalStack is with Docker Compose. Create a docker-compose.yml file with the following content. This configuration exposes the necessary ports and sets up a persistent volume for the LocalStack state.

version: "3.8"

services:
  localstack:
    container_name: "localstack_main"
    image: localstack/localstack:latest
    ports:
      - "127.0.0.1:4566:4566"            # LocalStack Gateway
      - "127.0.0.1:4510-4559:4510-4559"  # External services
    environment:
      - DEBUG=${DEBUG-}
      - DOCKER_HOST=unix:///var/run/docker.sock
    volumes:
      - "${LOCALSTACK_VOLUME_DIR:-./volume}:/var/lib/localstack"
      - "/var/run/docker.sock:/var/run/docker.sock"

Start LocalStack by running the following command in the same directory as your file:

docker-compose up -d

You can verify that it’s running correctly by checking the logs or using the AWS CLI, configured for the local endpoint:

aws --endpoint-url=http://localhost:4566 s3 ls

If this command returns an empty list without errors, your local AWS cloud is ready!

Crafting Your Terraform Configuration for LocalStack

The key to using Terraform with LocalStack is to configure the AWS provider to target your local endpoints instead of the official AWS APIs. This is surprisingly simple.

The provider Block: Pointing Terraform to LocalStack

In your Terraform configuration file (e.g., main.tf), you’ll define the aws provider with custom endpoints. This tells Terraform to direct all API calls for the specified services to your local container.

Important: For this to work seamlessly, you must use dummy values for access_key and secret_key. LocalStack doesn’t validate credentials by default.

terraform {
  required_providers {
    aws = {
      source  = "hashicorp/aws"
      version = "~> 5.0"
    }
  }
}

provider "aws" {
  region                      = "us-east-1"
  access_key                  = "test"
  secret_key                  = "test"
  skip_credentials_validation = true
  skip_metadata_api_check     = true
  skip_requesting_account_id  = true

  endpoints {
    s3 = "http://localhost:4566"
    # Add other services here, e.g.,
    # dynamodb = "http://localhost:4566"
    # lambda   = "http://localhost:4566"
  }
}

Example: Defining an S3 Bucket

Now, let’s define a simple resource. We’ll create an S3 bucket with a specific name and a tag. Add this to your main.tf file:

resource "aws_s3_bucket" "test_bucket" {
  bucket = "my-unique-local-test-bucket"

  tags = {
    Environment = "Development"
    ManagedBy   = "Terraform"
  }
}

output "bucket_name" {
  value = aws_s3_bucket.test_bucket.id
}

With this configuration, you can now run terraform init and terraform apply. Terraform will communicate with your LocalStack container and create the S3 bucket locally.

Writing Go Tests with the AWS SDK for your Terraform LocalStack Setup

Now for the exciting part: writing automated tests in Go to validate the infrastructure that Terraform creates. We will use the official AWS SDK for Go V2, configuring it to point to our LocalStack instance.

Initializing the Go Project

In the same directory, initialize a Go module:

go mod init terraform-localstack-test
go get github.com/aws/aws-sdk-go-v2
go get github.com/aws/aws-sdk-go-v2/config
go get github.com/aws/aws-sdk-go-v2/service/s3
go get github.com/aws/aws-sdk-go-v2/aws

Configuring the AWS Go SDK v2 for LocalStack

To make the Go SDK talk to LocalStack, we need to provide a custom configuration. This involves creating a custom endpoint resolver and disabling credential checks. Create a helper file, perhaps aws_config.go, to handle this logic.

// aws_config.go
package main

import (
	"context"
	"github.com/aws/aws-sdk-go-v2/aws"
	"github.com/aws/aws-sdk-go-v2/config"
)

const (
	awsRegion    = "us-east-1"
	localstackEP = "http://localhost:4566"
)

// newAWSConfig creates a new AWS SDK v2 configuration pointed at LocalStack
func newAWSConfig(ctx context.Context) (aws.Config, error) {
	// Custom resolver for LocalStack endpoints
	customResolver := aws.EndpointResolverWithOptionsFunc(func(service, region string, options ...interface{}) (aws.Endpoint, error) {
		return aws.Endpoint{
			URL:           localstackEP,
			SigningRegion: region,
			Source:        aws.EndpointSourceCustom,
		}, nil
	})

	// Load default config and override with custom settings
	return config.LoadDefaultConfig(ctx,
		config.WithRegion(awsRegion),
		config.WithEndpointResolverWithOptions(customResolver),
		config.WithCredentialsProvider(aws.AnonymousCredentials{}),
	)
}

Writing the Integration Test: A Practical Example

Now, let’s write the test file main_test.go. We’ll use Go’s standard testing package. The test will create an S3 client using our custom configuration and then perform checks against the S3 bucket created by Terraform.

Test Case 1: Verifying S3 Bucket Creation

This test will check if the bucket exists. The HeadBucket API call is a lightweight way to do this; it succeeds if the bucket exists and you have permission, and fails otherwise.

// main_test.go
package main

import (
	"context"
	"github.com/aws/aws-sdk-go-v2/service/s3"
	"testing"
)

func TestS3BucketExists(t *testing.T) {
	// Arrange
	ctx := context.TODO()
	bucketName := "my-unique-local-test-bucket"

	cfg, err := newAWSConfig(ctx)
	if err != nil {
		t.Fatalf("failed to create aws config: %v", err)
	}

	s3Client := s3.NewFromConfig(cfg)

	// Act
	_, err = s3Client.HeadBucket(ctx, &s3.HeadBucketInput{
		Bucket: &bucketName,
	})

	// Assert
	if err != nil {
		t.Errorf("HeadBucket failed for bucket '%s': %v", bucketName, err)
	}
}

Test Case 2: Checking Bucket Tagging

A good test goes beyond mere existence. Let’s verify that the tags we defined in our Terraform code were applied correctly.

// Add this test to main_test.go
func TestS3BucketHasCorrectTags(t *testing.T) {
	// Arrange
	ctx := context.TODO()
	bucketName := "my-unique-local-test-bucket"
	expectedTags := map[string]string{
		"Environment": "Development",
		"ManagedBy":   "Terraform",
	}

	cfg, err := newAWSConfig(ctx)
	if err != nil {
		t.Fatalf("failed to create aws config: %v", err)
	}
	s3Client := s3.NewFromConfig(cfg)

	// Act
	output, err := s3Client.GetBucketTagging(ctx, &s3.GetBucketTaggingInput{
		Bucket: &bucketName,
	})
	if err != nil {
		t.Fatalf("GetBucketTagging failed: %v", err)
	}

	// Assert
	actualTags := make(map[string]string)
	for _, tag := range output.TagSet {
		actualTags[*tag.Key] = *tag.Value
	}

	for key, expectedValue := range expectedTags {
		actualValue, ok := actualTags[key]
		if !ok {
			t.Errorf("Expected tag '%s' not found", key)
			continue
		}
		if actualValue != expectedValue {
			t.Errorf("Tag '%s' has wrong value. Got: '%s', Expected: '%s'", key, actualValue, expectedValue)
		}
	}
}

The Complete Workflow: Tying It All Together

Now you have all the pieces. Here is the end-to-end workflow for developing and testing your infrastructure locally.

Step 1: Start LocalStack

Ensure your local cloud is running.

docker-compose up -d

Step 2: Apply Terraform Configuration

Initialize Terraform (if you haven’t already) and apply your configuration to provision the resources inside the LocalStack container.

terraform init
terraform apply -auto-approve

Step 3: Run the Go Integration Tests

Execute your test suite to validate the infrastructure.

go test -v

If all tests pass, you have a high degree of confidence that your Terraform code correctly defines the infrastructure you intended.

Step 4: Tear Down the Infrastructure

After testing, clean up the resources in LocalStack and, if desired, stop the container.

terraform destroy -auto-approve
docker-compose down

Frequently Asked Questions

1. Is LocalStack free?
LocalStack has a free, open-source Community version that covers many core AWS services like S3, DynamoDB, Lambda, and SQS. More advanced services are available in the Pro/Team versions.

2. How does this compare to Terratest?
Terratest is another excellent framework for testing Terraform code, also written in Go. The approach described here is complementary. You can use Terratest’s helper functions to run terraform apply and then use the AWS SDK configuration method shown in this article to point your Terratest assertions at a LocalStack endpoint.

3. Can I use other languages for testing?
Absolutely! The core principle is configuring the AWS SDK of your chosen language (Python’s Boto3, JavaScript’s AWS-SDK, etc.) to use the LocalStack endpoint. The logic remains the same.

4. What if a service isn’t supported by LocalStack?
While LocalStack’s service coverage is extensive, it’s not 100%. For unsupported services, you may need to rely on mocks, stubs, or targeted tests against a real (sandboxed) AWS environment. Always check the official LocalStack documentation for the latest service coverage.

Conclusion

Adopting a local-first testing strategy is a paradigm shift for cloud infrastructure development. By combining the declarative power of Terraform with the high-fidelity emulation of LocalStack, you can build a fast, reliable, and cost-effective testing loop. Writing integration tests in Go with the AWS SDK provides the final piece of the puzzle, allowing you to programmatically verify that your infrastructure behaves exactly as expected. This Terraform LocalStack workflow not only accelerates your development cycle but also dramatically improves the quality and reliability of your infrastructure deployments, giving you and your team the confidence to innovate and deploy with speed. Thank you for reading the DevopsRoles page!

Mastering Linux Cache: Boost Performance & Speed

In the world of system administration and DevOps, performance is paramount. Every millisecond counts, and one of the most fundamental yet misunderstood components contributing to a Linux system’s speed is its caching mechanism. Many administrators see high memory usage attributed to “cache” and instinctively worry, but this is often a sign of a healthy, well-performing system. Understanding the Linux cache is not just an academic exercise; it’s a practical skill that allows you to accurately diagnose performance issues and optimize your infrastructure. This comprehensive guide will demystify the Linux caching system, from its core components to practical monitoring and management techniques.

What is the Linux Cache and Why is it Crucial?

At its core, the Linux cache is a mechanism that uses a portion of your system’s unused Random Access Memory (RAM) to store data that has recently been read from or written to a disk (like an SSD or HDD). Since accessing data from RAM is orders of magnitude faster than reading it from a disk, this caching dramatically speeds up system operations.

Think of it like a librarian who keeps the most frequently requested books on a nearby cart instead of returning them to the vast shelves after each use. The next time someone asks for one of those popular books, the librarian can hand it over instantly. In this analogy, the RAM is the cart, the disk is the main library, and the Linux kernel is the smart librarian. This process minimizes disk I/O (Input/Output), which is one of the slowest operations in any computer system.

The key benefits include:

  • Faster Application Load Times: Applications and their required data can be served from the cache instead of the disk, leading to quicker startup.
  • Improved System Responsiveness: Frequent operations, like listing files in a directory, become almost instantaneous as the required metadata is held in memory.
  • Reduced Disk Wear: By minimizing unnecessary read/write operations, caching can extend the lifespan of physical storage devices, especially SSDs.

It’s important to understand that memory used for cache is not “wasted” memory. The kernel is intelligent. If an application requires more memory, the kernel will seamlessly and automatically shrink the cache to free up RAM for the application. This dynamic management ensures that caching enhances performance without starving essential processes of the memory they need.

Diving Deep: The Key Components of the Linux Cache

The term “Linux cache” is an umbrella for several related but distinct mechanisms working together. The most significant components are the Page Cache, Dentry Cache, and Inode Cache.

The Page Cache: The Heart of File Caching

The Page Cache is the main disk cache used by the Linux kernel. When you read a file from the disk, the kernel reads it in chunks called “pages” (typically 4KB in size) and stores these pages in unused areas of RAM. The next time any process requests the same part of that file, the kernel can provide it directly from the much faster Page Cache, avoiding a slow disk read operation.

This also works for write operations. When you write to a file, the data can be written to the Page Cache first (a process known as write-back caching). The system can then inform the application that the write is complete, making the application feel fast and responsive. The kernel then flushes these “dirty” pages to the disk in the background at an optimal time. The sync command can be used to manually force all dirty pages to be written to disk.

The Buffer Cache: Buffering Block Device I/O

Historically, the Buffer Cache (or `Buffers`) was a separate entity that held metadata related to block devices, such as the filesystem journal or partition tables. In modern Linux kernels (post-2.4), the Buffer Cache is not a separate memory pool. Its functionality has been unified with the Page Cache. Today, when you see “Buffers” in tools like free or top, it generally refers to pages within the Page Cache that are specifically holding block device metadata. It’s a temporary storage for raw disk blocks and is a much smaller component compared to the file-centric Page Cache.

The Slab Allocator: Dentry and Inode Caches

Beyond caching file contents, the kernel also needs to cache filesystem metadata to avoid repeated disk lookups for file structure information. This is handled by the Slab allocator, a special memory management mechanism within the kernel for frequently used data structures.

Dentry Cache (dcache)

A “dentry” (directory entry) is a data structure used to translate a file path (e.g., /home/user/document.txt) into an inode. Every time you access a file, the kernel has to traverse this path. The dentry cache stores these translations in RAM. This dramatically speeds up operations like ls -l or any file access, as the kernel doesn’t need to read directory information from the disk repeatedly. You can learn more about kernel memory allocation from the official Linux Kernel documentation.

Inode Cache (icache)

An “inode” stores all the metadata about a file—except for its name and its actual data content. This includes permissions, ownership, file size, timestamps, and pointers to the disk blocks where the file’s data is stored. The inode cache holds this information in memory for recently accessed files, again avoiding slow disk I/O for metadata retrieval.

How to Monitor and Analyze Linux Cache Usage

Monitoring your system’s cache is straightforward with standard Linux command-line tools. Understanding their output is key to getting a clear picture of your memory situation.

Using the free Command

The free command is the quickest way to check memory usage. Using the -h (human-readable) flag makes the output easy to understand.

$ free -h
               total        used        free      shared  buff/cache   available
Mem:            15Gi       4.5Gi       338Mi       1.1Gi        10Gi        9.2Gi
Swap:          2.0Gi       1.2Gi       821Mi

Here’s how to interpret the key columns:

  • total: Total installed RAM.
  • used: Memory actively used by applications (total – free – buff/cache).
  • free: Truly unused memory. This number is often small on a busy system, which is normal.
  • buff/cache: This is the combined memory used by the Page Cache, Buffer Cache, and Slab allocator (dentries and inodes). This is the memory the kernel can reclaim if needed.
  • available: This is the most important metric. It’s an estimation of how much memory is available for starting new applications without swapping. It includes the “free” memory plus the portion of “buff/cache” that can be easily reclaimed.

Understanding /proc/meminfo

For a more detailed breakdown, you can inspect the virtual file /proc/meminfo. This file provides a wealth of information that tools like free use.

$ cat /proc/meminfo | grep -E '^(MemAvailable|Buffers|Cached|SReclaimable)'
MemAvailable:    9614444 kB
Buffers:          345520 kB
Cached:          9985224 kB
SReclaimable:     678220 kB
  • MemAvailable: The same as the “available” column in free.
  • Buffers: The memory used by the buffer cache.
  • Cached: Memory used by the page cache, excluding swap cache.
  • SReclaimable: The part of the Slab memory (like dentry and inode caches) that is reclaimable.

Advanced Tools: vmstat and slabtop

For dynamic monitoring, vmstat (virtual memory statistics) is excellent. Running vmstat 2 will give you updates every 2 seconds.

$ vmstat 2
procs -----------memory---------- ---swap-- -----io---- -system-- ------cpu-----
 r  b   swpd   free   buff  cache   si   so    bi    bo   in   cs us sy id wa st
 1  0 1252348 347492 345632 10580980    2    5   119   212  136  163  9  2 88  1  0
...

Pay attention to the bi (blocks in) and bo (blocks out) columns. High, sustained numbers here indicate heavy disk I/O. If these values are low while the system is busy, it’s a good sign that the cache is effectively serving requests.

To inspect the Slab allocator directly, you can use slabtop.

# requires root privileges
sudo slabtop

This command provides a real-time view of the top kernel caches, allowing you to see exactly how much memory is being used by objects like dentry and various inode caches.

Managing the Linux Cache: When and How to Clear It

Warning: Manually clearing the Linux cache is an operation that should be performed with extreme caution and is rarely necessary on a production system. The kernel’s memory management algorithms are highly optimized. Forcing a cache drop will likely degrade performance temporarily, as the system will need to re-read required data from the slow disk.

Why You Might *Think* You Need to Clear the Cache

The most common reason administrators want to clear the cache is a misunderstanding of the output from free -h. They see a low “free” memory value and a high “buff/cache” value and assume the system is out of memory. As we’ve discussed, this is the intended behavior of a healthy system. The only legitimate reason to clear the cache is typically for benchmarking purposes—for example, to measure the “cold-start” performance of an application’s disk I/O without any caching effects.

The drop_caches Mechanism: The Right Way to Clear Cache

If you have a valid reason to clear the cache, Linux provides a non-destructive way to do so via the /proc/sys/vm/drop_caches interface. For a detailed explanation, resources like Red Hat’s articles on memory management are invaluable.

First, it’s good practice to write all cached data to disk to prevent any data loss using the sync command. This flushes any “dirty” pages from memory to the storage device.

# First, ensure all pending writes are completed
sync

Next, you can write a value to drop_caches to specify what to clear. You must have root privileges to do this.

  • To free pagecache only:
    echo 1 | sudo tee /proc/sys/vm/drop_caches

  • To free reclaimable slab objects (dentries and inodes):
    echo 2 | sudo tee /proc/sys/vm/drop_caches

  • To free pagecache, dentries, and inodes (most common):
    echo 3 | sudo tee /proc/sys/vm/drop_caches

Example: Before and After

Let’s see the effect.

Before:

$ free -h
               total        used        free      shared  buff/cache   available
Mem:            15Gi       4.5Gi       338Mi       1.1Gi        10Gi        9.2Gi

Action:

$ sync; echo 3 | sudo tee /proc/sys/vm/drop_caches
3

After:

$ free -h
               total        used        free      shared  buff/cache   available
Mem:            15Gi       4.4Gi        10Gi       1.1Gi       612Mi        9.6Gi

As you can see, the buff/cache value dropped dramatically from 10Gi to 612Mi, and the free memory increased by a corresponding amount. However, the system’s performance will now be slower for any operation that needs data that was just purged from the cache.

Frequently Asked Questions

What’s the difference between buffer and cache in Linux?
Historically, buffers were for raw block device I/O and cache was for file content. In modern kernels, they are unified. “Cache” (Page Cache) holds file data, while “Buffers” represents metadata for block I/O, but both reside in the same memory pool.
Is high cache usage a bad thing in Linux?
No, quite the opposite. High cache usage is a sign that your system is efficiently using available RAM to speed up disk operations. It is not “wasted” memory and will be automatically released when applications need it.
How can I see what files are in the page cache?
There isn’t a simple, standard command for this, but third-party tools like vmtouch or pcstat can analyze a file or directory and report how much of it is currently resident in the page cache.
Will clearing the cache delete my data?
No. Using the drop_caches method will not cause data loss. The cache only holds copies of data that is permanently stored on the disk. Running sync first ensures that any pending writes are safely committed to the disk before the cache is cleared.

Conclusion

The Linux cache is a powerful and intelligent performance-enhancing feature, not a problem to be solved. By leveraging unused RAM, the kernel significantly reduces disk I/O and makes the entire system faster and more responsive. While the ability to manually clear the cache exists, its use cases are limited almost exclusively to specific benchmarking scenarios. For system administrators and DevOps engineers, the key is to learn how to monitor and interpret cache usage correctly using tools like free, vmstat, and /proc/meminfo. Embracing and understanding the behavior of the Linux cache is a fundamental step toward mastering Linux performance tuning and building robust, efficient systems.Thank you for reading the DevopsRoles page!

Red Hat Extends Ansible Automation: Forging the Future of IT with an Ambitious New Scope

In the ever-accelerating world of digital transformation, the complexity of IT environments is growing at an exponential rate. Hybrid clouds, edge computing, and the pervasive integration of artificial intelligence are no longer futuristic concepts but the daily reality for IT professionals. This intricate tapestry of technologies demands a new paradigm of automation—one that is not just reactive but predictive, not just scripted but intelligent, and not just centralized but pervasive. Recognizing this critical need, Red Hat extends Ansible Automation with a bold and ambitious new scope, fundamentally reshaping what’s possible in the realm of IT automation and management.

For years, Red Hat Ansible Automation Platform has been the de facto standard for automating provisioning, configuration management, and application deployment. Its agentless architecture, human-readable YAML syntax, and vast ecosystem of modules have empowered countless organizations to streamline operations, reduce manual errors, and accelerate service delivery. However, the challenges of today’s IT landscape demand more than just traditional automation. They require a platform that can intelligently respond to events in real-time, harness the power of generative AI to democratize automation, and seamlessly extend its reach from the core datacenter to the farthest edge of the network. This article delves into the groundbreaking extensions to the Ansible Automation Platform, exploring how Red Hat is pioneering the future of autonomous IT operations and providing a roadmap for businesses to not only navigate but thrive in this new era of complexity.

The Next Frontier: How Red Hat Extends Ansible Automation for the AI-Driven Era

The core of Ansible’s expanded vision lies in its deep integration with artificial intelligence and its evolution into a more responsive, event-driven platform. This isn’t merely about adding a few new features; it’s a strategic realignment to address the fundamental shifts in how IT is managed and operated. The new scope of Ansible Automation is built upon several key pillars, each designed to tackle a specific set of modern IT challenges.

Ansible Lightspeed with IBM Watson Code Assistant: The Dawn of Generative AI in Automation

One of the most transformative extensions to the Ansible Automation Platform is the introduction of Ansible Lightspeed with IBM Watson Code Assistant. This generative AI service, born from the erstwhile Project Wisdom, is designed to revolutionize how Ansible content is created, maintained, and adopted across an organization.

From Novice to Expert: Democratizing Ansible Playbook Creation

Traditionally, writing robust and efficient Ansible Playbooks required a significant level of expertise in both Ansible’s syntax and the intricacies of the target systems. Ansible Lightspeed dramatically lowers this barrier to entry by allowing users to generate Ansible tasks and even entire Playbooks using natural language prompts. This has profound implications for productivity and inclusivity:

  • For the beginner: A system administrator who understands the desired outcome but is unfamiliar with Ansible’s modules and syntax can simply describe the task in plain English (e.g., “create a new EC2 instance in AWS with a specific VPC and security group”) and receive a syntactically correct and functional Ansible task as a starting point.
  • For the expert: Experienced automators can accelerate their workflow by offloading the creation of boilerplate code and focusing on the more complex and strategic aspects of their automation. This also helps in discovering new modules and best practices they might not have been aware of.

Advanced Playbook Generation and Code Explanation

Ansible Lightspeed goes beyond simple task generation. With its deep integration into Visual Studio Code via the Ansible extension, it provides a seamless and interactive development experience. Users can generate multi-task Playbooks, and crucially, request explanations for existing Ansible code. This “explainability” feature is invaluable for training new team members, debugging complex Playbooks, and ensuring a consistent understanding of automation logic across the organization.

Example: Generating a Multi-Task Playbook with Ansible Lightspeed

A developer could input the following prompt into the Ansible Lightspeed interface in VS Code:

# ansible-lightspeed prompt
# - Install the latest version of Nginx
# - Create a new index.html file with the content "Welcome to our new web server"
# - Start and enable the Nginx service

Ansible Lightspeed, powered by Watson Code Assistant’s fine-tuned model trained on vast amounts of Ansible Galaxy content, would then generate a complete and contextually aware Playbook:

YAML

---
- name: Deploy and configure Nginx web server
  hosts: webservers
  become: true
  tasks:
    - name: Install the latest version of Nginx
      ansible.builtin.package:
        name: nginx
        state: latest

    - name: Create a custom index.html file
      ansible.builtin.copy:
        content: "Welcome to our new web server"
        dest: /usr/share/nginx/html/index.html
        mode: '0644'

    - name: Start and enable the Nginx service
      ansible.builtin.service:
        name: nginx
        state: started
        enabled: yes

Model Customization: Tailoring AI to Your Organization’s Needs

Recognizing that every organization has its own unique automation patterns, best practices, and custom modules, Red Hat and IBM have enabled model customization for Ansible Lightspeed. This allows enterprises to train the Watson Code Assistant model on their own private Ansible content. The result is a generative AI service that provides recommendations aligned with the organization’s specific operational standards, further improving the quality, accuracy, and relevance of the generated code.

Event-Driven Ansible: From Proactive to Responsive Automation

While traditional Ansible excels at executing predefined workflows, the dynamic nature of modern IT environments requires a more reactive and intelligent approach. This is where Event-Driven Ansible comes into play, a powerful extension that enables the platform to listen for and automatically respond to events from a wide range of sources across the IT landscape.

The Architecture of Responsiveness: Rulebooks, Sources, and Actions

Event-Driven Ansible introduces the concept of Ansible Rulebooks, which are YAML-defined sets of rules that link event sources to specific actions. The architecture is elegantly simple yet incredibly powerful:

  • Event Sources: These are plugins that connect to various monitoring, observability, and IT service management tools. There are out-of-the-box source plugins for a multitude of platforms, including AWS, Microsoft Azure, Google Cloud Platform, Kafka, webhooks, and popular observability tools like Dynatrace, Prometheus, and Grafana.
  • Rules: Within a rulebook, you define conditions that evaluate the incoming event data. These conditions can be as simple as checking for a specific status code or as complex as a multi-part logical expression that correlates data from different parts of the event payload.
  • Actions: When a rule’s condition is met, a corresponding action is triggered. This action can be running a full-fledged Ansible Playbook, executing a specific module, or even posting a new event to another system, creating a chain of automated workflows.

Practical Use Cases for Event-Driven Ansible

The applications of Event-Driven Ansible are vast and span across numerous IT domains:

  • Self-Healing Infrastructure: If a monitoring tool detects a failed web server, Event-Driven Ansible can automatically trigger a Playbook to restart the service, provision a new server, and update the load balancer, all without human intervention.Example: A Simple Self-Healing RulebookYAML--- - name: Monitor web server health hosts: all sources: - ansible.eda.url_check: urls: - https://www.example.com delay: 30 rules: - name: Restart Nginx on failure condition: event.url_check.status == "down" action: run_playbook: name: restart_nginx.yml
  • Automated Security Remediation: When a security information and event management (SIEM) system like Splunk or an endpoint detection and response (EDR) tool such as CrowdStrike detects a threat, Event-Driven Ansible can immediately execute a response Playbook. This could involve isolating the affected host by updating firewall rules, quarantining a user account, or collecting forensic data for further analysis.
  • FinOps and Cloud Cost Optimization: Event-Driven Ansible can be used to implement sophisticated FinOps strategies. By listening to events from cloud provider billing and usage APIs, it can automatically scale down underutilized resources during off-peak hours, decommission idle development environments, or enforce tagging policies to ensure proper cost allocation.
  • Hybrid Cloud and Edge Automation: In distributed environments, Event-Driven Ansible can react to changes in network latency, resource availability at the edge, or synchronization issues between on-premises and cloud resources, triggering automated workflows to maintain operational resilience.

Expanding the Automation Universe: New Content Collections and Integrations

The power of Ansible has always been in its extensive ecosystem of modules and collections. Red Hat is supercharging this ecosystem with a continuous stream of new, certified, and validated content, ensuring that Ansible can automate virtually any technology in the modern IT stack.

AI Infrastructure and MLOps

A key focus of the new content collections is the automation of AI and machine learning infrastructure. With new collections for Red Hat OpenShift AI and other popular MLOps platforms, organizations can automate the entire lifecycle of their AI/ML workloads, from provisioning GPU-accelerated compute nodes to deploying and managing complex machine learning models.

Networking and Security Automation at Scale

Red Hat continues to invest heavily in network and security automation. Recent updates include:

  • Expanded Cisco Integration: With a 300% expansion of the Cisco Intersight collection, network engineers can automate a wide range of tasks within the UCS ecosystem.
  • Enhanced Multi-Vendor Support: New and updated collections for vendors like Juniper, F5, and Nokia ensure that Ansible remains a leading platform for multi-vendor network automation.
  • Validated Security Content: Validated content for proactive security scenarios with Event-Driven Ansible enables security teams to build robust, automated threat response workflows.

Deepened Hybrid and Multi-Cloud Capabilities

The new scope of Ansible Automation places a strong emphasis on seamless hybrid and multi-cloud management. Enhancements include:

  • Expanded Cloud Provider Support: Significant updates to the AWS, Azure, and Google Cloud collections, including support for newer services like Azure Arc and enhanced capabilities for managing virtual machines and storage.
  • Virtualization Modernization: Improved integration with VMware vSphere and support for Red Hat OpenShift Virtualization make it easier for organizations to manage and migrate their virtualized workloads.
  • Infrastructure as Code (IaC) Integration: Upcoming integrations with tools like Terraform Enterprise and HashiCorp Vault will further solidify Ansible’s position as a central orchestrator in a modern IaC toolchain.

Ansible at the Edge: Automating the Distributed Enterprise

As computing moves closer to the data source, the need for robust and scalable edge automation becomes paramount. Red Hat has strategically positioned Ansible Automation Platform as the ideal solution for managing complex edge deployments.

Overcoming Edge Challenges with Automation Mesh

Ansible’s Automation Mesh provides a flexible and resilient architecture for distributing automation execution across geographically dispersed locations. This allows organizations to:

  • Execute Locally: Run automation closer to the edge devices, reducing latency and ensuring continued operation even with intermittent network connectivity to the central controller.
  • Scale Rapidly: Easily scale automation capacity to manage thousands of edge sites, network devices, and IoT endpoints.
  • Enhance Security: Deploy standardized configurations and automate patch management to maintain a strong security posture across the entire edge estate.

Real-World Edge Use Cases

  • Retail: Automating the deployment and configuration of point-of-sale (POS) systems, in-store servers, and IoT devices across thousands of retail locations.
  • Telecommunications: Automating the configuration and management of virtualized radio access networks (vRAN) and multi-access edge computing (MEC) infrastructure.
  • Manufacturing: Automating the configuration and monitoring of industrial control systems (ICS) and IoT sensors on the factory floor.

Frequently Asked Questions (FAQ)

Q1: How does Ansible Lightspeed with IBM Watson Code Assistant ensure the quality and security of the generated code?

Ansible Lightspeed is trained on a vast corpus of curated Ansible content from sources like Ansible Galaxy, with a strong emphasis on best practices. The models are fine-tuned to produce high-quality, reliable automation code. Furthermore, it provides source matching, giving users transparency into the potential origins of the generated code, including the author and license. For organizations with stringent security and compliance requirements, the ability to customize the model with their own internal, vetted Ansible content provides an additional layer of assurance.

Q2: Can Event-Driven Ansible integrate with custom or in-house developed applications?

Yes, Event-Driven Ansible is designed for flexibility and extensibility. One of its most powerful source plugins is the generic webhook source, which can receive events from any application or service capable of sending an HTTP POST request. This makes it incredibly easy to integrate with custom applications, legacy systems, and CI/CD pipelines. For more complex integrations, it’s also possible to develop custom event source plugins.

Q3: Is Ansible still relevant in a world dominated by Kubernetes and containers?

Absolutely. In fact, Ansible’s role is more critical than ever in a containerized world. While Kubernetes excels at container orchestration, it doesn’t solve all automation challenges. Ansible is a perfect complement to Kubernetes for tasks such as:

  • Provisioning and managing the underlying infrastructure for Kubernetes clusters, whether on-premises or in the cloud.
  • Automating the deployment of complex, multi-tier applications onto Kubernetes.
  • Managing the configuration of applications running inside containers.
  • Orchestrating workflows that span both Kubernetes and traditional IT infrastructure, which is a common reality in most enterprises.

Q4: How does Automation Mesh improve the performance and reliability of Ansible Automation at scale?

Automation Mesh introduces a distributed execution model. Instead of all automation jobs running on a central controller, they can be distributed to execution nodes located closer to the managed infrastructure. This provides several benefits:

  • Reduced Latency: For automation targeting geographically dispersed systems, running the execution from a nearby node significantly reduces network latency and improves performance.
  • Improved Reliability: If the connection to the central controller is lost, execution nodes can continue to run scheduled jobs, providing a higher level of resilience.
  • Enhanced Scalability: By distributing the execution load across multiple nodes, Automation Mesh allows the platform to handle a much larger volume of concurrent automation jobs.

Conclusion: A New Era of Intelligent Automation

The landscape of IT is in a state of constant evolution, and the tools we use to manage it must evolve as well. With its latest extensions, Red Hat extends Ansible Automation beyond its traditional role as a configuration management and orchestration tool. It is now a comprehensive, intelligent automation platform poised to tackle the most pressing challenges of the AI-driven, hybrid cloud era. By seamlessly integrating the power of generative AI with Ansible Lightspeed, embracing real-time responsiveness with Event-Driven Ansible, and continuously expanding its vast content ecosystem, Red Hat is not just keeping pace with the future of IT—it is actively defining it. For organizations looking to build a more agile, resilient, and innovative IT operation, the ambitious new scope of the Red Hat Ansible Automation Platform offers a clear and compelling path forward.

Devops Tutorial

Exit mobile version