MLOps, or Machine Learning Operations, is the practice of integrating machine learning models into production systems with efficiency, reliability, and scalability. It bridges the gap between data science and IT operations by automating the deployment, monitoring, and management of machine learning models. MLOps ensures continuous integration, delivery, and training of models, making it easier to maintain, update, and improve AI-driven applications. This discipline is crucial for organizations looking to harness the power of machine learning in a structured, repeatable, and scalable way.
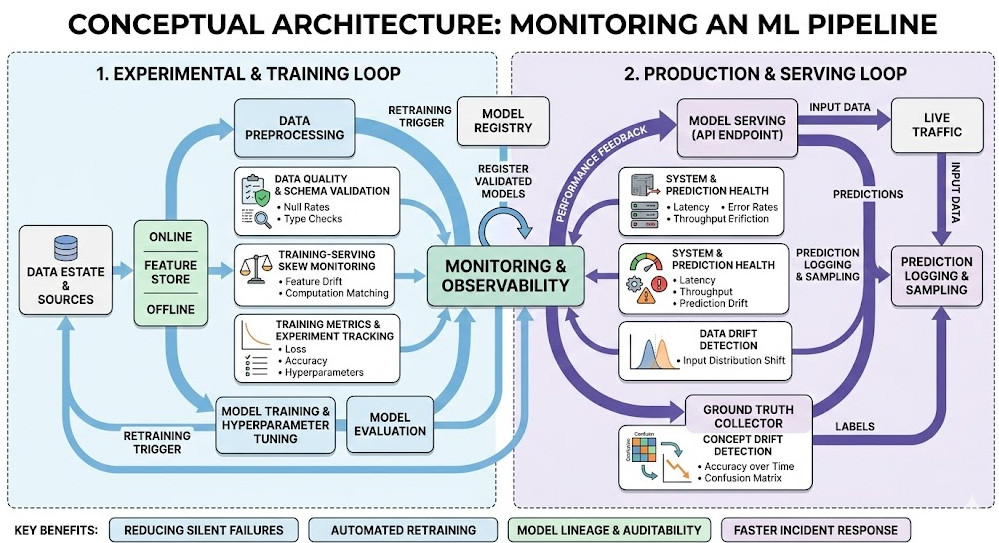
Introduction: If you think deploying a model is the hard part, you have clearly never tried Monitoring an ML Pipeline in a live production environment.
I learned this the hard way back in 2018.
My team deployed a flawless pricing model, went home for the weekend, and returned to a six-figure revenue loss.
Why? Because data drifts. User behavior changes. Models degrade.
Software decays predictably, but machine learning models fail silently.
The Brutal Reality of Monitoring an ML Pipeline
Let’s get one thing straight.
Standard DevOps tools won’t save you here.
You can track CPU spikes and memory leaks all day long. Your dashboard will glow a comforting, healthy green.
Meanwhile, your neural network is confidently classifying fraudulent transactions as legitimate.
Traditional APM (Application Performance Monitoring) tools are blind to the nuances of statistical drift.
You need a specialized stack. And you don’t need to pay enterprise vendors millions to build one.
Building the Stack for Monitoring an ML Pipeline
I’ve spent years ripping out bloated, expensive enterprise platforms.
Today, I strictly rely on battle-tested open-source components.
It’s cheaper, infinitely more customizable, and honestly, much more reliable.
Let’s break down the exact anatomy of a robust stack.
1. Data Logging and Ingestion: The Foundation
You can’t monitor what you don’t measure.
Every single prediction your model makes must be logged.
We use a combination of Kafka for stream processing and a fast data warehouse like ClickHouse.
You need to capture the raw input features, the model’s output, and, eventually, the ground truth.
If you don’t have a solid ingestion layer, your entire strategy for Monitoring an ML Pipeline will collapse.
2. Drift Detection: Catching Silent Failures
This is where the magic happens.
We need to detect both Data Drift (inputs changing) and Concept Drift (the relationship between inputs and outputs changing).
They use advanced statistical tests (like Kolmogorov-Smirnov) to alert you when your data distribution shifts.
# Example: Basic Data Drift Detection using Evidently
from evidently.report import Report
from evidently.metric_preset import DataDriftPreset

def check_pipeline_drift(reference_data, current_data):
    # Initialize the drift report
    drift_report = Report(metrics=[DataDriftPreset()])

    # Calculate drift between reference and production data
    drift_report.run(reference_data=reference_data, current_data=current_data)

    return drift_report.as_dict()
Visualizing the Chaos: Dashboards That Actually Work
Alert fatigue is a massive problem in MLOps.
If your Slack channel is blowing up with false positives, your engineers will start ignoring it.
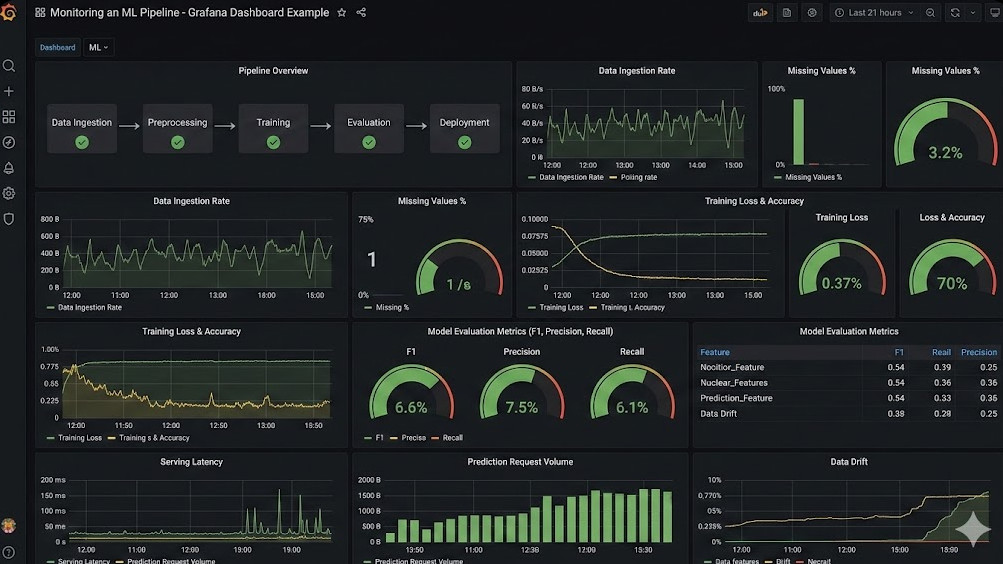
This is why visualization is a critical aspect of Monitoring an ML Pipeline.
Enter Prometheus and Grafana.
3. Time-Series Metrics with Prometheus
Prometheus is the industry standard for scraping time-series data.
We expose our drift scores and model latency metrics to Prometheus endpoints.
It acts as the central nervous system for our alerting rules.
If the drift score for a critical feature exceeds a certain threshold, Prometheus triggers an alert.
You can read more about time-series databases on Wikipedia.
4. Grafana for Executive Sanity
Data scientists need deep dive notebooks.
But product managers need simple dashboards.
Grafana allows us to build unified views of our model’s health.
We map API latency right next to prediction distribution drift.
When revenue drops, we can instantly see if a model degradation caused it.
Tying It All Together in Production
So, how do you wire this up without creating a maintenance nightmare?
It comes down to containerization and infrastructure as code.
We package our models in Docker, deploy them via Kubernetes, and attach sidecar containers.
These sidecars handle the asynchronous logging, ensuring the main prediction thread never blocks.
I promised you candor, so let’s be real for a second.
Open-source isn’t “free.” It costs engineering hours.
You have to maintain the Helm charts, manage the upgrades, and secure the endpoints.
But the ROI is undeniable.
When you own the stack for Monitoring an ML Pipeline, you own your destiny.
You aren’t locked into a vendor’s roadmap or restrictive pricing tiers.
FAQ Section on Monitoring an ML Pipeline
What is the biggest mistake when Monitoring an ML Pipeline? Relying solely on software metrics (latency, error rates) instead of tracking statistical data drift and model accuracy.
How often should I retrain my models? Only when your monitoring stack tells you to. Scheduled retraining is inefficient; trigger retraining based on significant concept drift alerts.
Can I use ELK stack for ML monitoring? Yes, Elasticsearch/Kibana works for log aggregation, but you still need specialized libraries to calculate statistical drift before sending that data to ELK.
Is Prometheus strictly for DevOps? Not anymore. Exposing ML-specific metrics (like prediction confidence intervals) to Prometheus is now an MLOps best practice.
Conclusion: Stop flying blind. Monitoring an ML Pipeline is not an optional afterthought; it is the core of sustainable AI. By leveraging tools like evidently, Prometheus, and Grafana, you can build an enterprise-grade safety net for a fraction of the cost. Start logging your predictions today, because silent model failure is the most expensive technical debt you can carry.
Would you like me to generate an automated script that deploys this exact Grafana/Prometheus MLOps stack via Docker Compose? Thank you for reading the DevopsRoles page!
The era of Large Language Models (LLMs) is transforming industries, but moving these powerful models from research to production presents significant operational challenges. DeepSeek-R1, a cutting-edge model renowned for its reasoning and coding capabilities, is a prime example. While incredibly powerful, its size and computational demands require a robust, scalable, and resilient infrastructure. This is where orchestrating a DeepSeek-R1 Kubernetes deployment becomes not just an option, but a strategic necessity for any serious MLOps team. This guide will walk you through the entire process, from setting up your GPU-enabled cluster to serving inference requests at scale.
Why Kubernetes for LLM Deployment?
Deploying a massive model like DeepSeek-R1 on a single virtual machine is fraught with peril. It lacks scalability, fault tolerance, and efficient resource utilization. Kubernetes, the de facto standard for container orchestration, directly addresses these challenges, making it the ideal platform for production-grade LLM inference.
Scalability: Kubernetes allows you to scale your model inference endpoints horizontally by simply increasing the replica count of your pods. With tools like the Horizontal Pod Autoscaler (HPA), this process can be automated based on metrics like GPU utilization or request latency.
High Availability: By distributing pods across multiple nodes, Kubernetes ensures that your model remains available even if a node fails. Its self-healing capabilities will automatically reschedule failed pods, providing a resilient service.
Resource Management: Kubernetes provides fine-grained control over resource allocation. You can explicitly request specific resources, like NVIDIA GPUs, ensuring your LLM workloads get the dedicated hardware they need to perform optimally.
Ecosystem and Portability: The vast Cloud Native Computing Foundation (CNCF) ecosystem provides tools for every aspect of the deployment lifecycle, from monitoring (Prometheus) and logging (Fluentd) to service mesh (Istio). This creates a standardized, cloud-agnostic environment for your MLOps workflows.
Prerequisites for Deploying DeepSeek-R1 on Kubernetes
Before you can deploy the model, you need to prepare your Kubernetes cluster. This setup is critical for handling the demanding nature of GPU workloads on Kubernetes.
1. A Running Kubernetes Cluster
You need access to a Kubernetes cluster. This can be a managed service from a cloud provider like Google Kubernetes Engine (GKE), Amazon Elastic Kubernetes Service (EKS), or Azure Kubernetes Service (AKS). Alternatively, you can use an on-premise cluster. The key requirement is that you have nodes equipped with powerful NVIDIA GPUs.
2. GPU-Enabled Nodes
DeepSeek-R1 requires significant GPU memory and compute power. Nodes with NVIDIA A100, H100, or L40S GPUs are ideal. Ensure your cluster’s node pool consists of these machines. You can verify that your nodes are recognized by Kubernetes and see their GPU capacity:
kubectl get nodes "-o=custom-columns=NAME:.metadata.name,GPU-CAPACITY:.status.capacity.nvidia\.com/gpu"
If the `GPU-CAPACITY` column is empty or shows `0`, you need to install the necessary drivers and device plugins.
3. NVIDIA GPU Operator
The easiest way to manage NVIDIA GPU drivers, the container runtime, and related components within Kubernetes is by using the NVIDIA GPU Operator. It uses the operator pattern to automate the management of all NVIDIA software components needed to provision GPUs.
After installation, the operator will automatically install drivers on your GPU nodes, making them available for pods to request.
4. Kubectl and Helm Installed
Ensure you have `kubectl` (the Kubernetes command-line tool) and `Helm` (the Kubernetes package manager) installed and configured to communicate with your cluster.
Choosing a Model Serving Framework
You can’t just run a Python script in a container to serve an LLM in production. You need a specialized serving framework optimized for high-throughput, low-latency inference. These frameworks handle complex tasks like request batching, memory management with paged attention, and optimized GPU kernel execution.
vLLM: An open-source library from UC Berkeley, vLLM is incredibly popular for its high performance. It introduces PagedAttention, an algorithm that efficiently manages the GPU memory required for attention keys and values, significantly boosting throughput. It also provides an OpenAI-compatible API server out of the box.
Text Generation Inference (TGI): Developed by Hugging Face, TGI is another production-ready toolkit for deploying LLMs. It’s highly optimized and widely used, offering features like continuous batching and quantized inference.
For this guide, we will use vLLM due to its excellent performance and ease of use for deploying a wide range of models.
Step-by-Step Guide: Deploying DeepSeek-R1 with vLLM on Kubernetes
Now we get to the core of the deployment. We will create a Kubernetes Deployment to manage our model server pods and a Service to expose them within the cluster.
Step 1: Understanding the vLLM Container
We don’t need to build a custom Docker image. The vLLM project provides a pre-built Docker image that can download and serve any model from the Hugging Face Hub. We will use the `vllm/vllm-openai:latest` image, which includes the OpenAI-compatible API server.
We will configure the model to be served by passing command-line arguments to the container. The key arguments are:
--model deepseek-ai/deepseek-r1: Specifies the model to download and serve.
--tensor-parallel-size N: The number of GPUs to use for tensor parallelism. This should match the number of GPUs requested by the pod.
--host 0.0.0.0: Binds the server to all network interfaces inside the container.
Step 2: Crafting the Kubernetes Deployment YAML
The Deployment manifest is the blueprint for our application. It defines the container image, resource requirements, replica count, and other configurations. Save the following content as `deepseek-deployment.yaml`.
apiVersion: apps/v1
kind: Deployment
metadata:
  name: deepseek-r1-deployment
  labels:
    app: deepseek-r1
spec:
  replicas: 1 # Start with 1 and scale later
  selector:
    matchLabels:
      app: deepseek-r1
  template:
    metadata:
      labels:
        app: deepseek-r1
    spec:
      containers:
      - name: vllm-container
        image: vllm/vllm-openai:latest
        args: [
            "--model", "deepseek-ai/deepseek-r1",
            "--tensor-parallel-size", "1", # Adjust based on number of GPUs
            "--host", "0.0.0.0"
        ]
        ports:
        - containerPort: 8000
        resources:
          limits:
            nvidia.com/gpu: 1 # Request 1 GPU
          requests:
            nvidia.com/gpu: 1 # Request 1 GPU
        volumeMounts:
        - mountPath: /root/.cache/huggingface
          name: model-cache-volume
      volumes:
      - name: model-cache-volume
        emptyDir: {} # For simplicity; use a PersistentVolume in production
Key points in this manifest:
spec.replicas: 1: We are starting with a single pod running the model.
image: vllm/vllm-openai:latest: The official vLLM image.
args: This is where we tell vLLM which model to run.
resources.limits: This is the most critical part for GPU workloads. nvidia.com/gpu: 1 tells the Kubernetes scheduler to find a node with at least one available NVIDIA GPU and assign it to this pod.
volumeMounts and volumes: We use an emptyDir volume to cache the downloaded model. This means the model will be re-downloaded if the pod is recreated. For faster startup times in production, you should use a `PersistentVolume` with a `ReadWriteMany` access mode.
Step 3: Creating the Kubernetes Service
A Deployment alone isn’t enough. We need a stable network endpoint to send requests to the pods. A Kubernetes Service provides this. It load-balances traffic across all pods managed by the Deployment.
Save the following as `deepseek-service.yaml`:
apiVersion: v1
kind: Service
metadata:
  name: deepseek-r1-service
spec:
  selector:
    app: deepseek-r1
  ports:
    - protocol: TCP
      port: 80
      targetPort: 8000
  type: ClusterIP # Exposes the service only within the cluster
This creates a `ClusterIP` service named `deepseek-r1-service`. Other applications inside the cluster can now reach our model at `http://deepseek-r1-service`.
Step 4: Applying the Manifests and Verifying the Deployment
Now, apply these configuration files to your cluster:
Check the status of your deployment. It may take several minutes for the pod to start, especially the first time, as it needs to pull the container image and download the large DeepSeek-R1 model.
# Check pod status (should eventually be 'Running')
kubectl get pods -l app=deepseek-r1

# Watch the logs to monitor the model download and server startup
kubectl logs -f -l app=deepseek-r1
Once you see a message in the logs indicating the server is running (e.g., “Uvicorn running on http://0.0.0.0:8000”), your model is ready to serve requests.
Testing the Deployed Model
Since we used the `vllm/vllm-openai` image, the server exposes an API that is compatible with the OpenAI Chat Completions API. This makes it incredibly easy to integrate with existing tools.
To test it from within the cluster, you can launch a temporary pod and use `curl`:
kubectl run -it --rm --image=curlimages/curl:latest temp-curl -- sh
Once inside the temporary pod’s shell, send a request to your service:
curl http://deepseek-r1-service/v1/chat/completions \
  -H "Content-Type: application/json" \
  -d '{
    "model": "deepseek-ai/deepseek-r1",
    "messages": [
      {"role": "system", "content": "You are a helpful assistant."},
      {"role": "user", "content": "What is the purpose of a Kubernetes Deployment?"}
    ]
  }'
You should receive a JSON response from the model with its answer, confirming your DeepSeek-R1 Kubernetes deployment is working correctly!
Advanced Considerations and Best Practices
Getting a single replica running is just the beginning. A production-ready MLOps setup requires more.
Model Caching: Use a `PersistentVolume` (backed by a fast network storage like NFS or a cloud provider’s file store) to cache the model weights. This dramatically reduces pod startup time after the initial download.
Autoscaling: Use the Horizontal Pod Autoscaler (HPA) to automatically scale the number of replicas based on CPU or memory. For more advanced GPU-based scaling, consider KEDA (Kubernetes Event-driven Autoscaling), which can scale based on metrics scraped from Prometheus, like GPU utilization.
Monitoring: Deploy Prometheus and Grafana to monitor your cluster. Use the DCGM Exporter (part of the GPU Operator) to get detailed GPU metrics (utilization, memory usage, temperature) into Prometheus. This is essential for understanding performance and cost.
Ingress: To expose your service to the outside world securely, use an Ingress controller (like NGINX or Traefik) along with an Ingress resource to handle external traffic, TLS termination, and routing.
Frequently Asked Questions
What are the minimum GPU requirements for DeepSeek-R1?
DeepSeek-R1 is a very large model. You will need a high-end data center GPU with at least 48GB of VRAM, such as an NVIDIA A100 (80GB) or H100, to run it effectively, even for inference. Always check the model card on Hugging Face for the latest requirements.
Can I use a different model serving framework?
Absolutely. While this guide uses vLLM, you can adapt the Deployment manifest to use other frameworks like Text Generation Inference (TGI), TensorRT-LLM, or OpenLLM. The core concepts of requesting GPU resources and using a Service remain the same.
How do I handle model updates or versioning?
Kubernetes Deployments support rolling updates. To update to a new model version, you can change the `–model` argument in your Deployment YAML. When you apply the new manifest, Kubernetes will perform a rolling update, gradually replacing old pods with new ones, ensuring zero downtime.
Is it cost-effective to run LLMs on Kubernetes?
While GPU instances are expensive, Kubernetes can improve cost-effectiveness through efficient resource utilization. By packing multiple workloads onto shared nodes and using autoscaling to match capacity with demand, you can avoid paying for idle resources, which is a common issue with statically provisioned VMs.
Conclusion
You have successfully navigated the process of deploying a state-of-the-art language model on a production-grade orchestration platform. By combining the power of DeepSeek-R1 with the scalability and resilience of Kubernetes, you unlock the ability to build and serve sophisticated AI applications that can handle real-world demand. The journey from a simple configuration to a fully automated, observable, and scalable system is the essence of MLOps. This DeepSeek-R1 Kubernetes deployment serves as a robust foundation, empowering you to innovate and build the next generation of AI-driven services. Thank you for reading the DevopsRoles page!
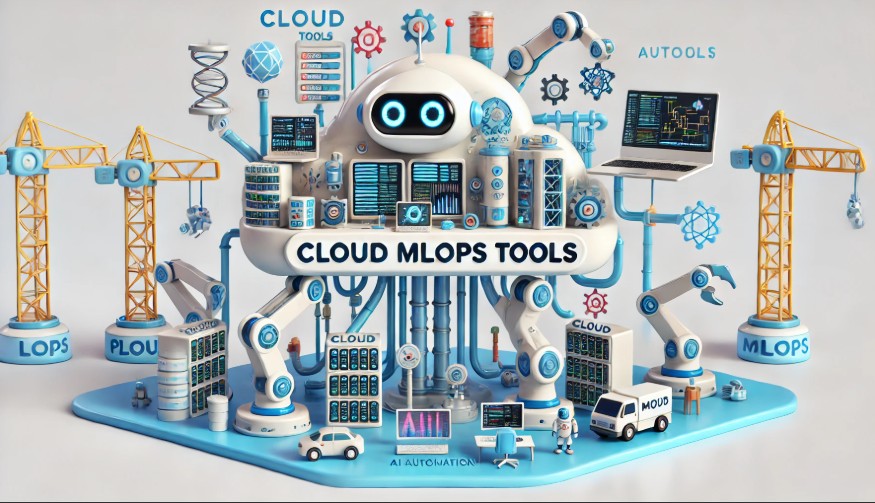
Machine Learning Operations (MLOps) is a critical discipline for deploying and managing machine learning (ML) models at scale. With the increasing demand for AI-driven applications, businesses are turning to Cloud MLOps tools to streamline the lifecycle of ML models, from development to production. These tools help automate tasks, enhance collaboration, and ensure model reliability.
In this comprehensive guide, we’ll explore the best Cloud MLOps tools, their features, benefits, and real-world applications.
What Are Cloud MLOps Tools?
Understanding MLOps in the Cloud
Cloud MLOps tools integrate DevOps principles into the ML pipeline, enabling data scientists and engineers to:
Automate model training and deployment.
Monitor and manage ML models in production.
Improve reproducibility and collaboration.
Scale ML solutions efficiently across cloud infrastructure.
These tools leverage cloud computing power, reducing infrastructure management overhead while ensuring scalability and cost-efficiency.
Top Cloud MLOps Tools
1. Amazon SageMaker
Amazon SageMaker provides a complete suite of services for building, training, and deploying ML models at scale.
Key Features:
AutoML for easy model training.
Built-in Jupyter notebooks.
Real-time and batch inference.
Model monitoring and drift detection.
2. Google Vertex AI
Google’s Vertex AI is a unified MLOps platform that simplifies the end-to-end ML workflow.
Key Features:
Unified AI pipeline for training and deploying models.
Custom and AutoML capabilities.
Model monitoring and metadata tracking.
Seamless integration with BigQuery and TensorFlow.
3. Microsoft Azure Machine Learning
Azure ML offers robust MLOps capabilities, making it a popular choice among enterprises.
Key Features:
Drag-and-drop ML designer.
ML pipelines for automation.
ML model monitoring and lineage tracking.
Integrated security and compliance features.
4. Databricks MLOps
Databricks provides a collaborative workspace for ML teams, combining Apache Spark with MLOps best practices.
Key Features:
Managed MLflow integration.
Collaborative notebooks for data scientists.
Automated tracking and version control.
Scalable computing with Delta Lake.
5. Kubeflow
Kubeflow is an open-source Kubernetes-based platform for deploying ML workflows.
Key Features:
Containerized ML model deployment.
Scalable, cloud-agnostic architecture.
TensorFlow Extended (TFX) integration.
End-to-end pipeline management.
How to Choose the Right Cloud MLOps Tool
Factors to Consider:
Scalability – Can the tool handle increasing data volumes?
Ease of Use – Does it offer low-code or no-code options?
Integration – Can it integrate with existing cloud and DevOps tools?
Cost – Is the pricing model budget-friendly?
Security & Compliance – Does it meet regulatory requirements?
Implementing Cloud MLOps: Step-by-Step Guide
Step 1: Define ML Workflow
Identify business objectives.
Define data sources and preprocessing steps.
Step 2: Select MLOps Tool
Choose a tool based on scalability, cost, and ease of use.
Step 3: Develop and Train Models
Use AutoML or custom scripts for training.
Optimize hyperparameters and validate results.
Step 4: Deploy ML Models
Choose real-time or batch inference.
Utilize CI/CD pipelines for automation.
Step 5: Monitor and Maintain
Set up drift detection.
Continuously retrain models based on new data.
Cloud MLOps Tools in Action: Real-World Examples
Example 1: Automating Fraud Detection
A financial institution leverages Google Vertex AI to automate fraud detection in transactions, reducing false positives by 40%.
Example 2: AI-Powered Healthcare Diagnostics
A hospital uses Amazon SageMaker to train and deploy deep learning models for radiology imaging analysis.
Example 3: Personalized E-commerce Recommendations
An online retailer integrates Azure Machine Learning to build a recommendation system, increasing conversion rates by 30%.
FAQ Section
1. What are the benefits of using Cloud MLOps tools?
Cloud MLOps tools provide scalability, automation, cost-efficiency, and improved model monitoring.
2. Which Cloud MLOps tool is best for beginners?
Google Vertex AI and Amazon SageMaker offer user-friendly AutoML features, making them ideal for beginners.
3. Can Cloud MLOps tools be used for deep learning?
Yes, tools like Azure ML, SageMaker, and Databricks support deep learning models with GPU acceleration.
4. How do I monitor ML models in production?
Use built-in monitoring features in Cloud MLOps tools, such as drift detection, logging, and performance tracking.
5. What is the difference between MLOps and DevOps?
MLOps focuses on automating the ML lifecycle, whereas DevOps is centered on software development and deployment.
Cloud MLOps tools are transforming the way businesses deploy, monitor, and scale machine learning models. By leveraging platforms like Amazon SageMaker, Google Vertex AI, Azure ML, Databricks, and Kubeflow, organizations can streamline their AI workflows and achieve higher operational efficiency.
Whether you’re a beginner or an enterprise looking to optimize ML operations, choosing the right Cloud MLOps tool will help you unlock AI’s full potential.
Ready to integrate MLOps into your workflow? Explore the tools mentioned and start optimizing your AI processes today! Thank you for reading the DevopsRoles page!
Machine Learning Operations, or MLOps, is a critical aspect of integrating machine learning models into production. As organizations increasingly adopt machine learning, choosing the right MLOps tools has become essential for enabling seamless deployment, monitoring, and maintenance. The MLOps landscape offers a plethora of tools, each with unique capabilities, making it challenging for teams to decide on the best option. This guide explores how to choose MLOps tools that align with your team’s specific needs, ensuring efficient workflows, reliable model deployment, and robust data management.
Key Factors in Choosing the Right Best MLOps Tools
When evaluating MLOps tools, it’s crucial to assess various aspects, from your team’s technical expertise to the types of models you’ll manage. Here are the main factors to consider:
1. Team Expertise and Skill Level
Technical Proficiency: Does your team include data engineers, DevOps professionals, or data scientists? Choose tools that align with their skill levels.
Learning Curve: Some MLOps platforms require advanced technical skills, while others provide user-friendly interfaces for teams with minimal coding experience.
2. Workflow Compatibility
Current Infrastructure: Ensure the tool integrates well with your existing infrastructure, whether cloud-based, on-premise, or hybrid.
Pipeline Orchestration: Look for tools that support your workflow, from data ingestion and transformation to model deployment and monitoring.
3. Model Lifecycle Management
Version Control: Track versions of data, code, and models to maintain reproducibility.
Deployment Options: Evaluate how models are deployed and how easily they can be updated.
Monitoring and Metrics: Choose tools that offer robust monitoring for model performance, allowing you to track metrics, detect drift, and retrain as needed.
4. Cost and Scalability
Pricing Structure: Some tools charge by the number of models, users, or data processed. Make sure the tool fits your budget and scales with your team’s needs.
Resource Requirements: Ensure the tool can handle your workload, whether you’re managing small-scale experiments or large production systems.
5. Security and Compliance
Data Governance: Check for features like role-based access control (RBAC), data encryption, and audit logging to maintain data security.
Compliance Requirements: Choose tools that meet regulatory standards, especially if you’re working with sensitive data (e.g., GDPR or HIPAA).
Popular MLOps Tools and Their Unique Features
Different MLOps tools offer unique functionalities, so understanding their core features can help you make informed decisions. Here’s a breakdown of popular MLOps platforms:
1. MLflow
Features: MLflow is an open-source platform that offers tracking, project management, and deployment capabilities.
Pros: Flexibility with various tools, robust version control, and open-source community support.
Cons: Requires technical expertise and may lack some automation features for deployment.
2. Kubeflow
Features: An MLOps platform based on Kubernetes, Kubeflow provides scalable model training and deployment.
Pros: Ideal for teams already using Kubernetes, highly scalable.
Cons: Has a steep learning curve and may require significant Kubernetes knowledge.
3. DataRobot
Features: DataRobot automates much of the ML workflow, including data preprocessing, training, and deployment.
Pros: User-friendly with extensive automation, suitable for business-focused teams.
Cons: Pricing can be prohibitive, and customization options may be limited.
4. Seldon
Features: A deployment-focused platform, Seldon integrates well with Kubernetes to streamline model serving and monitoring.
Pros: Robust for model deployment and monitoring, with Kubernetes-native support.
Cons: Limited functionality beyond deployment, requiring integration with other tools for end-to-end MLOps.
Steps to Select the Right MLOps Tool for Your Team
Step 1: Assess Your Current ML Workflow
Outline your ML workflow, identifying steps such as data preprocessing, model training, and deployment. This will help you see which tools fit naturally into your existing setup.
Step 2: Identify Must-Have Features
List essential features based on your requirements, like version control, monitoring, or specific deployment options. This will help you filter out tools that lack these capabilities.
Step 3: Evaluate Tool Compatibility with Existing Infrastructure
Consider whether you need a cloud-native, on-premise, or hybrid solution. For example:
Cloud-Native: Tools like Amazon SageMaker or Google AI Platform may be suitable.
On-Premise: Kubeflow or MLflow might be more appropriate if you need control over on-site data.
Step 4: Pilot Test Potential Tools
Select a shortlist of tools and run pilot tests to evaluate real-world compatibility, usability, and performance. For instance, test model tracking in MLflow or deployment with Seldon to understand how they fit into your pipeline.
Step 5: Analyze Long-Term Costs and Scalability
Calculate potential costs based on your model volume and future scalability needs. This helps in choosing a tool that supports both your current and projected workloads.
Step 6: Consider Security and Compliance
Review each tool’s security features to ensure compliance with data protection regulations. Prioritize tools with encryption, access control, and logging features if working with sensitive data.
Examples of Choosing MLOps Tools for Different Teams
Let’s examine how different types of teams might approach tool selection.
Example 1: Small Startup Team
Needs: User-friendly, cost-effective tools with minimal setup.
Recommended Tools: DataRobot for automated ML; MLflow for open-source flexibility.
Example 2: Enterprise Team with Kubernetes Expertise
Needs: Scalable deployment, monitoring, and integration with Kubernetes.
Recommended Tools: Kubeflow for seamless Kubernetes integration, Seldon for deployment.
Example 3: Data Science Team with Compliance Needs
Needs: Robust data governance and secure access control.
Recommended Tools: SageMaker or Azure Machine Learning, both offering extensive compliance support.
Frequently Asked Questions
1. What are the best MLOps tools for enterprises?
Large enterprises often benefit from tools that integrate with existing infrastructure and provide robust scalability. Some top choices include Kubeflow, MLflow, and Amazon SageMaker.
2. How can MLOps tools benefit smaller teams?
MLOps tools can automate repetitive tasks, improve model tracking, and streamline deployment, which is especially valuable for small teams without dedicated DevOps resources.
3. Is it necessary to use multiple MLOps tools?
Many organizations use a combination of tools to achieve end-to-end MLOps functionality. For example, MLflow for tracking and Seldon for deployment.
4. Can MLOps tools help with model monitoring?
Yes, many MLOps tools offer monitoring features. Seldon, for example, provides extensive model monitoring, while MLflow offers metrics tracking.
5. How do I ensure MLOps tools align with security standards?
Review each tool’s security features, such as encryption and role-based access, and choose those that comply with regulatory standards relevant to your industry.
Conclusion
Selecting the right MLOps tools for your team involves assessing your workflow, evaluating team expertise, and ensuring compatibility with your infrastructure. By following these steps, teams can choose tools that align with their specific needs, streamline model deployment, and ensure robust lifecycle management. Whether you’re a small team or a large enterprise, the right MLOps tools will empower you to efficiently manage, deploy, and monitor machine learning models, driving innovation and maintaining compliance in your AI projects. Thank you for reading the DevopsRoles page!
Machine learning operations (MLOps) have revolutionized the way data scientists, machine learning engineers, and DevOps teams collaborate to deploy, monitor, and manage machine learning (ML) models in production. With AI workflows becoming more intricate and demanding, MLOps tools have evolved to ensure seamless integration, robust automation, and enhanced collaboration across all stages of the ML lifecycle. In this guide, we’ll explore the top 10 MLOps tools to streamline your AI workflow, providing a comprehensive comparison of each to help you select the best tools for your needs.
Top 10 MLOps Tools to Streamline Your AI Workflow
Each of the tools below offers unique features that cater to different aspects of MLOps, from model training and versioning to deployment and monitoring.
1. Kubeflow
Overview: Kubeflow is an open-source MLOps platform that simplifies machine learning on Kubernetes. Designed to make scaling ML models easier, Kubeflow is favored by enterprises aiming for robust cloud-native workflows.
Key Features:
Model training and deployment with Kubernetes integration.
Native support for popular ML frameworks (e.g., TensorFlow, PyTorch).
Offers Kubeflow Pipelines for building and managing end-to-end ML workflows.
Use Case: Ideal for teams already familiar with Kubernetes looking to scale ML operations.
2. MLflow
Overview: MLflow is an open-source platform for managing the ML lifecycle. Its modular design allows teams to track experiments, package ML code into reproducible runs, and deploy models.
Key Features:
Supports tracking of experiments and logging of parameters, metrics, and artifacts.
Model versioning, packaging, and sharing capabilities.
Integrates with popular ML libraries, including Scikit-Learn and Spark MLlib.
Use Case: Great for teams focused on experiment tracking and reproducibility.
3. DVC (Data Version Control)
Overview: DVC is an open-source version control system for ML projects, facilitating data versioning, model storage, and reproducibility.
Key Features:
Version control for datasets and models.
Simple Git-like commands for managing data.
Integrates with CI/CD systems for ML pipelines.
Use Case: Suitable for projects with complex data dependencies and versioning needs.
4. TensorFlow Extended (TFX)
Overview: TFX is a production-ready, end-to-end ML platform for deploying and managing models using TensorFlow.
Key Features:
Seamless integration with TensorFlow, making it ideal for TensorFlow-based workflows.
Includes modules like TensorFlow Data Validation, Model Analysis, and Transform.
Supports Google Cloud’s AI Platform for scalability.
Use Case: Best for teams that already use TensorFlow and require an end-to-end ML platform.
5. Apache Airflow
Overview: Apache Airflow is a popular open-source tool for orchestrating complex workflows, including ML pipelines.
Key Features:
Schedule and manage ML workflows.
Integrate with cloud providers and on-premise systems.
Extensible with custom operators and plugins.
Use Case: Suitable for teams looking to automate and monitor workflows beyond ML tasks.
6. Weights & Biases (WandB)
Overview: Weights & Biases (WandB) is a platform that offers experiment tracking, model versioning, and hyperparameter optimization.
Key Features:
Track, visualize, and compare experiments in real-time.
Collaborative features for sharing insights.
API integrations with popular ML frameworks.
Use Case: Useful for research-oriented teams focused on extensive experimentation.
7. Pachyderm
Overview: Pachyderm is an open-source data engineering platform that combines version control with robust data pipeline capabilities.
Key Features:
Data versioning and lineage tracking.
Scalable pipeline execution on Kubernetes.
Integrates with major ML frameworks and tools.
Use Case: Ideal for projects with complex data workflows and version control requirements.
8. Azure Machine Learning
Overview: Azure ML is a cloud-based MLOps platform that provides an end-to-end suite for model development, training, deployment, and monitoring.
Key Features:
Integrates with Azure DevOps for CI/CD pipelines.
AutoML capabilities for accelerated model training.
In-built tools for monitoring and model explainability.
Use Case: Ideal for teams already invested in the Azure ecosystem.
9. Amazon SageMaker
Overview: Amazon SageMaker provides a complete set of MLOps tools within the AWS ecosystem, from model training to deployment and monitoring.
Key Features:
Automated data labeling, model training, and hyperparameter tuning.
Model deployment and management on AWS infrastructure.
Built-in monitoring for model drift and data quality.
Use Case: Suitable for businesses using AWS for their ML and AI workloads.
10. Neptune.ai
Overview: Neptune.ai is a lightweight experiment tracking tool for managing ML model experiments and hyperparameters.
Key Features:
Tracks experiments and stores metadata.
Collaborative and cloud-based for distributed teams.
Integrates with popular ML frameworks like Keras, TensorFlow, and PyTorch.
Use Case: Best for teams needing a dedicated tool for experiment tracking.
FAQ Section
What is MLOps?
MLOps, or Machine Learning Operations, is the practice of streamlining the development, deployment, and maintenance of machine learning models in production.
How do MLOps tools help in AI workflows?
MLOps tools offer functionalities like model training, experiment tracking, version control, and automated deployment, enabling efficient and scalable AI workflows.
Which MLOps tool is best for large-scale production?
Tools like Kubeflow, Amazon SageMaker, and Azure Machine Learning are preferred for large-scale, production-grade environments due to their cloud integration and scalability features.
Conclusion
The adoption of MLOps tools is essential for efficiently managing and scaling machine learning models in production. From open-source platforms like Kubeflow and MLflow to enterprise-grade solutions like Amazon SageMaker and Azure ML, the landscape of MLOps offers a wide range of tools tailored to different needs. When choosing the best MLOps tool for your team, consider your specific requirements-such as cloud integration, experiment tracking, model deployment, and scalability. With the right combination of tools, you can streamline your AI workflows and bring robust, scalable ML models into production seamlessly.
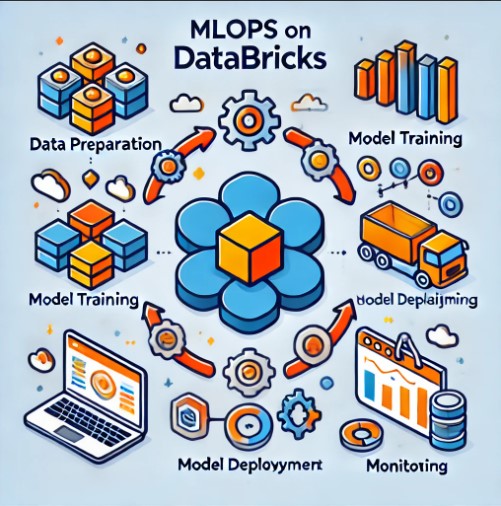
In the rapidly evolving landscape of data science, Machine Learning Operations (MLOps) has become crucial to managing, scaling, and automating machine learning workflows. Databricks, a unified data analytics platform, has emerged as a powerful tool for implementing MLOps, offering an integrated environment for data preparation, model training, deployment, and monitoring. This guide explores how to harness MLOps Databricks, covering fundamental concepts, practical examples, and advanced techniques to ensure scalable, reliable, and efficient machine learning operations.
What is MLOps?
MLOps, a blend of “Machine Learning” and “Operations,” is a set of best practices designed to bridge the gap between machine learning model development and production deployment. It incorporates tools, practices, and methodologies from DevOps, helping data scientists and engineers create, manage, and scale models in a collaborative and agile way. MLOps on Databricks, specifically, leverages the platform’s scalability, collaborative capabilities, and MLflow for effective model management and deployment.
Why Choose Databricks for MLOps?
Databricks offers several benefits that make it a suitable choice for implementing MLOps:
Scalability: Supports large-scale data processing and model training.
Collaboration: A shared workspace for data scientists, engineers, and stakeholders.
Integration with MLflow: Simplifies model tracking, experimentation, and deployment.
Automated Workflows: Enables pipeline automation to streamline ML workflows.
By choosing Databricks, organizations can simplify their ML workflows, ensure reproducibility, and bring models to production more efficiently.
Setting Up MLOps in Databricks
Step 1: Preparing the Databricks Environment
Before diving into MLOps on Databricks, set up your environment for optimal performance.
Provision a Cluster: Choose a cluster configuration that fits your data processing and ML model training needs.
Install ML Libraries: Databricks supports popular libraries such as TensorFlow, PyTorch, and Scikit-Learn. Install these on your cluster as needed.
Integrate with MLflow: MLflow is built into Databricks, allowing easy access to experiment tracking, model management, and deployment capabilities.
Step 2: Data Preparation
Data preparation is fundamental for building successful ML models. Databricks provides several tools for handling this efficiently:
ETL Pipelines: Use Databricks to create ETL (Extract, Transform, Load) pipelines for data processing and transformation.
Data Versioning: Track different versions of data to ensure model reproducibility.
Feature Engineering: Transform raw data into meaningful features for your model.
Building and Training Models on Databricks
Once data is prepared, the next step is model training. Databricks provides various methods for building models, from basic to advanced.
Basic Model Training
For beginners, starting with Scikit-Learn is a good choice for building basic models. Here’s a quick example:
from sklearn.model_selection import train_test_split
from sklearn.linear_model import LogisticRegression
from sklearn.metrics import accuracy_score

# Split data
X_train, X_test, y_train, y_test = train_test_split(data, labels, test_size=0.2)

# Train model
model = LogisticRegression()
model.fit(X_train, y_train)

# Evaluate model
accuracy = accuracy_score(y_test, model.predict(X_test))
print("Model Accuracy:", accuracy)
Advanced Model Training with Hyperparameter Tuning
Databricks integrates with Hyperopt, a Python library for hyperparameter tuning, to improve model performance.
This script finds the best C parameter for logistic regression by trying different values, automating the hyperparameter tuning process.
Model Deployment on Databricks
Deploying a model is essential for bringing machine learning insights to end users. Databricks facilitates both batch and real-time deployment methods.
Batch Inference
In batch inference, you process large batches of data at specific intervals. Here’s how to set up a batch inference pipeline on Databricks:
Register Model with MLflow: Save the trained model in MLflow to manage versions.
Create a Notebook Job: Schedule a job on Databricks to run batch inferences periodically.
Save Results: Store the results in a data lake or warehouse.
Real-Time Deployment with Databricks and MLflow
For real-time applications, you can deploy models as REST endpoints. Here’s a simplified outline:
Create a Databricks Job: Deploy the model as a Databricks job.
Set Up MLflow Model Serving: MLflow allows you to expose your model as an API endpoint.
Invoke the API: Send requests to the API for real-time predictions.
Monitoring and Managing Models
Model monitoring is a critical component of MLOps. It ensures the deployed model continues to perform well.
Monitoring with MLflow
MLflow can be used to track key metrics, detect drift, and log errors.
Track Metrics: Record metrics like accuracy, precision, and recall in MLflow to monitor model performance.
Drift Detection: Monitor model predictions over time to detect changes in data distribution.
Alerts and Notifications: Set up alerts to notify you of significant performance drops.
Retraining and Updating Models
When a model’s performance degrades, retraining is necessary. Databricks automates model retraining with scheduled jobs:
Schedule a Retraining Job: Use Databricks jobs to schedule periodic retraining.
Automate Model Replacement: Replace old models in production with retrained models using MLflow.
FAQ: MLOps on Databricks
What is MLOps on Databricks?
MLOps on Databricks involves using the Databricks platform for scalable, collaborative, and automated machine learning workflows, from data preparation to model monitoring and retraining.
Why is Databricks suitable for MLOps?
Databricks integrates with MLflow, offers scalable compute, and has built-in collaborative tools, making it a robust choice for MLOps.
How does MLflow enhance MLOps on Databricks?
MLflow simplifies experiment tracking, model management, and deployment, providing a streamlined workflow for managing ML models on Databricks.
Can I perform real-time inference on Databricks?
Yes, Databricks supports real-time inference by deploying models as API endpoints using MLflow’s Model Serving capabilities.
How do I monitor deployed models on Databricks?
MLflow on Databricks allows you to track metrics, detect drift, and set up alerts to monitor deployed models effectively.
Conclusion
Implementing MLOps on Databricks transforms how organizations handle machine learning models, providing a scalable and collaborative environment for data science teams. By leveraging tools like MLflow and Databricks jobs, businesses can streamline model deployment, monitor performance, and automate retraining to ensure consistent, high-quality predictions. As machine learning continues to evolve, adopting platforms like Databricks will help data-driven companies remain agile and competitive.
Machine learning has become a cornerstone of modern technology, driving innovation in fields ranging from healthcare to finance. Paiqo, a cutting-edge tool for machine learning workflows, has rapidly gained attention for its robust capabilities and user-friendly interface. Whether you are a beginner starting with simple algorithms or an advanced user implementing complex models, Paiqo offers a versatile platform to streamline your machine learning journey. In this article, we will explore everything you need to know about machine learning with Paiqo, from fundamental concepts to advanced techniques.
What is Paiqo?
Paiqo is a machine learning and AI platform designed to simplify the workflow for developing, training, and deploying models. Unlike many other machine learning platforms, Paiqo focuses on providing an end-to-end solution, allowing users to move from model development to deployment seamlessly. It is particularly well-suited for users who want to focus more on model accuracy and performance rather than the underlying infrastructure.
Getting Started with Machine Learning on Paiqo
Key Features of Paiqo
Paiqo offers several key features that make it a popular choice for machine learning:
Automated Machine Learning (AutoML) – Allows you to automatically select, train, and tune models.
Intuitive User Interface – Provides a clean and easy-to-navigate interface suitable for beginners.
Scalability – Supports high-performance models and large datasets.
Integration with Popular Libraries – Compatible with libraries like TensorFlow, Keras, and PyTorch.
Cloud and On-Premise Options – Offers flexibility for deployment.
Setting Up Your Paiqo Account
To get started, you will need a Paiqo account. Follow these steps:
Choose a Plan – Paiqo offers different pricing plans depending on your needs.
Download Necessary SDKs – For code-based projects, download Paiqo’s SDK and set it up in your local environment.
Building Your First Machine Learning Model with Paiqo
Step 1: Data Collection and Preprocessing
Data preprocessing is essential for model accuracy. Paiqo supports data import from various sources, including CSV files, SQL databases, and even APIs.
Common Data Preprocessing Techniques
Normalization and Scaling – Ensure all data features have similar scales.
Handling Missing Values – Replace missing values with the mean, median, or a placeholder.
Encoding Categorical Data – Convert categories into numerical values using techniques like one-hot encoding.
Paiqo’s AutoML can help select the best algorithm based on your dataset. Some common algorithms include:
Linear Regression – Suitable for continuous data prediction.
Decision Trees – Useful for classification tasks.
Neural Networks – Best for complex, non-linear data.
Step 3: Model Training
After selecting an algorithm, you can train your model on Paiqo. The platform provides a range of hyperparameters that can be optimized using its in-built tools. Paiqo’s cloud infrastructure enables faster training, especially for models that require substantial computational power.
Advanced Machine Learning Techniques on Paiqo
Hyperparameter Tuning
Paiqo’s AutoML allows you to conduct hyperparameter tuning without manually adjusting each parameter. This helps optimize your model’s performance by finding the best parameter settings for your dataset.
Ensemble Learning
Paiqo also supports ensemble learning techniques, which combine multiple models to improve predictive performance. Common ensemble methods include:
Bagging – Uses multiple versions of a model to reduce variance.
Boosting – Sequentially trains models to correct errors in previous iterations.
Deep Learning on Paiqo
Deep learning is increasingly popular for tasks such as image recognition and natural language processing. Paiqo supports popular deep learning frameworks, allowing you to build neural networks from scratch or use pre-trained models.
Deployment and Monitoring with Paiqo
Once you have trained your model, it’s time to deploy it. Paiqo offers multiple deployment options, including cloud, edge, and on-premise deployments. Paiqo also provides monitoring tools to track model performance and detect drift in real-time, ensuring your model maintains its accuracy over time.
Deploying Models
Cloud Deployment – Ideal for large-scale applications that require scalability.
Edge Deployment – Suitable for IoT devices and low-latency applications.
On-Premise Deployment – Best for organizations with specific security requirements.
Monitoring and Maintenance
Maintaining a machine learning model involves continuous monitoring to ensure that it performs well on new data. Paiqo offers automated alerts and model retraining options, allowing you to keep your model updated without much manual intervention.
Paiqo’s deep learning capabilities are particularly useful in healthcare, where models are used to identify patterns in medical imaging. With Paiqo, healthcare organizations can quickly deploy models for real-time diagnostics.
2. Financial Forecasting
Paiqo’s AutoML can assist in financial forecasting by identifying trends and patterns in large datasets. This is crucial for banking and investment sectors where predictive accuracy is critical.
3. E-commerce Recommendations
Paiqo’s ensemble learning techniques help e-commerce platforms provide personalized product recommendations by analyzing user behavior data.
FAQs
1. What is Paiqo used for in machine learning?
Paiqo is a platform that provides tools for developing, training, deploying, and monitoring machine learning models. It is suitable for both beginners and experts.
2. Can I use Paiqo for deep learning?
Yes, Paiqo supports deep learning frameworks such as TensorFlow and Keras, allowing you to build and deploy complex models.
3. Does Paiqo offer free plans?
Paiqo has a limited free plan, but it’s advisable to check their official website for the latest pricing options.
4. Is Paiqo suitable for beginners in machine learning?
Yes, Paiqo’s user-friendly interface and AutoML capabilities make it ideal for beginners.
5. How can I monitor deployed models on Paiqo?
Paiqo provides monitoring tools that help track model performance and detect any drift, ensuring optimal accuracy over time.
Conclusion
Machine learning is a rapidly evolving field, and platforms like Paiqo make it more accessible than ever before. With its range of features-from AutoML for beginners to advanced deep learning capabilities for experts-Paiqo is a versatile tool that meets the diverse needs of machine learning practitioners. Whether you are looking to deploy a simple model or handle complex, large-scale data projects, Paiqo provides a streamlined, efficient experience for every stage of the machine learning lifecycle.
For those interested in diving deeper into machine learning concepts and their applications, consider exploring Paiqo’s official documentation or enrolling in additional machine learning courses to enhance your understanding. Thank you for reading the DevopsRoles page!
In today’s world, Machine Learning (ML) is becoming an integral part of many businesses. As the adoption of ML increases, so does the complexity of managing ML workflows. This is where MLOps (Machine Learning Operations) comes into play, enabling organizations to deploy and manage their ML models efficiently.
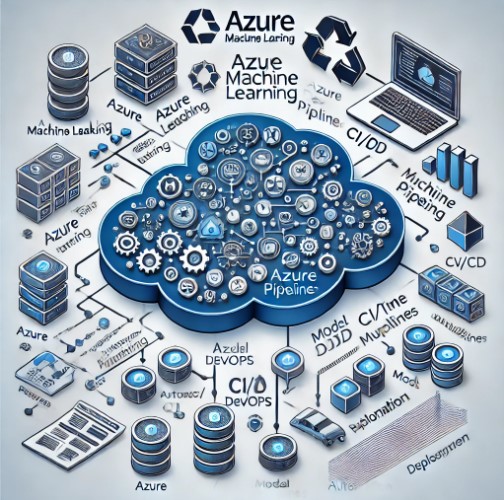
Azure MLOps, a service offered by Microsoft, helps simplify these workflows by leveraging Azure DevOps and various automation tools. Whether you’re new to MLOps or have been working with ML for years, Azure MLOps provides the tools needed to streamline model development, deployment, and monitoring.
In this guide, we’ll explore Azure MLOps in-depth, from basic setup to advanced examples of managing complex machine learning models in production environments.
What is MLOps?
MLOps is a combination of Machine Learning and DevOps principles, aiming to automate and manage the lifecycle of ML models from development to deployment and beyond. It encompasses practices that bring DevOps-like automation and management strategies to machine learning, ensuring that models can be deployed consistently, monitored effectively, and updated seamlessly.
Azure MLOps extends this concept by integrating with Azure Machine Learning and Azure DevOps, enabling data scientists and engineers to collaborate, build, test, and deploy models in a reproducible and scalable manner.
Benefits of Azure MLOps
Azure MLOps offers several key benefits, including:
Streamlined ML lifecycle management: From experimentation to deployment, all phases of the model lifecycle can be managed in a single environment.
Collaboration: Data scientists and DevOps engineers can work together in a unified environment.
Scalability: Easily scale ML models in production to handle large volumes of data.
Getting Started with Azure MLOps
Prerequisites
Before starting with Azure MLOps, ensure you have the following:
An Azure subscription.
Azure Machine Learning workspace set up.
Basic knowledge of Azure DevOps and CI/CD pipelines.
Step 1: Setting Up an Azure Machine Learning Workspace
To begin using Azure MLOps, you’ll first need an Azure Machine Learning workspace. The workspace acts as a central hub where your machine learning models, datasets, and experiments are stored.
Sign in to your Azure portal.
Navigate to “Create a resource” and search for “Machine Learning.”
Create a new Machine Learning workspace by following the on-screen instructions.
Step 2: Integrating Azure DevOps with Azure Machine Learning
Azure MLOps integrates seamlessly with Azure DevOps, allowing you to automate the ML model lifecycle. Here’s how you can integrate the two:
In the Azure portal, go to your Machine Learning workspace.
Under the “Automated ML” section, select “Azure DevOps integration.”
Connect your Azure DevOps account and repository.
Set up pipelines to automate your training, validation, and deployment processes.
Step 3: Configuring CI/CD Pipelines
MLOps emphasizes continuous integration and continuous deployment (CI/CD) pipelines. Setting up a CI/CD pipeline ensures that your machine learning model is automatically trained, tested, and deployed whenever there are changes to the code or data.
Continuous Integration (CI) focuses on automatically retraining models when new data or changes in code occur.
Continuous Deployment (CD) ensures that the latest version of the model is automatically deployed to production once it passes all tests.
Creating a CI Pipeline
In Azure DevOps, navigate to Pipelines.
Create a new pipeline and link it to your ML repository.
Define the steps for training the model in the YAML file. You can specify environments such as Docker or Kubernetes to ensure consistency across different environments.
Creating a CD Pipeline
Once the CI pipeline is in place, set up a release pipeline to automate model deployment.
In Azure DevOps, go to Releases.
Set up a new release pipeline and define environments for model testing and deployment (e.g., staging and production).
Use Azure Kubernetes Service (AKS) or Azure App Service to deploy the model as a web service.
Advanced Azure MLOps Use Cases
Use Case 1: Automated Model Retraining
One common challenge in machine learning is ensuring models remain up-to-date as new data comes in. With Azure MLOps, you can automate the retraining process using Azure DevOps pipelines.
Set up a data pipeline that triggers a retraining process whenever new data is added.
Use the CI pipeline to retrain and validate the updated model.
Deploy the retrained model using the CD pipeline.
Use Case 2: Monitoring and Model Drift Detection
Azure MLOps also allows you to monitor models in production and detect model drift—when a model’s performance degrades over time due to changes in the data distribution.
Implement Azure Application Insights to monitor the model’s performance in real time.
Set up alerts for key metrics like accuracy or precision.
Use Azure Machine Learning’s drift detection capabilities to automatically flag and retrain models that are no longer performing optimally.
Use Case 3: A/B Testing and Model Versioning
Azure MLOps supports A/B testing, allowing you to test different versions of a model before fully deploying the best-performing one.
Deploy multiple versions of your model using Azure Kubernetes Service (AKS).
Use Azure’s Model Management capabilities to track performance metrics across different versions.
Choose the best model based on your A/B testing results.
Best Practices for Implementing Azure MLOps
Version Control Everything: Keep your data, code, and models under version control using Git.
Automate Model Training: Use CI pipelines to automatically retrain models whenever there are changes in data or code.
Use Containerization: Utilize Docker containers to ensure your environment is consistent across development, testing, and production stages.
Monitor Models in Production: Always monitor your deployed models for performance and retrain when necessary.
Keep Data Privacy in Mind: Ensure that sensitive data is handled in compliance with data privacy regulations like GDPR.
FAQ
What is the difference between MLOps and DevOps?
While DevOps focuses on the automation and management of software development lifecycles, MLOps extends these principles to machine learning models, emphasizing the unique challenges of deploying and managing ML systems, such as model drift, retraining, and data dependencies.
Is Azure DevOps required for Azure MLOps?
No, but Azure DevOps makes it easier to automate the CI/CD pipelines. You can also use other DevOps tools, such as GitHub Actions or Jenkins, to implement MLOps on Azure.
How can I monitor my models in Azure MLOps?
Azure Machine Learning provides tools like Application Insights and Azure Monitor to track the performance of your models in real time. You can also set up alerts for model drift or degradation in performance.
Can I use Azure MLOps for non-Azure environments?
Yes, Azure MLOps supports multi-cloud and hybrid-cloud environments. You can deploy models to non-Azure environments using Kubernetes or Docker.
Conclusion
Azure MLOps provides a comprehensive framework to manage the end-to-end lifecycle of machine learning models, from development to deployment and beyond. With its tight integration with Azure DevOps, you can automate workflows, monitor models, and ensure they are always up-to-date. Whether you’re starting with basic ML models or managing complex pipelines, Azure MLOps can scale to meet your needs.
For more information on MLOps best practices, you can refer to Microsoft’s official documentation on Azure MLOps.
By following the guidelines in this article, you can leverage Azure MLOps to streamline your machine learning operations, making them more efficient, scalable, and reliable. Thank you for reading the DevopsRoles page!
Machine Learning Operations, or MLOps, is a rapidly evolving field that bridges the gap between machine learning (ML) and IT operations. By integrating these two disciplines, MLOps ensures the efficient deployment, monitoring, and management of ML models in production environments. This article explores various real-world use cases and success stories of MLOps in Action, highlighting its significance and practical applications.
What is MLOps?
MLOps, short for Machine Learning Operations, is a set of practices that combines ML, DevOps, and data engineering to deploy and maintain ML systems in production reliably and efficiently. It aims to automate the end-to-end ML lifecycle from model development to deployment and monitoring, ensuring scalability, reproducibility, and continuous delivery of high-quality ML models.
The Importance of MLOps
Ensuring Model Reliability
MLOps ensures that ML models are reliable and perform consistently in production environments. By implementing automated testing, continuous integration, and continuous deployment (CI/CD) pipelines, MLOps helps in identifying and fixing issues quickly, thereby maintaining model accuracy and reliability.
Facilitating Collaboration
MLOps fosters collaboration between data scientists, ML engineers, and IT operations teams. This collaboration ensures that ML models are not only developed efficiently but also deployed and monitored effectively. It breaks down silos and promotes a culture of continuous improvement.
Enhancing Scalability
MLOps enables the scaling of ML models across various environments and platforms. By leveraging cloud infrastructure and containerization technologies like Docker and Kubernetes, MLOps ensures that models can handle increased workloads without compromising performance.
Real-World Use Cases of MLOps in Action
Healthcare: Predictive Analytics and Patient Care
In the healthcare industry, MLOps plays a crucial role in predictive analytics and patient care. Hospitals and clinics use ML models to predict patient outcomes, optimize treatment plans, and improve overall patient care. For instance, Mayo Clinic utilizes MLOps to deploy and monitor ML models that predict patient readmissions, enhancing their ability to provide proactive care.
Finance: Fraud Detection and Risk Management
Financial institutions leverage MLOps to enhance fraud detection and risk management. By deploying ML models that analyze transaction patterns and detect anomalies, banks can prevent fraudulent activities in real-time. JP Morgan Chase, for example, uses MLOps to continuously deploy and monitor their fraud detection models, ensuring the security of their financial transactions.
Retail: Personalized Recommendations and Inventory Management
Retail companies use MLOps to provide personalized recommendations to customers and optimize inventory management. Amazon employs MLOps to deploy ML models that analyze customer behavior and preferences, offering tailored product recommendations. Additionally, these models help in managing inventory levels by predicting demand and reducing stockouts.
Manufacturing: Predictive Maintenance
In the manufacturing sector, MLOps is used for predictive maintenance. By deploying ML models that analyze equipment data, manufacturers can predict failures and schedule maintenance proactively, reducing downtime and maintenance costs. General Electric (GE) uses MLOps to deploy predictive maintenance models across their manufacturing units, improving operational efficiency.
Success Stories of MLOps Implementation
Google: Enhancing Search Algorithms
Google has been at the forefront of MLOps implementation. By continuously deploying and monitoring ML models, Google enhances its search algorithms, providing users with accurate and relevant search results. Their MLOps practices ensure that models are updated with the latest data, maintaining the quality of search results.
Netflix: Optimizing Content Recommendations
Netflix utilizes MLOps to optimize its content recommendation engine. By deploying ML models that analyze viewer preferences and behaviors, Netflix delivers personalized content recommendations to its users. Their MLOps practices ensure that these models are continuously updated and fine-tuned, enhancing user satisfaction and engagement.
Uber: Improving ETA Predictions
Uber employs MLOps to improve its Estimated Time of Arrival (ETA) predictions. By deploying ML models that analyze traffic patterns and driver behavior, Uber provides accurate ETA predictions to its users. Their MLOps practices ensure that these models are continuously monitored and updated, improving the accuracy of ETAs and user experience.
Frequently Asked Questions
What are the key components of MLOps?
The key components of MLOps include:
Data Engineering: Ensuring data quality and availability for ML models.
Model Development: Building and training ML models.
Model Deployment: Deploying models to production environments.
Monitoring and Maintenance: Continuously monitoring model performance and making necessary updates.
CI/CD Pipelines: Automating the integration and deployment of ML models.
How does MLOps differ from traditional DevOps?
While both MLOps and DevOps focus on automation and continuous delivery, MLOps specifically addresses the challenges of deploying and maintaining ML models. MLOps includes practices for data management, model training, and monitoring, which are not typically covered by traditional DevOps.
What tools are commonly used in MLOps?
Commonly used MLOps tools include:
Kubernetes: For container orchestration.
Docker: For containerization.
TensorFlow Extended (TFX): For end-to-end ML pipelines.
MLflow: For managing the ML lifecycle.
Kubeflow: For deploying and managing ML models on Kubernetes.
What are the challenges of implementing MLOps?
Challenges of implementing MLOps include:
Data Quality: Ensuring high-quality and consistent data for model training.
Model Drift: Addressing changes in model performance over time.
Scalability: Scaling ML models across different environments and platforms.
Collaboration: Facilitating collaboration between data scientists, ML engineers, and IT operations teams.
Conclusion
MLOps is transforming the way organizations deploy and manage ML models in production. By ensuring model reliability, facilitating collaboration, and enhancing scalability, MLOps enables businesses to leverage ML effectively. Real-world use cases in healthcare, finance, retail, and manufacturing demonstrate the practical applications and benefits of MLOps. Success stories from companies like Google, Netflix, and Uber highlight the impact of MLOps in optimizing various operations. As the field continues to evolve, MLOps will play an increasingly critical role in driving innovation and operational efficiency.
By understanding and implementing MLOps practices, organizations can unlock the full potential of their ML models, delivering value and competitive advantage in their respective industries.
This comprehensive guide on “MLOps in Action: Real-World Use Cases and Success Stories” has provided insights into the importance, real-world applications, and success stories of MLOps. By following best practices and leveraging the right tools, businesses can ensure the successful deployment and management of ML models, driving innovation and growth. Thank you for reading the DevopsRoles page!
In today’s fast-paced digital landscape, the ability to deploy machine learning models quickly and efficiently is crucial for staying competitive. MLOps, a set of practices that combines machine learning, DevOps, and data engineering, has emerged as a game-changer in this context. By automating and streamlining the deployment process, How MLOps can significantly enhance your model deployment process, ensuring that your models are reliable, reproducible, and scalable.
What is MLOps?
MLOps, short for Machine Learning Operations, refers to the practice of collaboration and communication between data scientists and operations teams to manage the machine learning lifecycle. This includes everything from data preparation to model deployment and monitoring. By integrating the principles of DevOps with machine learning, MLOps aims to automate and optimize the process of deploying and maintaining ML models in production.
Why is MLOps Important?
Ensures Consistency
Consistency is key in machine learning. MLOps ensures that models are deployed in a consistent manner across different environments. This reduces the risk of discrepancies and errors that can occur when models are manually deployed.
Enhances Collaboration
MLOps fosters better collaboration between data scientists and operations teams. By using common tools and practices, these teams can work together more effectively, leading to faster and more reliable deployments.
Automates Deployment
One of the main benefits of MLOps is automation. By automating the deployment process, MLOps reduces the time and effort required to get models into production. This allows data scientists to focus on developing better models rather than worrying about deployment issues.
Improves Monitoring and Maintenance
MLOps provides robust monitoring and maintenance capabilities. This ensures that models are performing as expected in production and allows for quick identification and resolution of any issues that may arise.
Key Components of MLOps
Continuous Integration and Continuous Deployment (CI/CD)
CI/CD pipelines are essential in MLOps. They automate the process of integrating code changes and deploying models to production. This ensures that new models are deployed quickly and consistently.
Model Versioning
Model versioning is a critical component of MLOps. It allows teams to track different versions of a model and ensures that the correct version is deployed to production. This is especially important when models are frequently updated.
Monitoring and Logging
Monitoring and logging are essential for maintaining model performance in production. MLOps tools provide comprehensive monitoring and logging capabilities, allowing teams to track model performance and quickly identify any issues.
Automated Testing
Automated testing is another key component of MLOps. It ensures that models are thoroughly tested before they are deployed to production. This reduces the risk of errors and ensures that models are reliable and robust.
MLOps in Action: A Real-World Example
To understand how MLOps can enhance your model deployment process, let’s look at a real-world example.
Case Study: Retail Sales Prediction
A retail company wants to deploy a machine learning model to predict sales. The company has a team of data scientists who develop the model and an operations team responsible for deploying it to production.
Without MLOps
Data Preparation: Data scientists manually prepare the data.
Model Development: Data scientists develop the model and save it locally.
Model Deployment: The operations team manually deploys the model to production.
Monitoring: The operations team manually monitors the model’s performance.
This manual process is time-consuming and prone to errors. Any changes to the model require repeating the entire process, leading to inconsistencies and delays.
With MLOps
Data Preparation: Data is automatically prepared using predefined pipelines.
Model Development: Data scientists develop the model and use version control to track changes.
Model Deployment: The model is automatically deployed to production using CI/CD pipelines.
Monitoring: The model’s performance is automatically monitored, and alerts are generated for any issues.
By automating the deployment process, MLOps ensures that models are deployed quickly and consistently, reducing the risk of errors and improving overall efficiency.
Implementing MLOps: Best Practices
Start with a Clear Strategy
Before implementing MLOps, it’s important to have a clear strategy in place. This should include defining the goals and objectives of your MLOps implementation, as well as identifying the key stakeholders and their roles.
Choose the Right Tools
There are many tools available for implementing MLOps, including open-source tools and commercial solutions. It’s important to choose the right tools that meet your specific needs and requirements.
Automate Where Possible
Automation is a key principle of MLOps. By automating repetitive tasks, you can reduce the time and effort required to deploy models and ensure that they are deployed consistently and reliably.
Foster Collaboration
Collaboration is essential for successful MLOps implementation. Encourage communication and collaboration between data scientists, operations teams, and other stakeholders to ensure that everyone is working towards the same goals.
FAQs
What is the main goal of MLOps?
The main goal of MLOps is to streamline and automate the process of deploying and maintaining machine learning models in production, ensuring consistency, reliability, and scalability.
How does MLOps differ from DevOps?
While both MLOps and DevOps aim to automate and optimize processes, MLOps focuses specifically on the machine learning lifecycle, including data preparation, model development, deployment, and monitoring.
Can MLOps be implemented in any organization?
Yes, MLOps can be implemented in any organization that uses machine learning. However, the specific implementation will depend on the organization’s needs and requirements.
What are some common tools used in MLOps?
Common tools used in MLOps include MLflow, Kubeflow, TFX, and DataRobot. These tools provide various capabilities for managing the machine learning lifecycle, including version control, automated testing, and monitoring.
Is MLOps only for large organizations?
No, MLOps can be beneficial for organizations of all sizes. Small and medium-sized organizations can also benefit from the automation and optimization provided by MLOps.
Conclusion
MLOps is a powerful practice that can significantly enhance your model deployment process. By automating and streamlining the deployment process, MLOps ensures that your models are reliable, reproducible, and scalable. Whether you’re just getting started with machine learning or looking to optimize your existing processes, implementing MLOps can help you achieve your goals more efficiently and effectively. Thank you for reading the DevopsRoles page!