In the era of Log4Shell and SolarWinds, the mandate for engineering leaders is clear: security cannot be a gatekeeper at the end of the release cycle; it must be the pavement on which the pipeline runs. Developing secure software at an enterprise scale requires more than just scanning code—it demands a comprehensive orchestration of the software supply chain.
For organizations leveraging the Docker ecosystem, the challenge is twofold: ensuring the base images are immutable and trusted, and ensuring the application artifacts injected into those images are free from malicious dependencies. This is where the synergy between Docker’s containerization standards and Sonatype’s Nexus platform (Lifecycle and Repository) becomes critical.
This guide moves beyond basic setup instructions. We will explore architectural strategies for integrating Sonatype Nexus IQ with Docker registries, implementing policy-as-code in CI/CD, and managing the noise of vulnerability reporting to maintain high-velocity deployments.
The Supply Chain Paradigm: Beyond Simple Scanning
To succeed in developing secure software, we must acknowledge that modern applications are 80-90% open-source components. The “code” your developers write is often just glue logic binding third-party libraries together. Therefore, the security posture of your Docker container is directly inherited from the upstream supply chain.
Enterprise strategies must align with frameworks like the NIST Secure Software Development Framework (SSDF) and SLSA (Supply-chain Levels for Software Artifacts). The goal is not just to find bugs, but to establish provenance and governance.
Pro-Tip for Architects: Don’t just scan build artifacts. Implement a “Nexus Firewall” at the proxy level. If a developer requests a library with a CVSS score of 9.8, the proxy should block the download entirely, preventing the vulnerability from ever entering your ecosystem. This is “Shift Left” in its purest form.
Architecture: Integrating Nexus IQ with Docker Registries
At scale, you cannot rely on developers manually running CLI scans. Integration must be seamless. A robust architecture typically involves three layers of defense using Sonatype Nexus and Docker.
1. The Proxy Layer (Ingestion)
Configure Nexus Repository Manager (NXRM) as a proxy for Docker Hub. All `docker pull` requests should go through NXRM. This allows you to cache images (improving build speeds) and, more importantly, inspect them.
2. The Build Layer (CI Integration)
This is where the Nexus IQ Server comes into play. During the build, the CI server (Jenkins, GitLab CI, GitHub Actions) generates an SBOM (Software Bill of Materials) of the application and sends it to Nexus IQ for policy evaluation.
3. The Registry Layer (Continuous Monitoring)
Even if an image is safe today, it might be vulnerable tomorrow (Zero-Day). Nexus Lifecycle offers “Continuous Monitoring” for artifacts stored in the repository, alerting you to new CVEs in old images without requiring a rebuild.
Policy-as-Code: Enforcement in CI/CD
Developing secure software effectively means automating decision-making. Policies should be defined in Nexus IQ (e.g., “No Critical CVEs in Production App”) and enforced by the pipeline.
Below is a production-grade Jenkinsfile snippet demonstrating how to enforce a blocking policy using the Nexus Platform Plugin. Note the use of failBuildOnNetworkError to ensure fail-safe behavior.
pipeline {
    agent any
    stages {
        stage('Build & Package') {
            steps {
                sh 'mvn clean package -DskipTests' // Create the artifact
                sh 'docker build -t my-app:latest .' // Build the container
            }
        }
        stage('Sonatype Policy Evaluation') {
            steps {
                script {
                    // Evaluate the application JARs and the Docker Image
                    nexusPolicyEvaluation failBuildOnNetworkError: true,
                                          iqApplication: 'payment-service-v2',
                                          iqStage: 'build',
                                          iqScanPatterns: [[pattern: 'target/*.jar'], [pattern: 'Dockerfile']]
                }
            }
        }
        stage('Push to Registry') {
            steps {
                // Only executes if Policy Evaluation passes
                sh 'docker push private-repo.corp.com/my-app:latest'
            }
        }
    }
}
By scanning the Dockerfile and the application binaries simultaneously, you catch OS-level vulnerabilities (e.g., glibc issues in the base image) and Application-level vulnerabilities (e.g., log4j in the Java classpath).
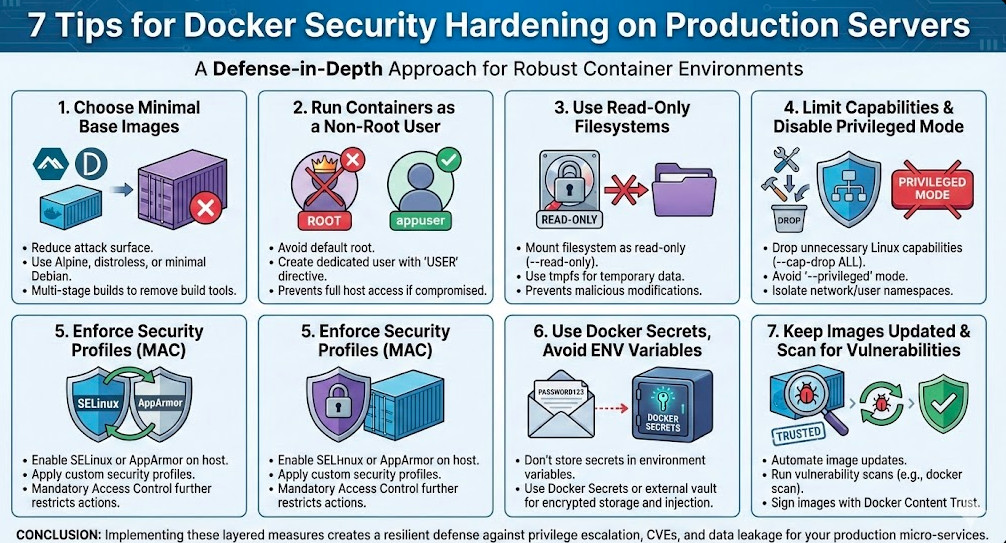
Optimizing Docker Builds for Security
While Sonatype handles the governance, the way you construct your Docker images fundamentally impacts your risk profile. Expert teams minimize the attack surface using Multi-Stage Builds and Distroless images.
This approach removes build tools (Maven, GCC, Gradle) and shells from the final runtime image, making it significantly harder for attackers to achieve persistence or lateral movement.
Secure Dockerfile Pattern
# Stage 1: The Build Environment
FROM maven:3.8.6-eclipse-temurin-17 AS builder
WORKDIR /app
COPY pom.xml .
COPY src ./src
RUN mvn package -DskipTests

# Stage 2: The Runtime Environment
# Using Google's Distroless image for Java 17
# No shell, no package manager, minimal CVE footprint
FROM gcr.io/distroless/java17-debian11
COPY --from=builder /app/target/my-app.jar /app/my-app.jar
WORKDIR /app
CMD ["my-app.jar"]
Pro-Tip: When scanning distroless images or stripped binaries, standard scanners often fail because they rely on package managers (like
aptorapk) to list installed software. Sonatype’s “Advanced Binary Fingerprinting” is superior here as it identifies components based on hash signatures rather than package manifests.
Scaling Operations: Automated Waivers & API Magic
The biggest friction point in developing secure software is the “False Positive” or the “Unfixable Vulnerability.” If you block builds for a vulnerability that has no patch available, developers will revolt.
To handle this at scale, you must utilize the Nexus IQ Server API. You can script logic that automatically grants temporary waivers for vulnerabilities that meet specific criteria (e.g., “Vendor status: Will Not Fix” AND “CVSS < 7.0”).
Here is a conceptual example of how to interact with the API to manage waivers programmatically:
# Pseudo-code for automating waivers via Nexus IQ API
import requests

IQ_SERVER = "https://iq.corp.local"
APP_ID = "payment-service-v2"
AUTH = ('admin', 'password123')

def apply_waiver(violation_id, reason):
    endpoint = f"{IQ_SERVER}/api/v2/policyViolations/{violation_id}/waiver"
    payload = {
        "comment": reason,
        "expiryTime": "2025-12-31T23:59:59.999Z" # Waiver expires in future
    }
    response = requests.post(endpoint, json=payload, auth=AUTH)
    if response.status_code == 200:
        print(f"Waiver applied for {violation_id}")

# Logic: If vulnerability is effectively 'noise', auto-waive it
# This prevents the pipeline from breaking on non-actionable items
Frequently Asked Questions (FAQ)
How does Sonatype IQ differ from ‘docker scan’?
docker scan (often powered by Snyk) is excellent for ad-hoc developer checks. Sonatype IQ is an enterprise governance platform. It provides centralized policy management, legal compliance (license checking), and deep binary fingerprinting that persists across the entire SDLC, not just the local machine.
What is the performance impact of scanning in CI/CD?
A full binary scan can take time. To optimize, ensure your Nexus IQ Server is co-located (network-wise) with your CI runners. Additionally, utilize the “Proprietary Code” settings in Nexus to exclude your internal JARs/DLLs from being fingerprinted against the public Central Repository, which speeds up analysis significantly.
How do we handle “InnerSource” components?
Large enterprises often reuse internal libraries. You should publish these to a hosted repository in Nexus. By configuring your policies correctly, you can ensure that consuming applications verify the version age and quality of these internal components, applying the same rigor to internal code as you do to open source.

Conclusion
Developing secure software using Docker and Sonatype at scale is not an endpoint; it is a continuous operational practice. It requires shifting from a reactive “patching” mindset to a proactive “supply chain management” mindset.
By integrating Nexus Firewall to block bad components at the door, enforcing Policy-as-Code in your CI/CD pipelines, and utilizing minimal Docker base images, you create a defense-in-depth strategy. This allows your organization to innovate at the speed of Docker, with the assurance and governance required by the enterprise.
Next Step: Audit your current CI pipeline. If you are running scans but not blocking builds on critical policy violations, you are gathering data, not securing software. Switch your Nexus action from “Warn” to “Fail” for CVSS 9+ vulnerabilities today. Thank you for reading the DevopsRoles page!