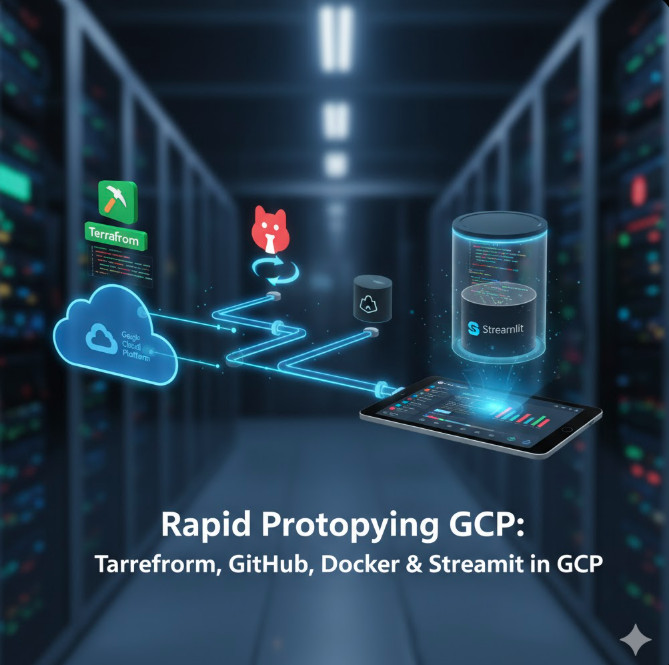
Tag Archives: DevOps

The 15 Best Docker Monitoring Tools for 2025: A Comprehensive Guide

Docker has revolutionized how applications are built, shipped, and run, enabling unprecedented agility and efficiency through containerization. However, managing and understanding the performance of dynamic, ephemeral containers in a production environment presents unique challenges. Without proper visibility, resource bottlenecks, application errors, and security vulnerabilities can go unnoticed, leading to performance degradation, increased operational costs, and potential downtime. This is where robust Docker monitoring tools become indispensable.

As organizations increasingly adopt microservices architectures and container orchestration platforms like Kubernetes, the complexity of their infrastructure grows. Traditional monitoring solutions often fall short in these highly dynamic and distributed environments. Modern Docker monitoring tools are specifically designed to provide deep insights into container health, resource utilization, application performance, and log data, helping DevOps teams, developers, and system administrators ensure the smooth operation of their containerized applications.

In this in-depth guide, we will explore why Docker monitoring is critical, what key features to look for in a monitoring solution, and present the 15 best Docker monitoring tools available in 2025. Whether you’re looking for an open-source solution, a comprehensive enterprise platform, or a specialized tool, this article will help you make an informed decision to optimize your containerized infrastructure.

Why Docker Monitoring is Critical for Modern DevOps

In the fast-paced world of DevOps, where continuous integration and continuous delivery (CI/CD) are paramount, understanding the behavior of your Docker containers is non-negotiable. Here’s why robust Docker monitoring is essential:

  • Visibility into Ephemeral Environments: Docker containers are designed to be immutable and can be spun up and down rapidly. Traditional monitoring struggles with this transient nature. Docker monitoring tools provide real-time visibility into these short-lived components, ensuring no critical events are missed.
  • Performance Optimization: Identifying CPU, memory, disk I/O, and network bottlenecks at the container level is crucial for optimizing application performance. Monitoring allows you to pinpoint resource hogs and allocate resources more efficiently.
  • Proactive Issue Detection: By tracking key metrics and logs, monitoring tools can detect anomalies and potential issues before they impact end-users. Alerts and notifications enable teams to respond proactively to prevent outages.
  • Resource Efficiency: Over-provisioning resources for containers can lead to unnecessary costs, while under-provisioning can lead to performance problems. Monitoring helps right-size resources, leading to significant cost savings and improved efficiency.
  • Troubleshooting and Debugging: When issues arise, comprehensive monitoring provides the data needed for quick root cause analysis. Aggregated logs, traces, and metrics from multiple containers and services simplify the debugging process.
  • Security and Compliance: Monitoring container activity, network traffic, and access patterns can help detect security threats and ensure compliance with regulatory requirements.
  • Capacity Planning: Historical data collected by monitoring tools is invaluable for understanding trends, predicting future resource needs, and making informed decisions about infrastructure scaling.

Key Features to Look for in Docker Monitoring Tools

Selecting the right Docker monitoring solution requires careful consideration of various features tailored to the unique demands of containerized environments. Here are the essential capabilities to prioritize:

  • Container-Level Metrics: Deep visibility into CPU utilization, memory consumption, disk I/O, network traffic, and process statistics for individual containers and hosts.
  • Log Aggregation and Analysis: Centralized collection, parsing, indexing, and searching of logs from all Docker containers. This includes structured logging support and anomaly detection in log patterns.
  • Distributed Tracing: Ability to trace requests across multiple services and containers, providing an end-to-end view of transaction flows in microservices architectures.
  • Alerting and Notifications: Customizable alert rules based on specific thresholds or anomaly detection, with integration into communication channels like Slack, PagerDuty, email, etc.
  • Customizable Dashboards and Visualization: Intuitive and flexible dashboards to visualize metrics, logs, and traces in real-time, allowing for quick insights and correlation.
  • Integration with Orchestration Platforms: Seamless integration with Kubernetes, Docker Swarm, and other orchestrators for cluster-level monitoring and auto-discovery of services.
  • Application Performance Monitoring (APM): Capabilities to monitor application-specific metrics, identify code-level bottlenecks, and track user experience within containers.
  • Host and Infrastructure Monitoring: Beyond containers, the tool should ideally monitor the underlying host infrastructure (VMs, physical servers) to provide a complete picture.
  • Service Maps and Dependency Mapping: Automatic discovery and visualization of service dependencies, helping to understand the architecture and impact of changes.
  • Scalability and Performance: The ability to scale with your growing container infrastructure without introducing significant overhead or latency.
  • Security Monitoring: Detection of suspicious container activity, network breaches, or policy violations.
  • Cost-Effectiveness: A balance between features, performance, and pricing models (SaaS, open-source, hybrid) that aligns with your budget and operational needs.

The 15 Best Docker Monitoring Tools for 2025

Choosing the right set of Docker monitoring tools is crucial for maintaining the health and performance of your containerized applications. Here’s an in-depth look at the top contenders for 2025:

1. Datadog

Datadog is a leading SaaS-based monitoring and analytics platform that offers full-stack observability for cloud-scale applications. It provides comprehensive monitoring for Docker containers, Kubernetes, serverless functions, and traditional infrastructure, consolidating metrics, traces, and logs into a unified view.

  • Key Features:
    • Real-time container metrics and host-level resource utilization.
    • Advanced log management and analytics with powerful search.
    • Distributed tracing for microservices with APM.
    • Customizable dashboards and service maps for visualizing dependencies.
    • AI-powered anomaly detection and robust alerting.
    • Out-of-the-box integrations with Docker, Kubernetes, AWS, Azure, GCP, and hundreds of other technologies.
  • Pros:
    • Extremely comprehensive and unified platform for all observability needs.
    • Excellent user experience, intuitive dashboards, and easy setup.
    • Strong community support and continuous feature development.
    • Scales well for large and complex environments.
  • Cons:
    • Can become expensive for high data volumes, especially logs and traces.
    • Feature richness can have a steep learning curve for new users.

External Link: Datadog Official Site

2. Prometheus & Grafana

Prometheus is a powerful open-source monitoring system that collects metrics from configured targets at given intervals, evaluates rule expressions, displays the results, and can trigger alerts. Grafana is an open-source data visualization and analytics tool that allows you to query, visualize, alert on, and explore metrics, logs, and traces from various sources, making it a perfect companion for Prometheus.

  • Key Features (Prometheus):
    • Multi-dimensional data model with time series data identified by metric name and key/value pairs.
    • Flexible query language (PromQL) for complex data analysis.
    • Service discovery for dynamic environments like Docker and Kubernetes.
    • Built-in alerting manager.
  • Key Features (Grafana):
    • Rich and interactive dashboards.
    • Support for multiple data sources (Prometheus, Elasticsearch, Loki, InfluxDB, etc.).
    • Alerting capabilities integrated with various notification channels.
    • Templating and variables for dynamic dashboards.
  • Pros:
    • Open-source and free, highly cost-effective for budget-conscious teams.
    • Extremely powerful and flexible for custom metric collection and visualization.
    • Large and active community support.
    • Excellent for self-hosting and full control over your monitoring stack.
  • Cons:
    • Requires significant effort to set up, configure, and maintain.
    • Limited long-term storage capabilities without external integrations.
    • No built-in logging or tracing (requires additional tools like Loki or Jaeger).

3. cAdvisor (Container Advisor)

cAdvisor is an open-source tool from Google that provides container users with an understanding of the resource usage and performance characteristics of their running containers. It collects, aggregates, processes, and exports information about running containers, exposing a web interface for basic visualization and a raw data endpoint.

  • Key Features:
    • Collects CPU, memory, network, and file system usage statistics.
    • Provides historical resource usage information.
    • Supports Docker containers natively.
    • Lightweight and easy to deploy.
  • Pros:
    • Free and open-source.
    • Excellent for basic, localized container monitoring on a single host.
    • Easy to integrate with Prometheus for metric collection.
  • Cons:
    • Lacks advanced features like log aggregation, tracing, or robust alerting.
    • Not designed for large-scale, distributed environments.
    • User interface is basic compared to full-fledged monitoring solutions.

4. New Relic

New Relic is another full-stack observability platform offering deep insights into application and infrastructure performance, including extensive support for Docker and Kubernetes. It combines APM, infrastructure monitoring, logs, browser, mobile, and synthetic monitoring into a single solution.

  • Key Features:
    • Comprehensive APM for applications running in Docker containers.
    • Detailed infrastructure monitoring for hosts and containers.
    • Full-stack distributed tracing and service maps.
    • Centralized log management and analytics.
    • AI-powered proactive anomaly detection and intelligent alerting.
    • Native integration with Docker and Kubernetes.
  • Pros:
    • Provides a holistic view of application health and performance.
    • Strong APM capabilities for identifying code-level issues.
    • User-friendly interface and powerful visualization tools.
    • Good for large enterprises requiring end-to-end visibility.
  • Cons:
    • Can be costly, especially with high data ingest volumes.
    • May have a learning curve due to the breadth of features.

External Link: New Relic Official Site

5. Sysdig Monitor

Sysdig Monitor is a container-native visibility platform that provides deep insights into the performance, health, and security of containerized applications and infrastructure. It’s built specifically for dynamic cloud-native environments and offers granular visibility at the process, container, and host level.

  • Key Features:
    • Deep container visibility with granular metrics.
    • Prometheus-compatible monitoring and custom metric collection.
    • Container-aware logging and auditing capabilities.
    • Interactive service maps and topology views.
    • Integrated security and forensics (Sysdig Secure).
    • Powerful alerting and troubleshooting features.
  • Pros:
    • Excellent for container-specific monitoring and security.
    • Provides unparalleled depth of visibility into container activity.
    • Strong focus on security and compliance in container environments.
    • Good for organizations prioritizing container security alongside performance.
  • Cons:
    • Can be more expensive than some other solutions.
    • Steeper learning curve for some advanced features.

6. Dynatrace

Dynatrace is an AI-powered, full-stack observability platform that provides automatic and intelligent monitoring for modern cloud environments, including Docker and Kubernetes. Its OneAgent technology automatically discovers, maps, and monitors all components of your application stack.

  • Key Features:
    • Automatic discovery and mapping of all services and dependencies.
    • AI-driven root cause analysis with Davis AI.
    • Full-stack monitoring: APM, infrastructure, logs, digital experience.
    • Code-level visibility for applications within containers.
    • Real-time container and host performance metrics.
    • Extensive Kubernetes and Docker support.
  • Pros:
    • Highly automated setup and intelligent problem detection.
    • Provides deep, code-level insights without manual configuration.
    • Excellent for complex, dynamic cloud-native environments.
    • Reduces mean time to resolution (MTTR) significantly.
  • Cons:
    • One of the more expensive enterprise solutions.
    • Resource footprint of the OneAgent might be a consideration for very small containers.

7. AppDynamics

AppDynamics, a Cisco company, is an enterprise-grade APM solution that extends its capabilities to Docker container monitoring. It provides deep visibility into application performance, user experience, and business transactions, linking them directly to the underlying infrastructure, including containers.

  • Key Features:
    • Business transaction monitoring across containerized services.
    • Code-level visibility into applications running in Docker.
    • Infrastructure visibility for Docker hosts and containers.
    • Automatic baselining and anomaly detection.
    • End-user experience monitoring.
    • Scalable for large enterprise deployments.
  • Pros:
    • Strong focus on business context and transaction tracing.
    • Excellent for large enterprises with complex application landscapes.
    • Helps connect IT performance directly to business outcomes.
    • Robust reporting and analytics features.
  • Cons:
    • High cost, typically suited for larger organizations.
    • Can be resource-intensive for agents.
    • Setup and configuration might be more complex than lightweight tools.

8. Elastic Stack (ELK – Elasticsearch, Logstash, Kibana)

The Elastic Stack, comprising Elasticsearch (search and analytics engine), Logstash (data collection and processing pipeline), and Kibana (data visualization), is a popular open-source solution for log management and analytics. It’s widely used for collecting, processing, storing, and visualizing Docker container logs.

  • Key Features:
    • Centralized log aggregation from Docker containers (via Filebeat or Logstash).
    • Powerful search and analytics capabilities with Elasticsearch.
    • Rich visualization and customizable dashboards with Kibana.
    • Can also collect metrics (via Metricbeat) and traces (via Elastic APM).
    • Scalable for large volumes of log data.
  • Pros:
    • Highly flexible and customizable for log management.
    • Open-source components offer cost savings.
    • Large community and extensive documentation.
    • Can be extended to full-stack observability with other Elastic components.
  • Cons:
    • Requires significant effort to set up, manage, and optimize the stack.
    • Steep learning curve for new users, especially for performance tuning.
    • Resource-intensive, particularly Elasticsearch.
    • No built-in distributed tracing without Elastic APM.

9. Splunk

Splunk is an enterprise-grade platform for operational intelligence, primarily known for its powerful log management and security information and event management (SIEM) capabilities. It can effectively ingest, index, and analyze data from Docker containers, hosts, and applications to provide real-time insights.

  • Key Features:
    • Massive-scale log aggregation, indexing, and search.
    • Real-time data correlation and anomaly detection.
    • Customizable dashboards and powerful reporting.
    • Can monitor Docker daemon logs, container logs, and host metrics.
    • Integrates with various data sources and offers a rich app ecosystem.
  • Pros:
    • Industry-leading for log analysis and operational intelligence.
    • Extremely powerful search language (SPL).
    • Excellent for security monitoring and compliance.
    • Scalable for petabytes of data.
  • Cons:
    • Very expensive, pricing based on data ingest volume.
    • Can be complex to configure and optimize.
    • More focused on logs and events rather than deep APM or tracing natively.

10. LogicMonitor

LogicMonitor is a SaaS-based performance monitoring platform for hybrid IT infrastructures, including extensive support for Docker, Kubernetes, and cloud environments. It provides automated discovery, comprehensive metric collection, and intelligent alerting across your entire stack.

  • Key Features:
    • Automated discovery and monitoring of Docker containers, hosts, and services.
    • Pre-built monitoring templates for Docker and associated technologies.
    • Comprehensive metrics (CPU, memory, disk, network, processes).
    • Intelligent alerting with dynamic thresholds and root cause analysis.
    • Customizable dashboards and reporting.
    • Monitors hybrid cloud and on-premises environments from a single platform.
  • Pros:
    • Easy to deploy and configure with automated discovery.
    • Provides a unified view for complex hybrid environments.
    • Strong alerting capabilities with reduced alert fatigue.
    • Good support for a wide range of technologies out-of-the-box.
  • Cons:
    • Can be more expensive than open-source or some smaller SaaS tools.
    • May lack the deep, code-level APM of specialized tools like Dynatrace.

11. Sematext

Sematext provides a suite of monitoring and logging products, including Sematext Monitoring (for infrastructure and APM) and Sematext Logs (for centralized log management). It offers comprehensive monitoring for Docker, Kubernetes, and microservices environments, focusing on ease of use and full-stack visibility.

  • Key Features:
    • Full-stack visibility for Docker containers, hosts, and applications.
    • Real-time container metrics, events, and logs.
    • Distributed tracing with Sematext Experience.
    • Anomaly detection and powerful alerting.
    • Pre-built dashboards and customizable views.
    • Support for Prometheus metric ingestion.
  • Pros:
    • Offers a good balance of features across logs, metrics, and traces.
    • Relatively easy to set up and use.
    • Cost-effective compared to some enterprise alternatives, with flexible pricing.
    • Good for small to medium-sized teams seeking full-stack observability.
  • Cons:
    • User interface can sometimes feel less polished than market leaders.
    • May not scale as massively as solutions like Splunk for petabyte-scale data.

12. Instana

Instana, an IBM company, is an automated enterprise observability platform designed for modern cloud-native applications and microservices. It automatically discovers, maps, and monitors all services and infrastructure components, providing real-time distributed tracing and AI-powered root cause analysis for Docker and Kubernetes environments.

  • Key Features:
    • Fully automated discovery and dependency mapping.
    • Real-time distributed tracing for every request.
    • AI-powered root cause analysis and contextual alerting.
    • Comprehensive metrics for Docker containers, Kubernetes, and underlying hosts.
    • Code-level visibility and APM.
    • Agent-based with minimal configuration.
  • Pros:
    • True automated observability with zero-config setup.
    • Exceptional for complex microservices architectures.
    • Provides immediate, actionable insights into problems.
    • Significantly reduces operational overhead and MTTR.
  • Cons:
    • Premium pricing reflecting its advanced automation and capabilities.
    • May be overkill for very simple container setups.

13. Site24x7

Site24x7 is an all-in-one monitoring solution from Zoho that covers websites, servers, networks, applications, and cloud resources. It offers extensive monitoring capabilities for Docker containers, providing insights into their performance and health alongside the rest of your IT infrastructure.

  • Key Features:
    • Docker container monitoring with key metrics (CPU, memory, network, disk I/O).
    • Docker host monitoring.
    • Automated discovery of containers and applications within them.
    • Log management for Docker containers.
    • Customizable dashboards and reporting.
    • Integrated alerting with various notification channels.
    • Unified monitoring for hybrid cloud environments.
  • Pros:
    • Comprehensive all-in-one platform for diverse monitoring needs.
    • Relatively easy to set up and use.
    • Cost-effective for businesses looking for a single monitoring vendor.
    • Good for monitoring entire IT stack, not just Docker.
  • Cons:
    • May not offer the same depth of container-native features as specialized tools.
    • UI can sometimes feel a bit cluttered due to the breadth of features.

14. Netdata

Netdata is an open-source, real-time performance monitoring solution that provides high-resolution metrics for systems, applications, and containers. It’s designed to be installed on every system (or container) you want to monitor, providing instant visualization and anomaly detection without requiring complex setup.

  • Key Features:
    • Real-time, per-second metric collection for Docker containers and hosts.
    • Interactive, zero-configuration dashboards.
    • Thousands of metrics collected out-of-the-box.
    • Anomaly detection and customizable alerts.
    • Low resource footprint.
    • Distributed monitoring capabilities with Netdata Cloud.
  • Pros:
    • Free and open-source with optional cloud services.
    • Incredibly easy to install and get started, providing instant insights.
    • Excellent for real-time troubleshooting and granular performance analysis.
    • Very low overhead, suitable for edge devices and resource-constrained environments.
  • Cons:
    • Designed for real-time, local monitoring; long-term historical storage requires external integration.
    • Lacks integrated log management and distributed tracing features.
    • Scalability for thousands of nodes might require careful planning and integration with other tools.

15. Prometheus + Grafana with Blackbox Exporter and Pushgateway

While Prometheus and Grafana were discussed earlier, this specific combination highlights their extended capabilities. Integrating the Blackbox Exporter allows for external service monitoring (e.g., checking if an HTTP endpoint inside a container is reachable and responsive), while Pushgateway enables short-lived jobs to expose metrics to Prometheus. This enhances the monitoring scope beyond basic internal metrics.

  • Key Features:
    • External endpoint monitoring (HTTP, HTTPS, TCP, ICMP) for containerized applications.
    • Metrics collection from ephemeral and batch jobs that don’t expose HTTP endpoints.
    • Comprehensive time-series data storage and querying.
    • Flexible dashboarding and visualization via Grafana.
    • Highly customizable alerting.
  • Pros:
    • Extends Prometheus’s pull-based model for broader monitoring scenarios.
    • Increases the observability of short-lived and externally exposed services.
    • Still entirely open-source and highly configurable.
    • Excellent for specific use cases where traditional Prometheus pull isn’t sufficient.
  • Cons:
    • Adds complexity to the Prometheus setup and maintenance.
    • Requires careful management of the Pushgateway for cleanup and data freshness.
    • Still requires additional components for logs and traces.

External Link: Prometheus Official Site

Frequently Asked Questions

What is Docker monitoring and why is it important?

Docker monitoring is the process of collecting, analyzing, and visualizing data (metrics, logs, traces) from Docker containers, hosts, and the applications running within them. It’s crucial for understanding container health, performance, resource utilization, and application behavior in dynamic, containerized environments, helping to prevent outages, optimize resources, and troubleshoot issues quickly.

What’s the difference between open-source and commercial Docker monitoring tools?

Open-source tools like Prometheus, Grafana, and cAdvisor are free to use and offer high flexibility and community support, but often require significant effort for setup, configuration, and maintenance. Commercial tools (e.g., Datadog, New Relic, Dynatrace) are typically SaaS-based, offer out-of-the-box comprehensive features, automated setup, dedicated support, and advanced AI-powered capabilities, but come with a recurring cost.

Can I monitor Docker containers with existing infrastructure monitoring tools?

While some traditional infrastructure monitoring tools might provide basic host-level metrics, they often lack the granular, container-aware insights needed for effective Docker monitoring. They may struggle with the ephemeral nature of containers, dynamic service discovery, and the specific metrics (like container-level CPU/memory limits and usage) that modern container monitoring tools provide. Specialized tools offer deeper integration with Docker and orchestrators like Kubernetes.

How do I choose the best Docker monitoring tool for my organization?

Consider your organization’s specific needs, budget, and existing infrastructure. Evaluate tools based on:

  1. Features: Do you need logs, metrics, traces, APM, security?
  2. Scalability: How many containers/hosts do you need to monitor now and in the future?
  3. Ease of Use: How much time and expertise can you dedicate to setup and maintenance?
  4. Integration: Does it integrate with your existing tech stack (Kubernetes, cloud providers, CI/CD)?
  5. Cost: Compare pricing models (open-source effort vs. SaaS subscription).
  6. Support: Is community or vendor support crucial for your team?

For small setups, open-source options are great. For complex, enterprise-grade needs, comprehensive SaaS platforms are often preferred.

Conclusion

The proliferation of Docker and containerization has undeniably transformed the landscape of software development and deployment. However, the benefits of agility and scalability come with the inherent complexity of managing highly dynamic, distributed environments. Robust Docker monitoring tools are no longer a luxury but a fundamental necessity for any organization leveraging containers in production.

The tools discussed in this guide – ranging from versatile open-source solutions like Prometheus and Grafana to comprehensive enterprise platforms like Datadog and Dynatrace – offer a spectrum of capabilities to address diverse monitoring needs. Whether you prioritize deep APM, granular log analysis, real-time metrics, or automated full-stack observability, there’s a tool tailored for your specific requirements.

Ultimately, the “best” Docker monitoring tool is one that aligns perfectly with your team’s expertise, budget, infrastructure complexity, and specific observability goals. We encourage you to evaluate several options, perhaps starting with a proof of concept, to determine which solution provides the most actionable insights and helps you maintain the health, performance, and security of your containerized applications efficiently. Thank you for reading the DevopsRoles page!

Mastering AWS Service Catalog with Terraform Cloud for Robust Cloud Governance

In today’s dynamic cloud landscape, organizations are constantly seeking ways to accelerate innovation while maintaining stringent governance, compliance, and cost control. As enterprises scale their adoption of AWS, the challenge of standardizing infrastructure provisioning, ensuring adherence to best practices, and empowering development teams with self-service capabilities becomes increasingly complex. This is where the synergy between AWS Service Catalog and Terraform Cloud shines, offering a powerful solution to streamline cloud resource deployment and enforce organizational policies.

This in-depth guide will explore how to master AWS Service Catalog integration with Terraform Cloud, providing you with the knowledge and practical steps to build a robust, governed, and automated cloud provisioning framework. We’ll delve into the core concepts, demonstrate practical implementation with code examples, and uncover advanced strategies to elevate your cloud infrastructure management.

Understanding AWS Service Catalog: The Foundation of Governed Self-Service

What is AWS Service Catalog?

AWS Service Catalog is a service that allows organizations to create and manage catalogs of IT services that are approved for use on AWS. These IT services can include everything from virtual machine images, servers, software, databases, and complete multi-tier application architectures. Service Catalog helps organizations achieve centralized governance and ensure compliance with corporate standards while enabling users to quickly deploy only the pre-approved IT services they need.

The primary problems AWS Service Catalog solves include:

  • Governance: Ensures that only approved AWS resources and architectures are provisioned.
  • Compliance: Helps meet regulatory and security requirements by enforcing specific configurations.
  • Self-Service: Empowers end-users (developers, data scientists) to provision resources without direct intervention from central IT.
  • Standardization: Promotes consistency in deployments across teams and projects.
  • Cost Control: Prevents the provisioning of unapproved, potentially costly resources.

Key Components of AWS Service Catalog

To effectively utilize AWS Service Catalog, it’s crucial to understand its core components:

  • Products: A product is an IT service that you want to make available to end-users. It can be a single EC2 instance, a configured RDS database, or a complex application stack. Products are defined by a template, typically an AWS CloudFormation template, but crucially for this article, they can also be defined by Terraform configurations.
  • Portfolios: A portfolio is a collection of products. It allows you to organize products, control access to them, and apply constraints to ensure proper usage. For example, you might have separate portfolios for “Development,” “Production,” or “Data Science” teams.
  • Constraints: Constraints define how end-users can deploy a product. They can be of several types:
    • Launch Constraints: Specify an IAM role that AWS Service Catalog assumes to launch the product. This decouples the end-user’s permissions from the permissions required to provision the resources, enabling least privilege.
    • Template Constraints: Apply additional rules or modifications to the underlying template during provisioning, ensuring compliance (e.g., specific instance types allowed).
    • TagOption Constraints: Automate the application of tags to provisioned resources, aiding in cost allocation and resource management.
  • Provisioned Products: An instance of a product that an end-user has launched.

Introduction to Terraform Cloud

What is Terraform Cloud?

Terraform Cloud is a managed service offered by HashiCorp that provides a collaborative platform for infrastructure as code (IaC) using Terraform. While open-source Terraform excels at provisioning and managing infrastructure, Terraform Cloud extends its capabilities with a suite of features designed for team collaboration, governance, and automation in production environments.

Key features of Terraform Cloud include:

  • Remote State Management: Securely stores and manages Terraform state files, preventing concurrency issues and accidental deletions.
  • Remote Operations: Executes Terraform runs remotely, reducing the need for local installations and ensuring consistent environments.
  • Version Control System (VCS) Integration: Automatically triggers Terraform runs on code changes in integrated VCS repositories (GitHub, GitLab, Bitbucket, Azure DevOps).
  • Team & Governance Features: Provides role-based access control (RBAC), policy as code (Sentinel), and cost estimation tools.
  • Private Module Registry: Allows organizations to share and reuse Terraform modules internally.
  • API-Driven Workflow: Enables programmatic interaction and integration with CI/CD pipelines.

Why Terraform for AWS Service Catalog?

Traditionally, AWS Service Catalog relied heavily on CloudFormation templates for defining products. While CloudFormation is powerful, Terraform offers several advantages that make it an excellent choice for defining AWS Service Catalog products, especially for organizations already invested in the Terraform ecosystem:

  • Multi-Cloud/Hybrid Cloud Consistency: Terraform’s provider model supports various cloud providers, allowing a consistent IaC approach across different environments if needed.
  • Mature Ecosystem: A vast community, rich module ecosystem, and strong tooling support.
  • Declarative and Idempotent: Ensures that your infrastructure configuration matches the desired state, making deployments predictable.
  • State Management: Terraform’s state file precisely maps real-world resources to your configuration.
  • Advanced Resource Management: Offers powerful features like `count`, `for_each`, and data sources that can simplify complex configurations.

Using Terraform Cloud further enhances this by providing a centralized, secure, and collaborative environment to manage these Terraform-defined Service Catalog products.

The Synergistic Benefits: AWS Service Catalog and Terraform Cloud

Combining AWS Service Catalog with Terraform Cloud creates a powerful synergy that addresses many challenges in modern cloud infrastructure management:

Enhanced Governance and Compliance

  • Policy as Code (Sentinel): Terraform Cloud’s Sentinel policies can enforce pre-provisioning checks, ensuring that proposed infrastructure changes comply with organizational security, cost, and operational standards before they are even submitted to Service Catalog.
  • Launch Constraints: Service Catalog’s launch constraints ensure that products are provisioned with specific, high-privileged IAM roles, while end-users only need permission to launch the product, adhering to the principle of least privilege.
  • Standardized Modules: Using private Terraform modules in Terraform Cloud ensures that all Service Catalog products are built upon approved, audited, and version-controlled infrastructure patterns.

Standardized Provisioning and Self-Service

  • Consistent Deployments: Terraform’s declarative nature, managed by Terraform Cloud, ensures that every time a user provisions a product, it’s deployed consistently according to the defined template.
  • Developer Empowerment: Developers and other end-users can provision their required infrastructure through a user-friendly Service Catalog interface, without needing deep AWS or Terraform expertise.
  • Version Control: Terraform Cloud’s VCS integration means that all infrastructure definitions are versioned, auditable, and easily revertible.

Accelerated Deployment and Reduced Operational Overhead

  • Automation: Automated Terraform runs via Terraform Cloud eliminate manual steps, speeding up the provisioning process.
  • Reduced Rework: Standardized products reduce the need for central IT to manually configure resources for individual teams.
  • Auditing and Transparency: Terraform Cloud provides detailed logs of all runs, and AWS Service Catalog tracks who launched which product, offering complete transparency.

Prerequisites and Setup

Before diving into implementation, ensure you have the following:

AWS Account Configuration

  • An active AWS account with administrative access for initial setup.
  • An IAM user or role with permissions to create and manage AWS Service Catalog resources (servicecatalog:*), IAM roles, S3 buckets, and any other resources your products will provision. It’s recommended to follow the principle of least privilege.

Terraform Cloud Workspace Setup

  • A Terraform Cloud account. You can sign up for a free tier.
  • An organization within Terraform Cloud.
  • A new workspace for your Service Catalog products. Connect this workspace to a VCS repository (e.g., GitHub) where your Terraform configurations will reside.
  • Configure AWS credentials in your Terraform Cloud workspace. This can be done via environment variables (e.g., AWS_ACCESS_KEY_ID, AWS_SECRET_ACCESS_KEY, AWS_SESSION_TOKEN) or by using AWS assumed roles directly within Terraform Cloud.

Example of setting environment variables in Terraform Cloud workspace:

  • Go to your workspace settings.
  • Navigate to “Environment Variables”.
  • Add AWS_ACCESS_KEY_ID and AWS_SECRET_ACCESS_KEY as sensitive variables.
  • Optionally, add AWS_REGION.

IAM Permissions for Service Catalog

You’ll need specific IAM permissions:

  1. For the Terraform User/Role: Permissions to create/manage Service Catalog resources, IAM roles, and the resources provisioned by your products.
  2. For the Service Catalog Launch Role: This is an IAM role that AWS Service Catalog assumes to provision resources. It needs permissions to create all resources defined in your product’s Terraform configuration. This role will be specified in the “Launch Constraint” for your portfolio.
  3. For the End-User: Permissions to access and provision products from the Service Catalog UI. Typically, this involves servicecatalog:List*, servicecatalog:Describe*, and servicecatalog:ProvisionProduct.

Step-by-Step Implementation: Creating a Simple Product

Let’s walk through creating a simple S3 bucket product in AWS Service Catalog using Terraform Cloud. This will involve defining the S3 bucket in Terraform, packaging it as a Service Catalog product, and making it available through a portfolio.

Defining the Product in Terraform (Example: S3 Bucket)

First, we’ll create a reusable Terraform module for our S3 bucket. This module will be the “product” that users can provision.

Terraform Module for S3 Bucket

Create a directory structure like this in your VCS repository:


my-service-catalog-products/
├── s3-bucket-product/
│   ├── main.tf
│   ├── variables.tf
│   └── outputs.tf
└── main.tf
└── versions.tf

my-service-catalog-products/s3-bucket-product/main.tf:


resource "aws_s3_bucket" "this" {
  bucket = var.bucket_name
  acl    = var.acl

  tags = merge(
    var.tags,
    {
      "ManagedBy" = "ServiceCatalog"
      "Product"   = "S3Bucket"
    }
  )
}

resource "aws_s3_bucket_public_access_block" "this" {
  bucket                  = aws_s3_bucket.this.id
  block_public_acls       = true
  block_public_policy     = true
  ignore_public_acls      = true
  restrict_public_buckets = true
}

output "bucket_id" {
  description = "The name of the S3 bucket."
  value       = aws_s3_bucket.this.id
}

output "bucket_arn" {
  description = "The ARN of the S3 bucket."
  value       = aws_s3_bucket.this.arn
}

my-service-catalog-products/s3-bucket-product/variables.tf:


variable "bucket_name" {
  description = "Desired name of the S3 bucket."
  type        = string
}

variable "acl" {
  description = "Canned ACL to apply to the S3 bucket. Private is recommended."
  type        = string
  default     = "private"
  validation {
    condition     = contains(["private", "public-read", "public-read-write", "aws-exec-read", "authenticated-read", "bucket-owner-read", "bucket-owner-full-control", "log-delivery-write"], var.acl)
    error_message = "Invalid ACL provided. Must be one of the AWS S3 canned ACLs."
  }
}

variable "tags" {
  description = "A map of tags to assign to the bucket."
  type        = map(string)
  default     = {}
}

Now, we need a root Terraform configuration that will define the Service Catalog product and portfolio. This will reside in the main directory.

my-service-catalog-products/versions.tf:


terraform {
  required_version = ">= 1.0.0"
  required_providers {
    aws = {
      source  = "hashicorp/aws"
      version = "~> 5.0"
    }
  }
  cloud {
    organization = "your-tfc-org-name" # Replace with your Terraform Cloud organization name
    workspaces {
      name = "service-catalog-products-workspace" # Replace with your Terraform Cloud workspace name
    }
  }
}

provider "aws" {
  region = "us-east-1" # Or your desired region
}

my-service-catalog-products/main.tf (This is where the Service Catalog resources will be defined):


# IAM Role for Service Catalog to launch products
resource "aws_iam_role" "servicecatalog_launch_role" {
  name = "ServiceCatalogLaunchRole"

  assume_role_policy = jsonencode({
    Version = "2012-10-17"
    Statement = [
      {
        Action = "sts:AssumeRole"
        Effect = "Allow"
        Principal = {
          Service = "servicecatalog.amazonaws.com"
        }
      },
      {
        Action = "sts:AssumeRole"
        Effect = "Allow"
        Principal = {
          AWS = data.aws_caller_identity.current.account_id # Allows current account to assume this role for testing
        }
      }
    ]
  })
}

resource "aws_iam_role_policy" "servicecatalog_launch_policy" {
  name = "ServiceCatalogLaunchPolicy"
  role = aws_iam_role.servicecatalog_launch_role.id

  policy = jsonencode({
    Version = "2012-10-17"
    Statement = [
      {
        Action   = ["s3:*", "iam:GetRole", "iam:PassRole"], # Grant necessary permissions for S3 product
        Effect   = "Allow",
        Resource = "*"
      },
      # Add other permissions as needed for more complex products
    ]
  })
}

data "aws_caller_identity" "current" {}

Creating an AWS Service Catalog Product in Terraform Cloud

Now, let’s define the AWS Service Catalog product using Terraform. This product will point to our S3 bucket module.

Add the following to my-service-catalog-products/main.tf:


resource "aws_servicecatalog_product" "s3_bucket_product" {
  name          = "Standard S3 Bucket"
  owner         = "IT Operations"
  type          = "CLOUD_FORMATION_TEMPLATE" # Service Catalog still requires this type, but it provisions Terraform-managed resources via CloudFormation
  description   = "Provisions a private S3 bucket with public access blocked."
  distributor   = "Cloud Engineering"
  support_email = "cloud-support@example.com"
  support_url   = "https://wiki.example.com/s3-bucket-product"

  provisioning_artifact_parameters {
    template_type = "TERRAFORM_OPEN_SOURCE" # This is the crucial part for Terraform
    name          = "v1.0"
    description   = "Initial version of the S3 Bucket product."
    # The INFO property defines how Service Catalog interacts with Terraform Cloud
    info = {
      "CloudFormationTemplate" = jsonencode({
        AWSTemplateFormatVersion = "2010-09-09"
        Description              = "AWS Service Catalog product for a Standard S3 Bucket (managed by Terraform Cloud)"
        Parameters = {
          BucketName = {
            Type        = "String"
            Description = "Desired name for the S3 bucket (must be globally unique)."
          }
          BucketAcl = {
            Type        = "String"
            Description = "Canned ACL to apply to the S3 bucket. (e.g., private, public-read)"
            Default     = "private"
          }
          TagsJson = {
            Type        = "String"
            Description = "JSON string of tags for the S3 bucket (e.g., {\"Project\":\"MyProject\"})"
            Default     = "{}"
          }
        }
        Resources = {
          TerraformProvisioner = {
            Type       = "Community::Terraform::TFEProduct" # This is a placeholder type. In reality, you'd use a custom resource for TFC integration
            Properties = {
              WorkspaceId = "ws-xxxxxxxxxxxxxxxxx" # Placeholder: You would dynamically get this or embed it from TFC API
              BucketName  = { "Ref" : "BucketName" }
              BucketAcl   = { "Ref" : "BucketAcl" }
              TagsJson    = { "Ref" : "TagsJson" }
              # ... other Terraform variables passed as parameters
            }
          }
        }
        Outputs = {
          BucketId = {
            Description = "The name of the provisioned S3 bucket."
            Value       = { "Fn::GetAtt" : ["TerraformProvisioner", "BucketId"] }
          }
          BucketArn = {
            Description = "The ARN of the provisioned S3 bucket."
            Value       = { "Fn::GetAtt" : ["TerraformProvisioner", "BucketArn"] }
          }
        }
      })
    }
  }
}

Important Note on `Community::Terraform::TFEProduct` and `info` property:

The above code snippet for `aws_servicecatalog_product` illustrates the *concept* of how Service Catalog interacts with Terraform. In a real-world scenario, the `info` property’s `CloudFormationTemplate` would point to an AWS CloudFormation template that contains a Custom Resource (e.g., using Lambda) or a direct integration that calls the Terraform Cloud API to perform the `terraform apply`. AWS provides official documentation and reference architectures for integrating with Terraform Open Source which also applies to Terraform Cloud via its API. This typically involves:

  1. A CloudFormation template that defines the parameters.
  2. A Lambda function that receives these parameters, interacts with the Terraform Cloud API (e.g., by creating a new run for a specific workspace, passing variables), and reports back the status to CloudFormation.

For simplicity and clarity of the core Terraform Cloud integration, the provided `info` block above uses a conceptual `Community::Terraform::TFEProduct` type. In a full implementation, you would replace this with the actual CloudFormation template that invokes your Terraform Cloud workspace via an intermediary Lambda function.

Creating an AWS Service Catalog Portfolio

Next, define a portfolio to hold our S3 product.

Add the following to my-service-catalog-products/main.tf:


resource "aws_servicecatalog_portfolio" "dev_portfolio" {
  name          = "Dev Team Portfolio"
  description   = "Products approved for Development teams"
  provider_name = "Cloud Engineering"
}

Associating Product with Portfolio

Link the product to the portfolio.

Add the following to my-service-catalog-products/main.tf:


resource "aws_servicecatalog_portfolio_product_association" "s3_product_assoc" {
  portfolio_id = aws_servicecatalog_portfolio.dev_portfolio.id
  product_id   = aws_servicecatalog_product.s3_bucket_product.id
}

Granting Launch Permissions

This is critical for security. We’ll use a Launch Constraint to specify the IAM role AWS Service Catalog will assume to provision the S3 bucket.

Add the following to my-service-catalog-products/main.tf:


resource "aws_servicecatalog_service_action" "s3_provision_action" {
  name        = "Provision S3 Bucket"
  description = "Action to provision a standard S3 bucket."
  definition {
    name = "TerraformRun" # This should correspond to a TFC run action
    # The actual definition here would involve a custom action that
    # triggers a Terraform Cloud run or an equivalent mechanism.
    # For a fully managed setup, this would be part of the Custom Resource logic.
    # For now, we'll keep it simple and assume the Lambda-backed CFN handles it.
  }
}

resource "aws_servicecatalog_constraint" "s3_launch_constraint" {
  description          = "Launch constraint for S3 Bucket product"
  portfolio_id         = aws_servicecatalog_portfolio.dev_portfolio.id
  product_id           = aws_servicecatalog_product.s3_bucket_product.id
  type                 = "LAUNCH"
  parameters           = jsonencode({
    RoleArn = aws_iam_role.servicecatalog_launch_role.arn
  })
}

# Grant end-user access to the portfolio
resource "aws_servicecatalog_portfolio_share" "dev_portfolio_share" {
  portfolio_id = aws_servicecatalog_portfolio.dev_portfolio.id
  account_id   = data.aws_caller_identity.current.account_id # Share with the same account for testing
  # Optionally, you can add an OrganizationNode for sharing across AWS Organizations
}

# Example of an IAM role for an end-user to access the portfolio and launch products
resource "aws_iam_role" "end_user_role" {
  name = "ServiceCatalogEndUserRole"
  assume_role_policy = jsonencode({
    Version = "2012-10-17"
    Statement = [
      {
        Action = "sts:AssumeRole"
        Effect = "Allow"
        Principal = {
          AWS = data.aws_caller_identity.current.account_id
        }
      }
    ]
  })
}

resource "aws_iam_role_policy_attachment" "end_user_sc_access" {
  role       = aws_iam_role.end_user_role.name
  policy_arn = "arn:aws:iam::aws:policy/AWSServiceCatalogEndUserFullAccess" # Use full access for demo, restrict in production
}

Commit these Terraform files to your VCS repository. Terraform Cloud, configured with the correct workspace and VCS integration, will detect the changes and initiate a plan. Once approved and applied, your AWS Service Catalog will be populated with the defined product and portfolio.

When an end-user navigates to the AWS Service Catalog console, they will see the “Dev Team Portfolio” and the “Standard S3 Bucket” product. When they provision it, the Service Catalog will trigger the underlying CloudFormation stack, which in turn calls Terraform Cloud (via the custom resource/Lambda function) to execute the Terraform configuration defined in your S3 module, provisioning the S3 bucket.

Advanced Scenarios and Best Practices

Versioning Products

Infrastructure evolves. AWS Service Catalog and Terraform Cloud handle this gracefully:

  • Terraform Cloud Modules: Maintain different versions of your Terraform modules in a private module registry or by tagging your Git repository.
  • Service Catalog Provisioning Artifacts: When your Terraform module changes, create a new provisioning artifact (e.g., v2.0) for your AWS Service Catalog product. This allows users to choose which version to deploy and enables seamless updates of existing provisioned products.

Using Launch Constraints

Always use launch constraints. This is a fundamental security practice. The IAM role specified in the launch constraint should have only the minimum necessary permissions to create the resources defined in your product’s Terraform configuration. This ensures that end-users, who only have permission to provision a product, cannot directly perform privileged actions in AWS.

Parameterization with Terraform Variables

Leverage Terraform variables to make your Service Catalog products flexible. For example, the S3 bucket product had `bucket_name` and `acl` as variables. These translate into input parameters that users see when provisioning the product in AWS Service Catalog. Carefully define variable types, descriptions, and validations to guide users.

Integrating with CI/CD Pipelines

Terraform Cloud is designed for CI/CD integration:

  • VCS-Driven Workflow: Any pull request or merge to your main branch (connected to a Terraform Cloud workspace) can trigger a `terraform plan` for review. Merges can automatically trigger `terraform apply`.
  • Terraform Cloud API: For more complex scenarios, use the Terraform Cloud API to programmatically trigger runs, check statuses, and manage workspaces, allowing custom CI/CD pipelines to manage your Service Catalog products and their underlying Terraform code.

Tagging and Cost Allocation

Implement a robust tagging strategy. Use Service Catalog TagOption constraints to automatically apply standardized tags (e.g., CostCenter, Project, Owner) to all resources provisioned through Service Catalog. Combine this with Terraform’s ability to propagate tags throughout resources to ensure comprehensive cost allocation and resource management.

Example TagOption Constraint (in `main.tf`):


resource "aws_servicecatalog_tag_option" "project_tag" {
  key   = "Project"
  value = "MyCloudProject"
}

resource "aws_servicecatalog_tag_option_association" "project_tag_assoc" {
  tag_option_id = aws_servicecatalog_tag_option.project_tag.id
  resource_id   = aws_servicecatalog_portfolio.dev_portfolio.id # Associate with portfolio
}

Troubleshooting Common Issues

IAM Permissions

This is the most frequent source of errors. Ensure that:

  • The Terraform Cloud user/role has permissions to create/manage Service Catalog, IAM roles, and all target resources.
  • The Service Catalog Launch Role has permissions for all actions required by your product’s Terraform configuration (e.g., `s3:CreateBucket`, `ec2:RunInstances`).
  • End-users have `servicecatalog:ProvisionProduct` and necessary `servicecatalog:List*` permissions.

Always review AWS CloudTrail logs and Terraform Cloud run logs for specific permission denied errors.

Product Provisioning Failures

If a provisioned product fails, check:

  • Terraform Cloud Run Logs: Access the specific run in Terraform Cloud that was triggered by Service Catalog. This will show `terraform plan` and `terraform apply` output, including any errors.
  • AWS CloudFormation Stack Events: In the AWS console, navigate to CloudFormation. Each provisioned product creates a stack. The events tab will show the failure reason, often indicating issues with the custom resource or the Lambda function integrating with Terraform Cloud.
  • Input Parameters: Verify that the parameters passed from Service Catalog to your Terraform configuration are correct and in the expected format.

Terraform State Management

Ensure that each Service Catalog product instance corresponds to a unique and isolated Terraform state file. Terraform Cloud workspaces inherently provide this isolation. Avoid sharing state files between different provisioned products, as this can lead to conflicts and unexpected changes.

Frequently Asked Questions

What is the difference between AWS Service Catalog and AWS CloudFormation?

AWS CloudFormation is an Infrastructure as Code (IaC) service for defining and provisioning AWS infrastructure resources using templates. AWS Service Catalog is a service that allows organizations to create and manage catalogs of IT services (which can be defined by CloudFormation templates or Terraform configurations) approved for use on AWS. Service Catalog sits on top of IaC tools like CloudFormation or Terraform to provide governance, self-service, and standardization for end-users.

Can I use Terraform Open Source directly with AWS Service Catalog without Terraform Cloud?

Yes, it’s possible, but it requires more effort to manage state, provide execution environments, and integrate with Service Catalog. You would typically use a custom resource in a CloudFormation template that invokes a Lambda function. This Lambda function would then run Terraform commands (e.g., using a custom-built container with Terraform) and manage its state (e.g., in S3). Terraform Cloud simplifies this significantly by providing a managed service for remote operations, state, and VCS integration.

How does AWS Service Catalog handle updates to provisioned products?

When you update your Terraform configuration (e.g., create a new version of your S3 bucket module), you create a new “provisioning artifact” (version) for your AWS Service Catalog product. End-users can then update their existing provisioned products to this new version directly from the Service Catalog UI. Service Catalog will trigger the underlying update process via CloudFormation/Terraform Cloud.

What are the security best practices when integrating Service Catalog with Terraform Cloud?

Key best practices include:

  • Least Privilege: Ensure the Service Catalog Launch Role has only the minimum necessary permissions.
  • Secrets Management: Use AWS Secrets Manager or Parameter Store for any sensitive data, and reference them in your Terraform configuration. Do not hardcode secrets.
  • VCS Security: Protect your Terraform code repository with branch protections and code reviews.
  • Terraform Cloud Permissions: Implement RBAC within

Thank you for reading the DevopsRoles page!

Red Hat Unveils the New Ansible Platform: What’s New and Why It Matters for Enterprise Automation

In the dynamic landscape of modern IT, automation is no longer a luxury but a fundamental necessity. As organizations navigate increasingly complex hybrid cloud environments, manage vast fleets of servers, and strive for operational efficiency, the demand for robust, intelligent, and scalable automation solutions intensifies. Red Hat has long been at the forefront of this transformation with Ansible, its powerful open-source automation engine. Recently, Red Hat unveiled significant enhancements to its flagship offering, the Ansible Platform, promising to revolutionize how enterprises approach automation. This comprehensive update integrates cutting-edge AI capabilities, intelligent event-driven automation, and a host of platform improvements designed to empower DevOps teams, system administrators, cloud engineers, and IT managers alike.

This article dives deep into the new Ansible Platform, exploring the key features, architectural improvements, and strategic benefits that Red Hat’s latest iteration brings to the table. We will dissect how advancements like Ansible Lightspeed with IBM watsonx Code Assistant and Event-Driven Ansible are set to transform automation workflows, reduce manual effort, and drive greater consistency across your IT infrastructure. Whether you’re a seasoned Ansible user or exploring enterprise automation solutions for the first time, understanding these updates is crucial for leveraging the full potential of modern IT operations.

The Evolution of Ansible: From Simple Playbooks to Intelligent Automation Platform

Ansible began its journey as a remarkably simple yet powerful configuration management tool, praised for its agentless architecture and human-readable YAML playbooks. Its declarative nature allowed users to define the desired state of their infrastructure, and Ansible would ensure that state was achieved. Over time, it grew beyond basic configuration, embracing orchestration, application deployment, and security automation, becoming a cornerstone for many organizations’ DevOps practices and infrastructure as code initiatives.

However, as IT environments scaled and diversified, new challenges emerged. The sheer volume of operational data, the need for faster incident response, and the ongoing demand for developer efficiency created a call for more intelligent and responsive automation. Red Hat recognized this and has continuously evolved Ansible, culminating in the sophisticated Ansible Platform of today. This evolution reflects a strategic shift from merely executing predefined tasks to creating an adaptive, intelligent, and self-optimizing automation ecosystem capable of responding to real-time events and leveraging AI-driven insights.

The latest iteration of the Ansible Platform builds upon this foundation by integrating advanced technologies that address contemporary enterprise needs. It’s not just about adding new features; it’s about creating a more cohesive, efficient, and intelligent automation experience that minimizes human intervention, accelerates development, and enhances operational resilience. This continuous innovation ensures that Ansible remains a relevant and powerful tool in the arsenal of modern IT professionals.

Deep Dive: What’s New in the Ansible Platform

Red Hat’s latest enhancements to the Ansible Platform introduce a suite of powerful capabilities designed to tackle the complexities of modern IT. These updates focus on intelligence, responsiveness, and developer experience, fundamentally changing how enterprises can leverage automation.

Ansible Lightspeed with IBM watsonx Code Assistant: AI-Powered Automation Content Creation

One of the most groundbreaking additions to the Ansible Platform is Ansible Lightspeed with IBM watsonx Code Assistant. This feature represents a significant leap forward in automation content creation by integrating artificial intelligence directly into the development workflow. Lightspeed is designed to empower automation developers and IT operators by generating Ansible content—playbooks, roles, and modules—from natural language prompts.

How it works:

  • Natural Language Input: Users describe the automation task they want to accomplish in plain English (e.g., “Install Nginx on Ubuntu servers,” “Create a new user ‘devops’ with sudo privileges,” “Restart the Apache service on web servers”).
  • AI-Driven Code Generation: IBM watsonx Code Assistant processes this input, leveraging its extensive knowledge base of Ansible best practices and a vast corpus of existing Ansible content. It then generates accurate, idiomatic Ansible YAML code.
  • Contextual Suggestions: As users type or modify their playbooks, Lightspeed provides real-time, context-aware suggestions and completions, helping to speed up development and reduce errors.
  • Trust and Transparency: Red Hat emphasizes the importance of trust in AI-generated content. Lightspeed provides source references for the generated code, allowing users to understand its origin and validate its adherence to organizational standards. This helps maintain code quality and security.

Benefits of Ansible Lightspeed:

  • Accelerated Content Development: Reduces the time and effort required to write Ansible playbooks, especially for repetitive or well-understood tasks.
  • Lower Barrier to Entry: Makes Ansible more accessible to new users by allowing them to describe tasks in natural language rather than needing to memorize specific syntax immediately.
  • Enhanced Productivity: Experienced users can offload boilerplate code generation, focusing on more complex logic and custom solutions.
  • Improved Consistency: By leveraging best practices and consistent patterns, Lightspeed can help ensure automation content adheres to organizational standards.

Example (Conceptual):

Imagine you need to create a playbook to ensure a specific package is installed and a service is running. Instead of manually writing the YAML, you could use a prompt:

Install 'httpd' package and ensure 'httpd' service is running on 'webservers' group.

Ansible Lightspeed with IBM watsonx Code Assistant would then generate something similar to:


---
- name: Configure Apache web server
  hosts: webservers
  become: yes
  tasks:
    - name: Ensure httpd package is installed
      ansible.builtin.package:
        name: httpd
        state: present

    - name: Ensure httpd service is running and enabled
      ansible.builtin.service:
        name: httpd
        state: started
        enabled: yes

This capability dramatically streamlines the automation content creation process, freeing up valuable time for engineers and enabling faster project delivery.

For more detailed information on Ansible Lightspeed and watsonx Code Assistant, refer to the official Red Hat Ansible Lightspeed page.

Event-Driven Ansible: Responsive and Proactive Automation

Another pivotal enhancement is Event-Driven Ansible. This feature fundamentally shifts Ansible from a purely scheduled or manually triggered automation engine to one that can react dynamically to events occurring across the IT estate. It enables a more responsive, proactive, and self-healing infrastructure.

How it works:

  • Sources: Event-Driven Ansible consumes events from various sources. These can include monitoring systems (e.g., Prometheus, Grafana), IT service management (ITSM) tools (e.g., ServiceNow), message queues (e.g., Apache Kafka), security information and event management (SIEM) systems, or custom applications.
  • Rulebooks: Users define “rulebooks” in YAML. A rulebook specifies a condition (based on incoming event data) and an action (which Ansible playbook to run) if that condition is met.
  • Actions: When a rule matches an event, Event-Driven Ansible triggers a predefined Ansible playbook or a specific automation task. This could be anything from restarting a failed service, scaling resources, creating an incident ticket, or running a diagnostic playbook.

Benefits of Event-Driven Ansible:

  • Faster Incident Response: Automates the first response to alerts, reducing Mean Time To Resolution (MTTR) for common issues.
  • Proactive Operations: Enables self-healing capabilities, where systems can automatically remediate issues before they impact users.
  • Reduced Manual Toil: Automates routine responses to system events, freeing up IT staff for more strategic work.
  • Enhanced Security: Can automate responses to security events, such as isolating compromised systems or blocking malicious IPs.
  • Improved Efficiency: Integrates various IT tools and systems, orchestrating responses across the entire ecosystem.

Example Rulebook:

Consider a scenario where you want to automatically restart a service if a monitoring system reports it’s down.


---
- name: Service outage remediation
  hosts: localhost
  sources:
    - name: MyMonitoringSystem
      ansible.eda.monitor_events:
        host: monitoring.example.com
        port: 5000

  rules:
    - name: Restart Apache if down
      condition: event.service_status == "down" and event.service_name == "apache"
      action:
        run_playbook:
          name: restart_apache.yml
          set_facts:
            target_host: event.host

This rulebook listens for events from “MyMonitoringSystem.” If an event indicates that the “apache” service is “down,” it triggers the restart_apache.yml playbook, passing the affected host as a fact. This demonstrates the power of autonomous and adaptive automation. Learn more about Event-Driven Ansible on the official Ansible documentation site.

Enhanced Private Automation Hub: Centralized Content Management

The Private Automation Hub, a key component of the Ansible Platform, continues to evolve as the central repository for an organization’s automation content. It provides a secure, version-controlled, and discoverable source for Ansible Content Collections, roles, and modules.

New enhancements focus on:

  • Improved Content Governance: Better tools for managing content lifecycle, approvals, and distribution across teams.
  • Deeper Integration: Seamless integration with CI/CD pipelines, allowing for automated testing and publication of automation content.
  • Enhanced Search and Discovery: Making it easier for automation developers to find and reuse existing content, promoting standardization and reducing duplication of effort.
  • Execution Environment Management: Centralized management of Ansible Execution Environments, ensuring consistent runtime environments for automation across different stages and teams.

These improvements solidify the Private Automation Hub as the single source of truth for automation, crucial for maintaining consistency and security in large-scale deployments.

Improved Automation Controller (formerly Ansible Tower): Operations and Management

The Automation Controller (previously Ansible Tower) serves as the operational hub of the Ansible Platform, offering a web-based UI, REST API, and role-based access control (RBAC) for managing and scaling Ansible automation. The latest updates bring:

  • Enhanced Scalability: Improved performance and stability for managing larger automation fleets and more concurrent jobs.
  • Streamlined Workflows: More intuitive workflow creation and management, allowing for complex automation sequences to be designed and executed with greater ease.
  • Advanced Reporting and Analytics: Better insights into automation performance, execution history, and resource utilization, helping organizations optimize their automation strategy.
  • Deeper Integration with Cloud Services: Enhanced capabilities for integrating with public and private cloud providers, simplifying cloud resource provisioning and management.

These improvements make the Automation Controller even more robust for enterprise-grade automation orchestration and management.

Expanded Ansible Content Collections: Ready-to-Use Automation

Ansible Content Collections package Ansible content—playbooks, roles, modules, plugins—into reusable, versioned units. The new Ansible Platform continues to expand the ecosystem of certified and community-contributed collections.

  • Broader Vendor Support: Increased support for various IT vendors and cloud providers, offering out-of-the-box automation for a wider range of technologies.
  • Specialized Collections: Development of more niche collections for specific use cases, such as network automation, security automation, and cloud-native application deployment.
  • Community Driven Growth: The open-source community continues to play a vital role in expanding the breadth and depth of available collections, catering to diverse automation needs.

These collections empower users to quickly implement automation for common tasks, reducing the need to build everything from scratch.

Benefits and Use Cases of the New Ansible Platform

The consolidated and enhanced Ansible Platform delivers significant advantages across various IT domains, impacting efficiency, reliability, and innovation.

For DevOps and Software Development

  • Faster Software Delivery: Ansible Lightspeed accelerates the creation of CI/CD pipeline automation, infrastructure provisioning, and application deployments, leading to quicker release cycles.
  • Consistent Environments: Ensures development, testing, and production environments are consistently configured, reducing “it works on my machine” issues.
  • Simplified Infrastructure as Code: Makes it easier for developers to manage infrastructure components through code, even if they are not automation specialists, thanks to AI assistance.

For System Administrators and Operations Teams

  • Automated Incident Response: Event-Driven Ansible enables automated remediation of common operational issues, reducing manual intervention and improving system uptime.
  • Proactive Maintenance: Schedule and automate routine maintenance tasks, patching, and compliance checks with greater ease and intelligence.
  • Scalable Management: Manage thousands of nodes effortlessly, ensuring consistency across vast and diverse IT landscapes.
  • Reduced Operational Toil: Automate repetitive, low-value tasks, freeing up highly skilled staff for more strategic initiatives.

For Cloud Engineers and Infrastructure Developers

  • Hybrid Cloud Orchestration: Seamlessly automate provisioning, configuration, and management across public clouds (AWS, Azure, GCP) and private cloud environments.
  • Dynamic Scaling: Use Event-Driven Ansible to automatically scale resources up or down based on real-time metrics and events.
  • Resource Optimization: Automate the identification and remediation of idle or underutilized cloud resources to reduce costs.

For Security Teams

  • Automated Security Policy Enforcement: Ensure security configurations are consistently applied across all systems.
  • Rapid Vulnerability Patching: Automate the deployment of security patches and updates across the infrastructure.
  • Automated Threat Response: Use Event-Driven Ansible to react to security alerts (e.g., from SIEMs) by isolating compromised systems, blocking IPs, or triggering incident response playbooks.

For IT Managers and Architects

  • Standardization and Governance: The Private Automation Hub promotes content reuse and best practices, ensuring automation initiatives align with organizational standards.
  • Increased ROI: Drive greater value from automation investments by accelerating content creation and enabling intelligent, proactive operations.
  • Strategic Resource Allocation: Empower teams to focus on innovation rather than repetitive operational tasks.
  • Enhanced Business Agility: Respond faster to market demands and operational changes with an agile and automated infrastructure.

Frequently Asked Questions

What is the Red Hat Ansible Platform?

The Red Hat Ansible Platform is an enterprise-grade automation solution that provides a comprehensive set of tools for deploying, managing, and scaling automation across an organization’s IT infrastructure. It includes the core Ansible engine, a web-based UI and API (Automation Controller), a centralized content repository (Private Automation Hub), and new intelligent capabilities like Ansible Lightspeed with IBM watsonx Code Assistant and Event-Driven Ansible.

How does Ansible Lightspeed with IBM watsonx Code Assistant improve automation development?

Ansible Lightspeed significantly accelerates automation content development by using AI to generate Ansible YAML code from natural language prompts. It provides contextual suggestions, helps enforce best practices, and reduces the learning curve for new users, allowing both novice and experienced automation developers to create playbooks more quickly and efficiently.

What problem does Event-Driven Ansible solve?

Event-Driven Ansible solves the problem of reactive and manual IT operations. Instead of waiting for human intervention or scheduled tasks, it enables automation to respond dynamically and proactively to real-time events from monitoring systems, ITSM tools, and other sources. This leads to faster incident response, self-healing infrastructure, and reduced operational toil.

Is the new Ansible Platform suitable for hybrid cloud environments?

Absolutely. The Ansible Platform is exceptionally well-suited for hybrid cloud environments. Its agentless architecture, extensive collection ecosystem for various cloud providers (AWS, Azure, GCP, VMware, OpenStack), and capabilities for orchestrating across diverse infrastructure types make it a powerful tool for managing both on-premises and multi-cloud resources consistently.

What are Ansible Content Collections and why are they important?

Ansible Content Collections are the standard format for packaging and distributing Ansible content (playbooks, roles, modules, plugins) in reusable, versioned units. They are important because they promote modularity, reusability, and easier sharing of automation content, fostering a rich ecosystem of pre-built automation for various vendors and use cases, and simplifying content management within the Private Automation Hub.

Conclusion

Red Hat’s latest unveilings for the Ansible Platform mark a pivotal moment in the evolution of enterprise automation. By integrating artificial intelligence through Ansible Lightspeed with IBM watsonx Code Assistant and introducing the dynamic, responsive capabilities of Event-Driven Ansible, Red Hat is pushing the boundaries of what automation can achieve. These innovations, coupled with continuous improvements to the Automation Controller and Private Automation Hub, create a truly comprehensive and intelligent platform for managing today’s complex, hybrid IT landscapes.

The new Ansible Platform empowers organizations to move beyond simple task execution to achieve genuinely proactive, self-healing, and highly efficient IT operations. It lowers the barrier to entry for automation, accelerates content development for experienced practitioners, and enables a level of responsiveness that is critical in the face of ever-increasing operational demands. For DevOps teams, SysAdmins, Cloud Engineers, and IT Managers, embracing these advancements is not just about keeping pace; it’s about setting a new standard for operational excellence and strategic agility. The future of IT automation is intelligent, event-driven, and increasingly human-augmented, and the Ansible Platform is leading the charge. Thank you for reading the DevopsRoles page!

Why You Should Run Docker on Your NAS: A Definitive Guide

Network Attached Storage (NAS) devices have evolved far beyond their original purpose as simple network file servers. Modern NAS units from brands like Synology, QNAP, and ASUSTOR are powerful, always-on computers capable of running a wide array of applications, from media servers like Plex to smart home hubs like Home Assistant. However, as users seek to unlock the full potential of their hardware, they often face a critical choice: install applications directly from the vendor’s app store or embrace a more powerful, flexible method. This article explores why leveraging Docker on NAS systems is overwhelmingly the superior approach for most users, transforming your storage device into a robust and efficient application server.

If you’ve ever struggled with outdated applications in your NAS app center, worried about software conflicts, or wished for an application that wasn’t officially available, this guide will demonstrate how containerization is the solution. We will delve into the limitations of the traditional installation method and contrast it with the security, flexibility, and vast ecosystem that Docker provides.

Understanding the Traditional Approach: Direct Installation

Every major NAS manufacturer provides a graphical, user-friendly “App Center” or “Package Center.” This is the default method for adding functionality to the device. You browse a curated list of applications, click “Install,” and the NAS operating system handles the rest. While this approach offers initial simplicity, it comes with significant drawbacks that become more apparent as your needs grow more sophisticated.

The Allure of Simplicity

The primary advantage of direct installation is its ease of use. It requires minimal technical knowledge and is designed to be a “point-and-click” experience. For users who only need to run a handful of officially supported, core applications (like a backup utility or a simple media indexer), this method can be sufficient. The applications are often tested by the NAS vendor to ensure basic compatibility with their hardware and OS.

The Hidden Costs of Convenience

Beneath the surface of this simplicity lies a rigid structure with several critical limitations that can hinder performance, security, and functionality.

  • Dependency Conflicts (“Dependency Hell”): Native packages install their dependencies directly onto the NAS operating system. If Application A requires Python 3.8 and Application B requires Python 3.10, installing both can lead to conflicts, instability, or outright failure. You are at the mercy of how the package maintainer bundled the software.
  • Outdated Software Versions: The applications available in official app centers are often several versions behind the latest stable releases. The process of a developer submitting an update, the NAS vendor vetting it, and then publishing it can be incredibly slow. This means you miss out on new features, performance improvements, and, most critically, important security patches.
  • Limited Application Selection: The vendor’s app store is a walled garden. If the application you want—be it a niche monitoring tool, a specific database, or the latest open-source project—isn’t in the official store, you are often out of luck or forced to rely on untrusted, third-party repositories.
  • Security Risks: A poorly configured or compromised application installed directly on the host has the potential to access and affect the entire NAS operating system. Its permissions are not strictly sandboxed, creating a larger attack surface for your critical data.
  • Lack of Portability: Your entire application setup is tied to your specific NAS vendor and its proprietary operating system. If you decide to switch from Synology to QNAP, or to a custom-built TrueNAS server, you must start from scratch, manually reinstalling and reconfiguring every single application.

The Modern Solution: The Power of Docker on NAS

This is where containerization, and specifically Docker, enters the picture. Docker is a platform that allows you to package an application and all its dependencies—libraries, system tools, code, and runtime—into a single, isolated unit called a container. This container can run consistently on any machine that has Docker installed, regardless of the underlying operating system. Implementing Docker on NAS systems fundamentally solves the problems inherent in the direct installation model.

What is Docker? A Quick Primer

To understand Docker’s benefits, it’s helpful to clarify a few core concepts:

  • Image: An image is a lightweight, standalone, executable package that includes everything needed to run a piece of software. It’s like a blueprint or a template for a container.
  • Container: A container is a running instance of an image. It is an isolated, sandboxed environment that runs on top of the host operating system’s kernel. Crucially, it shares the kernel with other containers, making it far more resource-efficient than a traditional virtual machine (VM), which requires a full guest OS.
  • Docker Engine: This is the underlying client-server application that builds and runs containers. Most consumer NAS devices with an x86 or ARMv8 processor now offer a version of the Docker Engine through their package centers.
  • Docker Hub: This is a massive public registry of millions of Docker images. If you need a database, a web server, a programming language runtime, or a complete application like WordPress, there is almost certainly an official or well-maintained image ready for you to use. You can explore it at Docker Hub’s official website.

By running applications inside containers, you effectively separate them from both the host NAS operating system and from each other, creating a cleaner, more secure, and infinitely more flexible system.

Key Advantages of Using Docker on Your NAS

Adopting a container-based workflow for your NAS applications isn’t just a different way of doing things; it’s a better way. Here are the concrete benefits that make it the go-to choice for tech-savvy users.

1. Unparalleled Application Selection

With Docker, you are no longer limited to the curated list in your NAS’s app store. Docker Hub and other container registries give you instant access to a vast universe of software. From popular applications like Pi-hole (network-wide ad-blocking) and Home Assistant (smart home automation) to developer tools like Jenkins, GitLab, and various databases, the selection is nearly limitless. You can run the latest versions of software the moment they are released by the developers, not weeks or months later.

2. Enhanced Security Through Isolation

This is perhaps the most critical advantage. Each Docker container runs in its own isolated environment. An application inside a container cannot, by default, see or interfere with the host NAS filesystem or other running containers. You explicitly define what resources it can access, such as specific storage folders (volumes) or network ports. If a containerized web server is compromised, the breach is contained within that sandbox. The attacker cannot easily access your core NAS data or other services, a significant security improvement over a natively installed application.

3. Simplified Dependency Management

Docker completely eliminates the “dependency hell” problem. Each Docker image bundles all of its own dependencies. You can run one container that requires an old version of NodeJS for a legacy app right next to another container that uses the very latest version, and they will never conflict. They are entirely self-contained, ensuring that applications run reliably and predictably every single time.

4. Consistent and Reproducible Environments with Docker Compose

For managing more than one container, the community standard is a tool called docker-compose. It allows you to define a multi-container application in a single, simple text file called docker-compose.yml. This file specifies all the services, networks, and volumes for your application stack. For more information, the official Docker Compose documentation is an excellent resource.

For example, setting up a WordPress site traditionally involves installing a web server, PHP, and a database, then configuring them all to work together. With Docker Compose, you can define the entire stack in one file:

version: '3.8'

services:
  db:
    image: mysql:8.0
    container_name: wordpress_db
    volumes:
      - db_data:/var/lib/mysql
    restart: unless-stopped
    environment:
      MYSQL_ROOT_PASSWORD: your_strong_root_password
      MYSQL_DATABASE: wordpress
      MYSQL_USER: wordpress
      MYSQL_PASSWORD: your_strong_user_password

  wordpress:
    image: wordpress:latest
    container_name: wordpress_app
    ports:
      - "8080:80"
    restart: unless-stopped
    environment:
      WORDPRESS_DB_HOST: db:3306
      WORDPRESS_DB_USER: wordpress
      WORDPRESS_DB_PASSWORD: your_strong_user_password
      WORDPRESS_DB_NAME: wordpress
    depends_on:
      - db

volumes:
  db_data:

With this file, you can deploy, stop, or recreate your entire WordPress installation with a single command (docker-compose up -d). This configuration is version-controllable, portable, and easy to share.

5. Effortless Updates and Rollbacks

Updating a containerized application is a clean and safe process. Instead of running a complex update script that modifies files on your live system, you simply pull the new version of the image and recreate the container. If something goes wrong, rolling back is as simple as pointing back to the previous image version. The process typically looks like this:

  1. docker-compose pull – Fetches the latest versions of all images defined in your file.
  2. docker-compose up -d – Recreates any containers for which a new image was pulled, leaving others untouched.

This process is atomic and far less risky than in-place upgrades of native packages.

6. Resource Efficiency and Portability

Because containers share the host NAS’s operating system kernel, their overhead is minimal compared to full virtual machines. You can run dozens of containers on a moderately powered NAS without a significant performance hit. Furthermore, your Docker configurations are inherently portable. The docker-compose.yml file you perfected on your Synology NAS will work with minimal (if any) changes on a QNAP, a custom Linux server, or even a cloud provider, future-proofing your setup and preventing vendor lock-in.

When Might Direct Installation Still Make Sense?

While Docker offers compelling advantages, there are a few scenarios where using the native package center might be a reasonable choice:

  • Tightly Integrated Core Functions: For applications that are deeply integrated with the NAS operating system, such as Synology Photos or QNAP’s Qfiling, the native version is often the best choice as it can leverage private APIs and system hooks unavailable to a Docker container.
  • Absolute Beginners: For a user who needs only one or two apps and has zero interest in learning even basic technical concepts, the simplicity of the app store may be preferable.
  • Extreme Resource Constraints: On a very old or low-power NAS (e.g., with less than 1GB of RAM), the overhead of the Docker engine itself, while small, might be a factor. However, most modern NAS devices are more than capable.

Frequently Asked Questions

Does running Docker on my NAS slow it down?

When idle, Docker containers consume a negligible amount of resources. When active, they use CPU and RAM just like any other application. The Docker engine itself has a very small overhead. In general, a containerized application will perform similarly to a natively installed one. Because containers are more lightweight than VMs, you can run many more of them, which might lead to higher overall resource usage if you run many services, but this is a function of the workload, not Docker itself.

Is Docker on a NAS secure?

Yes, when configured correctly, it is generally more secure than direct installation. The key is the isolation model. Each container is sandboxed from the host and other containers. To enhance security, always use official or well-vetted images, run containers as non-root users where possible (a setting within the image or compose file), and only expose the necessary network ports and data volumes to the container.

Can I run any Docker container on my NAS?

Mostly, but you must be mindful of CPU architecture. Most higher-end NAS devices use Intel or AMD x86-64 processors, which can run the vast majority of Docker images. However, many entry-level and ARM-based NAS devices (using processors like Realtek or Annapurna Labs) require ARM-compatible Docker images. Docker Hub typically labels images for different architectures (e.g., amd64, arm64v8). Many popular projects, like those from linuxserver.io, provide multi-arch images that automatically use the correct version for your system.

Do I need to use the command line to manage Docker on my NAS?

While the command line is the most powerful way to interact with Docker, it is not strictly necessary. Both Synology (with Container Manager) and QNAP (with Container Station) provide graphical user interfaces (GUIs) for managing containers. Furthermore, you can easily deploy a powerful web-based management UI like Portainer or Yacht inside a container, giving you a comprehensive graphical dashboard to manage your entire Docker environment from a web browser.

Conclusion

For any NAS owner looking to do more than just store files, the choice is clear. While direct installation from an app center offers a facade of simplicity, it introduces fragility, security concerns, and severe limitations. Transitioning to a workflow built around Docker on NAS is an investment that pays massive dividends in flexibility, security, and power. It empowers you to run the latest software, ensures your applications are cleanly separated and managed, and provides a reproducible, portable configuration that will outlast your current hardware.

By embracing containerization, you are not just installing an app; you are adopting a modern, robust, and efficient methodology for service management. You are transforming your NAS from a simple storage appliance into a true, multi-purpose home server, unlocking its full potential and future-proofing your digital ecosystem.Thank you for reading the DevopsRoles page!

Mastering Layer Caching: A Deep Dive into Boosting Your Docker Build Speed

In modern software development, containers have become an indispensable tool for creating consistent and reproducible environments. Docker, as the leading containerization platform, is at the heart of many development and deployment workflows. However, as applications grow in complexity, a common pain point emerges: slow build times. Waiting for a Docker image to build can be a significant drag on productivity, especially in CI/CD pipelines where frequent builds are the norm. The key to reclaiming this lost time lies in mastering one of Docker’s most powerful features: layer caching. A faster Docker build speed is not just a convenience; it’s a critical factor for an agile and efficient development cycle.

This comprehensive guide will take you on a deep dive into the mechanics of Docker’s layer caching system. We will explore how Docker images are constructed, how caching works under the hood, and most importantly, how you can structure your Dockerfiles to take full advantage of it. From fundamental best practices to advanced techniques involving BuildKit and multi-stage builds, you will learn actionable strategies to dramatically reduce your image build times, streamline your workflows, and enhance overall developer productivity.

Understanding Docker Layers and the Caching Mechanism

Before you can optimize caching, you must first understand the fundamental building blocks of a Docker image: layers. An image is not a single, monolithic entity; it’s a composite of multiple, read-only layers stacked on top of each other. This layered architecture is the foundation for the efficiency and shareability of Docker images.

The Anatomy of a Dockerfile Instruction

Every instruction in a `Dockerfile` (except for a few metadata instructions like `ARG` or `MAINTAINER`) creates a new layer in the Docker image. Each layer contains only the changes made to the filesystem by that specific instruction. For example, a `RUN apt-get install -y vim` command creates a layer containing the newly installed `vim` binaries and their dependencies.

Consider this simple `Dockerfile`:

# Base image
FROM ubuntu:22.04

# Install dependencies
RUN apt-get update && apt-get install -y curl

# Copy application files
COPY . /app

# Set the entrypoint
CMD ["/app/start.sh"]

This `Dockerfile` will produce an image with three distinct layers on top of the base `ubuntu:22.04` image layers:

  • Layer 1: The result of the `RUN apt-get update …` command.
  • Layer 2: The files and directories added by the `COPY . /app` command.
  • Layer 3: Metadata specifying the `CMD` instruction.

This layered structure is what allows Docker to be so efficient. When you pull an image, Docker only downloads the layers you don’t already have locally from another image.

How Docker’s Layer Cache Works

When you run the `docker build` command, Docker’s builder processes your `Dockerfile` instruction by instruction. For each instruction, it performs a critical check: does a layer already exist in the local cache that was generated by this exact instruction and state?

  • If the answer is yes, it’s a cache hit. Docker reuses the existing layer from its cache and prints `—> Using cache`. This is an almost instantaneous operation.
  • If the answer is no, it’s a cache miss. Docker must execute the instruction, create a new layer from the result, and add it to the cache for future builds.

The crucial rule to remember is this: once an instruction results in a cache miss, all subsequent instructions in the Dockerfile will also be executed without using the cache, even if cached layers for them exist. This is because the state of the image has diverged, and Docker cannot guarantee that the subsequent cached layers are still valid.

For most instructions like `RUN` or `CMD`, Docker simply checks if the command string is identical to the one that created a cached layer. For file-based instructions like `COPY` and `ADD`, the check is more sophisticated. Docker calculates a checksum of the files being copied. If the instruction and the file checksums match a cached layer, it’s a cache hit. Any change to the content of those files will result in a different checksum and a cache miss.

Core Strategies to Maximize Your Docker Build Speed

Understanding the “cache miss invalidates all subsequent layers” rule is the key to unlocking a faster Docker build speed. The primary optimization strategy is to structure your `Dockerfile` to maximize the number of cache hits. This involves ordering instructions from least to most likely to change.

Order Your Dockerfile Instructions Strategically

Place instructions that change infrequently, like installing system dependencies, at the top of your `Dockerfile`. Place instructions that change frequently, like copying your application’s source code, as close to the bottom as possible.

Bad Example: Inefficient Ordering

FROM node:18-alpine

WORKDIR /usr/src/app

# Copy source code first - changes on every commit
COPY . .

# Install dependencies - only changes when package.json changes
RUN npm install

CMD [ "node", "server.js" ]

In this example, any small change to your source code (e.g., fixing a typo in a comment) will invalidate the `COPY` layer’s cache. Because of the core caching rule, the subsequent `RUN npm install` layer will also be invalidated and re-run, even if `package.json` hasn’t changed. This is incredibly inefficient.

Good Example: Optimized Ordering

FROM node:18-alpine

WORKDIR /usr/src/app

# Copy only the dependency manifest first
COPY package*.json ./

# Install dependencies. This layer is only invalidated when package.json changes.
RUN npm install

# Now, copy the source code, which changes frequently
COPY . .

CMD [ "node", "server.js" ]

This version is far superior. We first copy only `package.json` and `package-lock.json`. The `npm install` command runs and its resulting layer is cached. In subsequent builds, as long as the package files haven’t changed, Docker will hit the cache for this layer. Changes to your application source code will only invalidate the final `COPY . .` layer, making the build near-instantaneous.

Leverage a `.dockerignore` File

The build context is the set of files at the specified path or URL sent to the Docker daemon. A `COPY . .` instruction makes the entire build context relevant to the layer’s cache. If any file in the context changes, the cache is busted. A `.dockerignore` file, similar in syntax to `.gitignore`, allows you to exclude files and directories from the build context.

This is critical for two reasons:

  1. Cache Invalidation: It prevents unnecessary cache invalidation from changes to files not needed in the final image (e.g., `.git` directory, logs, local configuration, `README.md`).
  2. Performance: It reduces the size of the build context sent to the Docker daemon, which can speed up the start of the build process, especially for large projects.

A typical `.dockerignore` file might look like this:

.git
.gitignore
.dockerignore
node_modules
npm-debug.log
README.md
Dockerfile

Chain RUN Commands and Clean Up in the Same Layer

To keep images small and optimize layer usage, chain related commands together using `&&` and clean up any unnecessary artifacts within the same `RUN` instruction. This creates a single layer for the entire operation.

Example: Chaining and Cleaning

RUN apt-get update && \
    apt-get install -y wget && \
    wget https://example.com/some-package.deb && \
    dpkg -i some-package.deb && \
    rm some-package.deb && \
    apt-get clean && \
    rm -rf /var/lib/apt/lists/*

If each of these commands were a separate `RUN` instruction, the downloaded `.deb` file and the `apt` cache would be permanently stored in intermediate layers, bloating the final image size. By combining them, we download, install, and clean up all within a single layer, ensuring no intermediate artifacts are left behind.

Advanced Caching Techniques for Complex Scenarios

While the basics will get you far, modern development workflows often require more sophisticated caching strategies, especially in CI/CD environments.

Using Multi-Stage Builds

Multi-stage builds are a powerful feature for creating lean, production-ready images. They allow you to use one image with a full build environment (the “builder” stage) to compile your code or build assets, and then copy only the necessary artifacts into a separate, minimal final image.

This pattern also enhances caching. Your build stage might have many dependencies (`gcc`, `maven`, `npm`) that rarely change. The final stage only copies the compiled binary or static assets. This decouples the final image from build-time dependencies, making its layers more stable and more likely to be cached.

Example: Go Application Multi-Stage Build

# Stage 1: The builder stage
FROM golang:1.19 AS builder

WORKDIR /go/src/app
COPY . .

# Build the application
RUN CGO_ENABLED=0 GOOS=linux go build -o /go/bin/app .

# Stage 2: The final, minimal image
FROM alpine:latest

# Copy only the compiled binary from the builder stage
COPY --from=builder /go/bin/app /app

# Run the application
ENTRYPOINT ["/app"]

Here, changes to the Go source code will trigger a rebuild of the `builder` stage, but the `FROM alpine:latest` layer in the final stage will always be cached. The `COPY –from=builder` layer will only be invalidated if the compiled binary itself changes, leading to very fast rebuilds for the production image.

Leveraging BuildKit’s Caching Features

BuildKit is Docker’s next-generation build engine, offering significant performance improvements and new features. One of its most impactful features is the cache mount (`–mount=type=cache`).

A cache mount allows you to provide a persistent cache directory for commands inside a `RUN` instruction. This is a game-changer for package managers. Instead of re-downloading dependencies on every cache miss of an `npm install` or `pip install` layer, you can mount a cache directory that persists across builds.

Example: Using a Cache Mount for NPM

To use this feature, you must enable BuildKit by setting an environment variable (`DOCKER_BUILDKIT=1`) or by using the `docker buildx build` command. The Dockerfile syntax is:

# syntax=docker/dockerfile:1
FROM node:18-alpine

WORKDIR /usr/src/app

COPY package*.json ./

# Mount a cache directory for npm
RUN --mount=type=cache,target=/root/.npm \
    npm install

COPY . .

CMD [ "node", "server.js" ]

With this setup, even if `package.json` changes and the `RUN` layer’s cache is busted, `npm` will use the mounted cache directory (`/root/.npm`) to avoid re-downloading packages it already has, dramatically speeding up the installation process.

Using External Cache Sources with `–cache-from`

In CI/CD environments, each build often runs on a clean, ephemeral agent, which means there is no local Docker cache from previous builds. The `–cache-from` flag solves this problem.

It instructs Docker to use the layers from a specified image as a cache source. A common CI/CD pattern is:

  1. Attempt to pull a previous build: At the start of the job, pull the image from the previous successful build for the same branch (e.g., `my-app:latest` or `my-app:my-branch`).
  2. Build with `–cache-from`: Run the `docker build` command, pointing `–cache-from` to the image you just pulled.
  3. Push the new image: Tag the newly built image and push it to the registry for the next build to use as its cache source.

Example Command:

# Pull the latest image to use as a cache source
docker pull my-registry/my-app:latest || true

# Build the new image, using the pulled image as a cache
docker build \
  --cache-from my-registry/my-app:latest \
  -t my-registry/my-app:latest \
  -t my-registry/my-app:${CI_COMMIT_SHA} \
  .

# Push the new images to the registry
docker push my-registry/my-app:latest
docker push my-registry/my-app:${CI_COMMIT_SHA}

This technique effectively shares the build cache across CI/CD jobs, providing significant improvements to your pipeline’s Docker build speed.

Frequently Asked Questions

Why is my Docker build still slow even with caching?

There could be several reasons. The most common is frequent cache invalidation high up in your `Dockerfile` (e.g., a `COPY . .` near the top). Other causes include a very large build context being sent to the daemon, slow network speeds for downloading base images or dependencies, or CPU-intensive `RUN` commands that are legitimately taking a long time to execute (not a caching issue).

How can I force Docker to rebuild an image without using the cache?

You can use the `–no-cache` flag with the `docker build` command. This will instruct Docker to ignore the build cache entirely and run every single instruction from scratch.

docker build --no-cache -t my-app .

What is the difference between `COPY` and `ADD` regarding caching?

For the purpose of caching local files and directories, they behave identically: a checksum of the file contents is used to determine a cache hit or miss. However, the `ADD` command has additional “magic” features, such as automatically extracting local tar archives and fetching remote URLs. These features can lead to unexpected cache behavior. The official Docker best practices recommend always preferring `COPY` unless you specifically need the extra functionality of `ADD`.

Does changing a comment in my Dockerfile bust the cache?

No. Docker’s parser is smart enough to ignore comments (`#`) when it determines whether to use a cached layer. Similarly, changing the case of an instruction (e.g., `run` to `RUN`) will also not bust the cache. The cache key is based on the instruction’s content, not its exact formatting.

Conclusion

Optimizing your Docker build speed is a crucial skill for any developer or DevOps professional working with containers. By understanding that Docker images are built in layers and that a single cache miss invalidates all subsequent layers, you can make intelligent decisions when structuring your `Dockerfile`. Remember the core principles: order your instructions from least to most volatile, be precise with what you `COPY`, and use a `.dockerignore` file to keep your build context clean.

For more complex scenarios, don’t hesitate to embrace advanced techniques like multi-stage builds to create lean and secure images, and leverage the powerful caching features of BuildKit to accelerate dependency installation. By applying these strategies, you will transform slow, frustrating builds into a fast, efficient, and streamlined part of your development lifecycle, freeing up valuable time to focus on what truly matters: building great software. Thank you for reading the DevopsRoles page!

Streamlining Your Workflow: How to Automate Container Security Audits with Docker Scout & Python

In the modern software development lifecycle, containers have become the de facto standard for packaging and deploying applications. Their portability and consistency offer immense benefits, but they also introduce a complex new layer for security management. As development velocity increases, manually inspecting every container image for vulnerabilities is not just inefficient; it’s impossible. This is where the practice of automated container security audits becomes a critical component of a robust DevSecOps strategy. This article provides a comprehensive, hands-on guide for developers, DevOps engineers, and security professionals on how to leverage the power of Docker Scout and the versatility of Python to build an automated security auditing workflow, ensuring vulnerabilities are caught early and consistently.

Understanding the Core Components: Docker Scout and Python

Before diving into the automation scripts, it’s essential to understand the two key technologies that form the foundation of our workflow. Docker Scout provides the security intelligence, while Python acts as the automation engine that glues everything together.

What is Docker Scout?

Docker Scout is an advanced software supply chain management tool integrated directly into the Docker ecosystem. Its primary function is to provide deep insights into the contents and security posture of your container images. It goes beyond simple vulnerability scanning by offering a multi-faceted approach to security.

  • Vulnerability Scanning: At its core, Docker Scout analyzes your image layers against an extensive database of Common Vulnerabilities and Exposures (CVEs). It provides detailed information on each vulnerability, including its severity (Critical, High, Medium, Low), the affected package, and the version that contains a fix.
  • Software Bill of Materials (SBOM): Scout automatically generates a detailed SBOM for your images. An SBOM is a complete inventory of all components, libraries, and dependencies within your software. This is crucial for supply chain security, allowing you to quickly identify if you’re affected by a newly discovered vulnerability in a transitive dependency.
  • Policy Evaluation: For teams, Docker Scout offers a powerful policy evaluation engine. You can define rules, such as “fail any build with critical vulnerabilities” or “alert on packages with non-permissive licenses,” and Scout will automatically enforce them.
  • Cross-Registry Support: While deeply integrated with Docker Hub, Scout is not limited to it. It can analyze images from various other registries, including Amazon ECR, Artifactory, and even local images on your machine, making it a versatile tool for diverse environments. You can find more details in the official Docker Scout documentation.

Why Use Python for Automation?

Python is the language of choice for DevOps and automation for several compelling reasons. Its simplicity, combined with a powerful standard library and a vast ecosystem of third-party packages, makes it ideal for scripting complex workflows.

  • Simplicity and Readability: Python’s clean syntax makes scripts easy to write, read, and maintain, which is vital for collaborative DevOps environments.
  • Powerful Standard Library: Modules like subprocess (for running command-line tools), json (for parsing API and tool outputs), and os (for interacting with the operating system) are included by default.
  • Rich Ecosystem: Libraries like requests for making HTTP requests to APIs (e.g., posting alerts to Slack or Jira) and pandas for data analysis make it possible to build sophisticated reporting and integration pipelines.
  • Platform Independence: Python scripts run consistently across Windows, macOS, and Linux, which is essential for teams using different development environments.

Setting Up Your Environment for Automated Container Security Audits

To begin, you need to configure your local machine to run both Docker Scout and the Python scripts we will develop. This setup process is straightforward and forms the bedrock of our automation.

Prerequisites

Ensure you have the following tools installed and configured on your system:

  1. Docker Desktop: You need a recent version of Docker Desktop (for Windows, macOS, or Linux). Docker Scout is integrated directly into Docker Desktop and the Docker CLI.
  2. Python 3.x: Your system should have Python 3.6 or a newer version installed. You can verify this by running python3 --version in your terminal.
  3. Docker Account: You need a Docker Hub account. While much of Scout’s local analysis is free, full functionality and organizational features require a subscription.
  4. Docker CLI Login: You must be authenticated with the Docker CLI. Run docker login and enter your credentials.

Enabling Docker Scout

Docker Scout is enabled by default in recent versions of Docker Desktop. You can verify its functionality by running a basic command against a public image:

docker scout cves nginx:latest

This command will fetch the vulnerability data for the latest NGINX image and display it in your terminal. If this works, your environment is ready.

Installing Necessary Python Libraries

For our scripts, we won’t need many external libraries initially, as we’ll rely on Python’s standard library. However, for more advanced reporting, the requests library is invaluable for API integrations.

Install it using pip:

pip install requests

A Practical Guide to Automating Docker Scout with Python

Now, let’s build the Python script to automate our container security audits. We’ll start with a basic script to trigger a scan and parse the results, then progressively add more advanced logic for policy enforcement and reporting.

The Automation Workflow Overview

Our automated process will follow these logical steps:

  1. Target Identification: The script will accept a container image name and tag as input.
  2. Scan Execution: It will use Python’s subprocess module to execute the docker scout cves command.
  3. Output Parsing: The command will be configured to output in JSON format, which is easily parsed by Python.
  4. Policy Analysis: The script will analyze the parsed data against a predefined set of security rules (our “policy”).
  5. Result Reporting: Based on the analysis, the script will produce a clear pass/fail result and a summary report.

Step 1: Triggering a Scan via Python’s `subprocess` Module

The subprocess module is the key to interacting with command-line tools from within Python. We’ll use it to run Docker Scout and capture its output.

Here is a basic Python script, audit_image.py, to achieve this:


import subprocess
import json
import sys

def run_scout_scan(image_name):
    """
    Runs the Docker Scout CVE scan on a given image and returns the JSON output.
    """
    if not image_name:
        print("Error: Image name not provided.")
        return None

    command = [
        "docker", "scout", "cves", image_name, "--format", "json", "--only-severity", "critical,high"
    ]
    
    print(f"Running scan on image: {image_name}...")
    
    try:
        result = subprocess.run(
            command,
            capture_output=True,
            text=True,
            check=True
        )
        # The JSON output might have multiple JSON objects, we are interested in the vulnerability list
        # We find the line that starts with '{"vulnerabilities":'
        for line in result.stdout.splitlines():
            if '"vulnerabilities"' in line:
                return json.loads(line)
        return {"vulnerabilities": []} # Return empty list if no vulnerabilities found
    except subprocess.CalledProcessError as e:
        print(f"Error running Docker Scout: {e}")
        print(f"Stderr: {e.stderr}")
        return None
    except json.JSONDecodeError as e:
        print(f"Error parsing JSON output: {e}")
        return None

if __name__ == "__main__":
    if len(sys.argv) < 2:
        print("Usage: python audit_image.py ")
        sys.exit(1)
        
    target_image = sys.argv[1]
    scan_results = run_scout_scan(target_image)
    
    if scan_results:
        print("\nScan complete. Raw JSON output:")
        print(json.dumps(scan_results, indent=2))

How to run it:

python audit_image.py python:3.9-slim

Explanation:

  • The script takes the image name as a command-line argument.
  • It constructs the docker scout cves command. We use --format json to get machine-readable output and --only-severity critical,high to focus on the most important threats.
  • subprocess.run() executes the command. capture_output=True captures stdout and stderr, and check=True raises an exception if the command fails.
  • The script then parses the JSON output and prints it. The logic specifically looks for the line containing the vulnerability list, as the Scout CLI can sometimes output other status information. For more detailed information on the module, consult the official Python `subprocess` documentation.

Step 2: Implementing a Custom Security Policy

Simply listing vulnerabilities is not enough; we need to make a decision based on them. This is where a security policy comes in. Our policy will define the acceptable risk level.

Let’s define a simple policy: The audit fails if there is one or more CRITICAL vulnerability OR more than five HIGH vulnerabilities.

We’ll add a function to our script to enforce this policy.


# Add this function to audit_image.py

def analyze_results(scan_data, policy):
    """
    Analyzes scan results against a defined policy and returns a pass/fail status.
    """
    if not scan_data or "vulnerabilities" not in scan_data:
        print("No vulnerability data to analyze.")
        return "PASS", "No vulnerabilities found or data unavailable."

    vulnerabilities = scan_data["vulnerabilities"]
    
    # Count vulnerabilities by severity
    severity_counts = {"CRITICAL": 0, "HIGH": 0}
    for vuln in vulnerabilities:
        severity = vuln.get("severity")
        if severity in severity_counts:
            severity_counts[severity] += 1
            
    print(f"\nAnalysis Summary:")
    print(f"- Critical vulnerabilities found: {severity_counts['CRITICAL']}")
    print(f"- High vulnerabilities found: {severity_counts['HIGH']}")

    # Check against policy
    fail_reasons = []
    if severity_counts["CRITICAL"] > policy["max_critical"]:
        fail_reasons.append(f"Exceeded max critical vulnerabilities (found {severity_counts['CRITICAL']}, max {policy['max_critical']})")
    
    if severity_counts["HIGH"] > policy["max_high"]:
        fail_reasons.append(f"Exceeded max high vulnerabilities (found {severity_counts['HIGH']}, max {policy['max_high']})")

    if fail_reasons:
        return "FAIL", ". ".join(fail_reasons)
    else:
        return "PASS", "Image meets the defined security policy."

# Modify the `if __name__ == "__main__":` block

if __name__ == "__main__":
    if len(sys.argv) < 2:
        print("Usage: python audit_image.py ")
        sys.exit(1)
        
    target_image = sys.argv[1]
    
    # Define our security policy
    security_policy = {
        "max_critical": 0,
        "max_high": 5
    }
    
    scan_results = run_scout_scan(target_image)
    
    if scan_results:
        status, message = analyze_results(scan_results, security_policy)
        print(f"\nAudit Result: {status}")
        print(f"Details: {message}")
        
        # Exit with a non-zero status code on failure for CI/CD integration
        if status == "FAIL":
            sys.exit(1)

Now, when you run the script, it will not only list the vulnerabilities but also provide a clear PASS or FAIL verdict. The non-zero exit code on failure is crucial for CI/CD pipelines, as it will cause the build step to fail automatically.

Integrating Automated Audits into Your CI/CD Pipeline

The true power of this automation script is realized when it’s integrated into a CI/CD pipeline. This “shifts security left,” enabling developers to get immediate feedback on the security of the images they build, long before they reach production.

Below is a conceptual example of how to integrate our Python script into a GitHub Actions workflow. This workflow builds a Docker image and then runs our audit script against it.

Example: GitHub Actions Workflow

Create a file named .github/workflows/security_audit.yml in your repository:


name: Docker Image Security Audit

on:
  push:
    branches: [ "main" ]
  pull_request:
    branches: [ "main" ]

jobs:
  build-and-audit:
    runs-on: ubuntu-latest
    steps:
      - name: Checkout repository
        uses: actions/checkout@v3

      - name: Set up Docker Buildx
        uses: docker/setup-buildx-action@v2

      - name: Login to Docker Hub
        uses: docker/login-action@v2
        with:
          username: ${{ secrets.DOCKERHUB_USERNAME }}
          password: ${{ secrets.DOCKERHUB_TOKEN }}

      - name: Build and push Docker image
        id: docker_build
        uses: docker/build-push-action@v4
        with:
          context: .
          file: ./Dockerfile
          push: true
          tags: ${{ secrets.DOCKERHUB_USERNAME }}/myapp:${{ github.sha }}

      - name: Setup Python
        uses: actions/setup-python@v4
        with:
          python-version: '3.9'

      - name: Run Container Security Audit
        run: |
          # Assuming your script is in a 'scripts' directory
          python scripts/audit_image.py ${{ secrets.DOCKERHUB_USERNAME }}/myapp:${{ github.sha }}

Key aspects of this workflow:

  • It triggers on pushes and pull requests to the main branch.
  • It logs into Docker Hub using secrets stored in GitHub.
  • The docker/build-push-action builds the image from a Dockerfile and pushes it to a registry. This is necessary for Docker Scout to analyze it effectively in a CI environment.
  • Finally, it runs our audit_image.py script. If the script exits with a non-zero status code (as we programmed it to do on failure), the entire workflow will fail, preventing the insecure code from being merged. This creates a critical security gate in the development process, aligning with best practices for CI/CD security.

Frequently Asked Questions (FAQ)

Can I use Docker Scout for images that are not on Docker Hub?

Yes. Docker Scout is designed to be registry-agnostic. You can analyze local images on your machine simply by referencing them (e.g., my-local-app:latest). For CI/CD environments and team collaboration, you can connect Docker Scout to other popular registries like Amazon ECR, Google Artifact Registry, and JFrog Artifactory to gain visibility across your entire organization.

Is Docker Scout a free tool?

Docker Scout operates on a freemium model. The free tier, included with a standard Docker account, provides basic vulnerability scanning and SBOM generation for local images and Docker Hub public images. For advanced features like central policy management, integration with multiple private registries, and detailed supply chain insights, a paid Docker Business subscription is required.

What is an SBOM and why is it important for container security?

SBOM stands for Software Bill of Materials. It is a comprehensive, machine-readable inventory of all software components, dependencies, and libraries included in an application or, in this case, a container image. Its importance has grown significantly as software supply chains have become more complex. An SBOM allows organizations to quickly and precisely identify all systems affected by a newly discovered vulnerability in a third-party library, drastically reducing response time and risk exposure.

How does Docker Scout compare to other open-source tools like Trivy or Grype?

Tools like Trivy and Grype are excellent, widely-used open-source vulnerability scanners. Docker Scout’s key differentiators lie in its deep integration with the Docker ecosystem (Docker Desktop, Docker Hub) and its focus on the developer experience. Scout provides remediation advice directly in the developer’s workflow and expands beyond just CVE scanning to offer holistic supply chain management features, including policy enforcement and deeper package metadata analysis, which are often premium features in other platforms.

Conclusion

In a world of continuous delivery and complex software stacks, manual security checks are no longer viable. Automating your container security audits is not just a best practice; it is a necessity for maintaining a strong security posture. By combining the deep analytical power of Docker Scout with the flexible automation capabilities of Python, teams can create a powerful, customized security gate within their CI/CD pipelines. This proactive approach ensures that vulnerabilities are identified and remediated early in the development cycle, reducing risk, minimizing costly fixes down the line, and empowering developers to build more secure applications from the start. The journey into automated container security audits begins with a single script, and the framework outlined here provides a robust foundation for building a comprehensive and effective DevSecOps program.Thank you for reading the DevopsRoles page!

Ansible Lightspeed: Supercharging Your Automation with Generative AI

In the world of IT automation, complexity is a constant challenge. As infrastructures scale and technology stacks diversify, the time and expertise required to write, debug, and maintain effective automation workflows grow exponentially. DevOps engineers, system administrators, and developers often spend significant hours wrestling with YAML syntax, searching for the correct module parameters, and ensuring their Ansible Playbooks adhere to best practices. This manual effort can slow down deployments, introduce errors, and create a steep learning curve for new team members. This is the precise problem that Ansible Lightspeed, powered by IBM watsonx Code Assistant, is designed to solve.

This article provides a comprehensive deep dive into Ansible Lightspeed, exploring its core technology, key features, and practical applications. We will guide you through how this generative AI service is revolutionizing Ansible content creation, transforming it from a purely manual task into an intelligent, collaborative process between human experts and artificial intelligence.

What is Ansible Lightspeed? A Technical Deep Dive

At its core, Ansible Lightspeed is a generative AI service designed specifically for the Ansible Automation Platform. It’s not merely a syntax checker or an autocomplete tool; it’s a sophisticated content creation assistant that understands natural language prompts and translates them into high-quality, context-aware Ansible code. It integrates directly into popular IDEs like Visual Studio Code, acting as a co-pilot for automation developers.

The Core Concept: Generative AI for Ansible Content

The primary function of Ansible Lightspeed is to bridge the gap between human intent and machine-readable code. An automation engineer can describe a task in plain English, and Lightspeed will generate the corresponding YAML code snippet. This fundamentally changes the development workflow:

  • For Novices: It dramatically lowers the barrier to entry. A user who knows what they want to automate but isn’t familiar with the specific Ansible module or its syntax can simply describe the task (e.g., “create a new user named ‘devuser'”) and receive a working code suggestion.
  • For Experts: It acts as a major productivity accelerator. Experienced engineers can offload the creation of boilerplate and repetitive tasks, allowing them to focus on the more complex architectural logic of their automation. It also serves as a quick reference for less-frequently used modules, saving a trip to the documentation.

The Technology Behind the Magic: IBM watsonx Code Assistant

The intelligence driving Ansible Lightspeed is IBM’s watsonx Code Assistant. This is a purpose-built foundation model specifically tuned for IT automation. Unlike general-purpose AI models, watsonx Code Assistant has been trained on a massive, curated dataset of Ansible content. This training data includes:

  • Millions of lines of code from Ansible Galaxy.
  • Publicly available GitHub repositories containing Ansible Playbooks.
  • A vast corpus of trusted and certified Ansible content.

This specialized training makes the model highly proficient in understanding the nuances of Ansible’s domain-specific language. It recognizes module names, understands parameter dependencies, and generates code that aligns with established community best practices. Red Hat emphasizes a commitment to transparency and data sourcing, ensuring the model is trained on permissively licensed content to respect the open-source community and minimize legal risks. For more detailed information, you can refer to the official Red Hat Ansible Lightspeed page.

How It Works in Practice

The user experience is designed to be seamless and intuitive, integrating directly into the development environment. The typical workflow looks like this:

  1. Write a Task Name: Inside a YAML playbook file in VS Code, the user writes a descriptive task name, preceded by - name:. For example: - name: Install the latest version of Nginx.
  2. Trigger the AI: As the user types, Ansible Lightspeed sends the task name (the prompt) to the IBM watsonx Code Assistant API.
  3. Receive a Suggestion: The AI model processes the prompt and generates a corresponding YAML code block. This suggestion appears as “ghost text” directly in the editor.
  4. Accept or Modify: The user can press the ‘Tab’ key to accept the full suggestion. They are then free to review, modify, or add to the generated code. The user always remains in full control.

This interactive loop makes playbook development faster, more fluid, and less prone to common syntax errors.

Key Features and Benefits of Ansible Lightspeed

The adoption of Ansible Lightspeed offers tangible benefits across the entire automation lifecycle, impacting productivity, quality, and team efficiency.

Accelerating Playbook Development

The most immediate benefit is a dramatic reduction in development time. By automating the generation of standard tasks, engineers can assemble playbooks much more quickly. This is especially true for complex workflows that involve multiple services, configuration files, and system states. Instead of manually looking up module syntax for each step, developers can describe the desired outcome and let the AI handle the boilerplate.

Lowering the Barrier to Entry

Ansible is powerful, but its learning curve can be steep for newcomers. Lightspeed acts as an interactive learning tool. When a new user receives a suggestion, they see not only the correct code but also the proper structure, module choice, and parameter usage. This on-the-job training helps new team members become productive with Ansible much faster than traditional methods.

Enhancing Code Quality and Consistency

Because the underlying watsonx model is trained on a vast repository of high-quality and certified content, its suggestions inherently follow community best practices. This leads to several quality improvements:

  • Use of FQCNs: It often suggests using Fully Qualified Collection Names (e.g., ansible.builtin.apt instead of just apt), which is a modern best practice for avoiding ambiguity.
  • Idempotent Designs: The generated tasks are typically idempotent, meaning they can be run multiple times without causing unintended side effects.
  • Consistent Style: It helps enforce a consistent coding style across a team, improving the readability and maintainability of the entire automation code base.

Boosting Productivity for Experienced Users

Expert users may already know the syntax, but they still benefit from the speed and efficiency of AI assistance. Lightspeed allows them to:

  • Automate Repetitive Work: Quickly generate code for common tasks like managing packages, services, or files.
  • Explore New Modules: Get a working example for a module they haven’t used before without leaving their editor to read documentation.
  • Scale Automation Efforts: Spend less time on mundane coding and more time on high-level automation strategy and architecture.

Getting Started: A Practical Walkthrough

Putting Ansible Lightspeed to work is straightforward, requiring only a few setup steps within Visual Studio Code.

Prerequisites

Before you begin, ensure you have the following:

  • Visual Studio Code: The latest version installed on your machine.
  • A Red Hat Account: You will need to log in to authorize the service.
  • Ansible Extension for VS Code: The official extension maintained by Red Hat.

Installation and Configuration Steps

  1. Install the Ansible Extension: Open VS Code, navigate to the Extensions view (Ctrl+Shift+X), search for “Ansible,” and install the official extension published by Red Hat. You can find it in the VS Code Marketplace.
  2. Enable Ansible Lightspeed: Once installed, open the VS Code settings (Ctrl+,). Search for “Ansible Lightspeed” and ensure the “Enable Ansible Lightspeed” checkbox is ticked.
  3. Authenticate: The first time you use the feature, a prompt will appear asking you to log in with your Red Hat account. Follow the authentication flow in your browser to connect your IDE to the service.
  4. Accept Terms and Conditions: You will be prompted to accept the terms and conditions for the service within VS Code.

Once authenticated, you are ready to start generating code.

Your First AI-Generated Task: A Simple Example

Let’s see it in action. Create a new file named test_playbook.yml and start typing.

Step 1: Define the playbook structure.


---
- name: Web Server Setup Playbook
  hosts: webservers
  become: true
  tasks:

Step 2: Write a descriptive task name.

Under tasks:, start writing your first task. Type the following line:


    - name: Ensure the latest version of apache2 is installed

Step 3: Receive the suggestion.

As you finish typing the name, Ansible Lightspeed will process the prompt. In a moment, you should see a “ghost text” suggestion appear, which will look something like this:


      ansible.builtin.apt:
        name: apache2
        state: latest

Step 4: Accept the code.

Simply press the Tab key, and the suggested code will be inserted into your file. Notice how it correctly identified the ansible.builtin.apt module for a Debian-based system (inferred from the ‘apache2’ package name) and set the state to latest as requested.

An Advanced Example: Managing Services and Configuration

Let’s try a more complex, multi-part prompt.


    - name: Ensure apache2 service is enabled on boot and started

The AI suggestion might be:


      ansible.builtin.service:
        name: apache2
        state: started
        enabled: true

Here, Lightspeed correctly interpreted “enabled on boot” and “started” into the respective parameters for the ansible.builtin.service module. This saves the user from having to remember the exact parameter names (enabled: true vs. enabled: yes).

Best Practices and Considerations

To get the most out of Ansible Lightspeed, it’s important to treat it as a powerful assistant and not a magic wand. Human oversight and good prompting are key.

Crafting Effective Prompts

The quality of the output is directly related to the quality of the input. A clear, specific task name will yield a much better result than a vague one.

  • Use Action Verbs: Start your prompts with verbs like “Install,” “Create,” “Ensure,” “Verify,” “Start,” or “Copy.”
  • Be Specific: Instead of “Configure the web server,” try “Copy the index.html template to /var/www/html/.”
  • Include Names and Paths: Mention package names (nginx), service names (httpd), user names (jdoe), and file paths (/etc/ssh/sshd_config) directly in the prompt.

The Human-in-the-Loop Principle

This is the most critical best practice. Ansible Lightspeed is a co-pilot, not the pilot. Always review, understand, and validate the code it generates before executing it, especially in production environments.

  • Review for Correctness: Does the code do what you intended? Are the parameters correct for your specific environment?
  • Test Thoroughly: Always test AI-generated code in a non-production environment first. Use Ansible’s --check mode (dry run) to see what changes would be made.
  • Understand the Logic: Don’t blindly accept code. Take a moment to understand which module is being used and why. This reinforces your own learning and ensures you can debug it later.

Frequently Asked Questions (FAQ)

Is Ansible Lightspeed free to use?

Ansible Lightspeed with IBM watsonx Code Assistant is a commercial offering that is part of the Ansible Automation Platform subscription. Red Hat provides this as a value-add for its customers to enhance automation development. While there may have been technical previews or trial periods, full, ongoing access is typically tied to a valid subscription. It is always best to check the official Red Hat product page for the most current pricing and packaging information.

How does Ansible Lightspeed handle my code and data? Is it secure?

Red Hat has a clear data privacy policy. The content of your Ansible Playbooks, including the prompts you write, is sent to the IBM watsonx Code Assistant service for processing. This data is used to provide the code suggestions back to you and to help improve the model over time. Red Hat is committed to data privacy and security, and commercial customers may have different data handling agreements. It is crucial to review the service’s terms and conditions and the official Ansible documentation regarding data handling to ensure it aligns with your organization’s compliance and security policies.

Does Ansible Lightspeed work with custom or third-party Ansible modules?

The model’s primary training data consists of official, certified, and widely used community collections from Ansible Galaxy. Therefore, it has the highest proficiency with these modules. While it may provide structurally correct YAML for a task involving a custom or private module, it will likely not know the specific parameters or unique behavior of that module. Its strength lies in the vast ecosystem of public Ansible content.

Can Ansible Lightspeed generate entire playbooks or just individual tasks?

Currently, the primary feature of Ansible Lightspeed is task-level code generation. It excels at taking a natural language description of a single task and converting it into a YAML snippet. However, Red Hat has announced plans for more advanced capabilities, including full playbook generation and content explanation, which are part of the future roadmap for the service. The technology is rapidly evolving, with new features being developed to address broader automation challenges.

Conclusion

Ansible Lightspeed represents a significant leap forward in the field of IT automation. By harnessing the power of generative AI through IBM watsonx Code Assistant, it transforms the often tedious process of writing playbooks into a more creative, efficient, and collaborative endeavor. It empowers novice users to contribute meaningfully from day one and provides seasoned experts with a powerful productivity tool to help them scale their impact.

However, the future of automation is not about replacing human expertise but augmenting it. The true potential of this technology is realized when it is used as a co-pilot—an intelligent assistant that handles the routine work, allowing developers and engineers to focus on a higher level of strategy, architecture, and problem-solving. By embracing tools like Ansible Lightspeed, organizations can accelerate their automation journey, improve the quality and consistency of their codebase, and ultimately deliver more value to their business faster than ever before. Thank you for reading the DevopsRoles page!

Red Hat Edge Explained: A Deep Dive into the Latest Ansible, OpenShift & RHEL Enhancements

The proliferation of IoT devices, the rollout of 5G networks, and the demand for real-time AI/ML processing have pushed computation away from centralized data centers and closer to where data is generated. This paradigm shift, known as edge computing, introduces a unique set of challenges. Managing thousands, or even millions, of distributed devices across diverse, often resource-constrained environments requires a new approach to deployment, management, and automation. This article provides a comprehensive deep dive into Red Hat Edge, a portfolio of technologies designed to solve these complex problems by extending a consistent, open hybrid cloud experience from the core datacenter to the farthest edge locations.

Understanding the Edge Computing Landscape

Before diving into the specifics of Red Hat’s offerings, it’s crucial to understand what “the edge” really means. It’s not a single location but a spectrum of environments, each with distinct requirements. Edge computing brings computation and data storage closer to the sources of data in order to improve response times and save bandwidth. Instead of sending data to a centralized cloud for processing, the work is done locally.

Types of Edge Deployments

  • Provider Edge: This tier is owned by telecommunications or service providers and is located close to the end-user, such as at a 5G cell tower site. It’s foundational for services like Cloud-RAN (C-RAN) and Multi-access Edge Computing (MEC).
  • Enterprise Edge: This includes on-premises infrastructure located in places like factory floors, retail stores, or hospital campuses. It powers applications for industrial automation, real-time inventory tracking, and medical imaging analysis.
  • Device Edge: This is the farthest edge, consisting of the devices themselves, such as smart cameras, industrial sensors, gateways, and point-of-sale systems. These devices are often highly resource-constrained.

The Core Challenges of the Edge

Operating at the edge introduces significant operational hurdles that traditional IT models struggle to address:

  • Massive Scale: Managing fleets of devices numbering in the thousands or millions is impossible without robust automation.
  • Intermittent Connectivity: Edge locations often have unreliable or limited network connectivity, requiring systems that can operate autonomously and sync when possible.
  • Physical and Network Security: Devices are often in physically insecure locations, making them targets. A strong security posture, from the hardware up to the application, is non-negotiable.
  • Limited Resources: Edge devices typically have limited CPU, memory, and storage, demanding lightweight and optimized software stacks.
  • Environmental Constraints: Devices may need to operate in harsh conditions with extreme temperatures, vibration, and limited physical access for maintenance.

A Comprehensive Overview of Red Hat Edge

Red Hat Edge is not a single product but an initiative that combines Red Hat’s core open-source platforms, optimized and integrated to address the unique challenges of edge computing. It provides a consistent application and operational platform that spans from the core data center to the physical edge. The goal is to enable organizations to build, deploy, and manage applications at the edge with the same tools and processes they use in their hybrid cloud environments.

The three foundational pillars of this initiative are:

  1. Red Hat Enterprise Linux (RHEL): Provides a flexible, secure, and intelligent operating system foundation optimized for edge workloads.
  2. Red Hat OpenShift: Extends a powerful, enterprise-grade Kubernetes platform to the edge, enabling containerized application orchestration at scale.
  3. Red Hat Ansible Automation Platform: Delivers the automation capabilities necessary to manage vast, distributed edge infrastructure consistently and efficiently.

Deep Dive: Red Hat Enterprise Linux (RHEL) for the Edge

The foundation of any stable edge deployment is the operating system. RHEL for Edge is specifically engineered to be a lightweight, immutable, and highly reliable OS for devices and systems operating outside the traditional datacenter. It introduces several key features tailored for the edge.

Immutable OS with RHEL for Edge

One of the most significant enhancements is the use of an immutable OS model, powered by rpm-ostree. Unlike traditional package-managed systems where individual packages can be updated, RHEL for Edge operates on an image-based model.

  • Atomic Updates: Updates are applied as a whole new OS image. The system boots into the new image, but the old one is kept. If an update fails or causes issues, the system can automatically roll back to the previous known-good state. This dramatically increases reliability and reduces the risk of failed updates bricking a remote device.
  • Consistency: Since every device running a specific image version is identical, it eliminates configuration drift and makes troubleshooting across a large fleet predictable.
  • In-place OS Upgrades: This model supports robust major version upgrades, simplifying the long-term lifecycle management of edge devices.

Enhanced Security and Footprint Optimization

Security is paramount at the edge. RHEL for Edge inherits the robust security features of standard RHEL, including SELinux, and enhances them for edge use cases.

  • Minimal Footprint: Edge images can be custom-built to include only the necessary packages, significantly reducing the attack surface and conserving precious storage resources.
  • Read-Only Filesystem: The core operating system is mounted as read-only, preventing unauthorized or accidental changes and enhancing the system’s security posture.
  • FIDO Device Onboarding: Simplifies the secure onboarding of edge devices at scale, providing an automated and secure mechanism for establishing trust and deploying initial configurations.

Image Builder for Simplified Deployments

Creating these custom, immutable images is streamlined through the RHEL Image Builder tool. It allows administrators to define the contents of an image using a simple blueprint file and then output that image in various formats suitable for edge deployments.

Example: A Simple Image Builder Blueprint

A blueprint is a TOML file that specifies the components and customizations for the image. Here is a conceptual example of a minimal blueprint for a kiosk device:

name = "edge-kiosk"
description = "A minimal RHEL for Edge image for a web kiosk"
version = "1.0.0"
modules = []
groups = ["core", "guest-agents"]

[[packages]]
name = "firefox"
version = "*"

[customizations]

[customizations.user]] name = “kioskuser” description = “Kiosk mode user” password = “$6$…” key = “ssh-ed25519 AAAA…” groups = [“wheel”]

This blueprint defines a basic image that includes Firefox and a specific user configuration, ready to be deployed to thousands of kiosk devices consistently.

Scaling Edge Operations with Red Hat OpenShift

For more complex edge locations that need to run multiple containerized applications or microservices, Red Hat OpenShift provides a consistent, powerful Kubernetes platform. OpenShift at the edge extends the familiar cloud-native development experience to remote locations, enabling DevOps practices across the entire infrastructure.

Single Node OpenShift (SNO)

For the most resource-constrained sites where high availability is secondary to footprint, Single Node OpenShift (SNO) is a game-changer. SNO packs both the control plane and worker node capabilities onto a single server.

  • Ultra-Small Footprint: It dramatically reduces the hardware requirements for running a full Kubernetes cluster, making it viable for locations like retail stores or small factory cells.
  • Full Kubernetes API: Despite its size, SNO provides the complete Kubernetes and OpenShift API, ensuring applications developed for a full cluster run without modification.
  • Centralized Management: SNO deployments can be managed at scale from a central hub cluster using Red Hat Advanced Cluster Management.

Three-Node Compact Clusters

For edge sites that require higher availability than SNO can provide, OpenShift offers a compact three-node cluster configuration. In this model, three nodes serve as both control planes and worker nodes. This provides a resilient, minimal-footprint HA solution without the need for separate dedicated control plane and worker nodes, striking a balance between resource consumption and reliability.

Managing Fleets at Scale with Advanced Cluster Management (ACM)

Managing hundreds or thousands of OpenShift clusters is the primary challenge that Red Hat Advanced Cluster Management for Kubernetes (ACM) solves. ACM provides a single control plane to manage the cluster and application lifecycle across the entire edge estate.

Key ACM Capabilities for Edge:

  • Zero Touch Provisioning (ZTP): ACM can automate the deployment of OpenShift clusters on bare metal servers at remote sites. A technician simply needs to rack the server and power it on; ACM handles the discovery and provisioning process.
  • Policy and Governance: Administrators can define and enforce configuration and security policies (e.g., ensuring all clusters have a specific security context constraint) across the entire fleet from a central console.
  • Application Lifecycle Management: ACM simplifies deploying and updating applications across multiple clusters using declarative GitOps principles.

Automating the Edge with Red Hat Ansible Automation Platform

Automation is the glue that binds an edge strategy together. Red Hat Ansible Automation Platform provides the agentless, human-readable automation needed to manage everything from the underlying OS to the network devices and applications at the edge.

Zero-Touch Provisioning and Configuration

Ansible plays a critical role in the initial setup and ongoing configuration of edge infrastructure. It can be used to:

  • Automate the provisioning of RHEL for Edge images onto bare metal devices.
  • Configure system settings, networking, and security parameters post-deployment.
  • Ensure that every device in the fleet adheres to a standardized configuration baseline.

Day 2 Operations and Compliance

Once deployed, the work is not over. Ansible helps manage the entire lifecycle of edge devices.

Example: A Simple Ansible Playbook Snippet

This conceptual playbook ensures a firewall service is running and a specific port is open on a group of edge devices.

---
- name: Configure Edge Device Firewall
  hosts: edge_devices
  become: yes
  tasks:
    - name: Ensure firewalld service is started and enabled
      ansible.builtin.service:
        name: firewalld
        state: started
        enabled: yes

    - name: Allow ingress traffic on port 8443
      ansible.posix.firewalld:
        port: 8443/tcp
        permanent: yes
        state: enabled
        immediate: yes

This simple, declarative automation can be applied to thousands of devices, ensuring consistent policy enforcement and reducing manual errors.

Integrating with Event-Driven Ansible

A recent powerful addition is Event-Driven Ansible. At the edge, this allows the infrastructure to react automatically to events from monitoring systems, sensors, or applications. For example, if a sensor on a factory floor reports a temperature anomaly, it could trigger an Ansible workflow to automatically restart a specific service or scale an application without human intervention, enabling true edge autonomy.

Frequently Asked Questions

What is the main difference between Red Hat Edge and a standard RHEL installation?

The primary difference lies in the operating system model. A standard RHEL installation uses a traditional package manager like DNF or YUM for granular package updates. Red Hat Edge, specifically RHEL for Edge, uses an immutable, image-based model powered by rpm-ostree. This provides atomic updates and rollbacks, ensuring greater reliability and consistency for remote, often inaccessible devices, which is critical in edge computing scenarios.

How does Red Hat OpenShift handle intermittent connectivity at the edge?

OpenShift is designed with disconnected and intermittently connected environments in mind. Clusters can be deployed using a local registry that contains all necessary container images, allowing them to function autonomously. Red Hat Advanced Cluster Management (ACM) is built to manage clusters that may go offline, queuing policies and application updates until the cluster reconnects to the management hub.

Can I use Ansible Automation Platform to manage non-Red Hat devices at the edge?

Yes, absolutely. One of Ansible’s greatest strengths is its vendor-agnostic and agentless nature. It has a vast ecosystem of modules that support managing a wide range of devices, including network switches, firewalls, IoT gateways, and systems running other operating systems like Windows or various Linux distributions. This makes it an ideal tool for heterogeneous edge environments.

Is Single Node OpenShift (SNO) suitable for production workloads?

Yes, SNO is fully supported for production workloads in use cases where the single point of failure at the hardware level is an acceptable risk. It’s ideal for environments with a large number of sites where a single server is sufficient for the workload, such as in retail stores, branch offices, or cell sites. For workloads requiring high availability at the site, a three-node compact cluster is the recommended architecture. For more details, consult the official OpenShift SNO documentation.

Conclusion

The edge is no longer a niche concept; it is the new frontier of enterprise IT. Successfully deploying and managing applications at the edge requires a purpose-built, integrated, and scalable platform. The Red Hat Edge initiative delivers this by combining the immutable foundation of RHEL for Edge, the powerful container orchestration of Red Hat OpenShift, and the comprehensive automation of the Ansible Automation Platform.

This powerful trio provides a consistent, secure, and manageable platform that extends from the hybrid cloud to the furthest reaches of the network. By leveraging these technologies, organizations can accelerate their edge initiatives, unlock new revenue streams, and gain a competitive advantage in a world increasingly driven by real-time data. For any organization serious about harnessing the power of edge computing, exploring the capabilities of the Red Hat Edge portfolio is a critical step toward building a future-proof, scalable, and automated infrastructure. Thank you for reading the DevopsRoles page!

Automating Serverless: How to Create and Invoke an OCI Function with Terraform

In the landscape of modern cloud computing, serverless architecture represents a significant paradigm shift, allowing developers to build and run applications without managing the underlying infrastructure. Oracle Cloud Infrastructure (OCI) Functions provides a powerful, fully managed, multi-tenant, and highly scalable serverless platform. While creating functions through the OCI console is straightforward for initial exploration, managing them at scale in a production environment demands a more robust, repeatable, and automated approach. This is where Infrastructure as Code (IaC) becomes indispensable.

This article provides a comprehensive guide on how to provision, manage, and invoke an OCI Function with Terraform. By leveraging Terraform, you can codify your entire serverless infrastructure, from the networking and permissions to the function itself, enabling version control, automated deployments, and consistent environments. We will walk through every necessary component, provide practical code examples, and explore advanced topics like invocation and integration with API Gateway, empowering you to build a fully automated serverless workflow on OCI.

Prerequisites for Deployment

Before diving into the Terraform code, it’s essential to ensure your environment is correctly set up. Fulfilling these prerequisites will ensure a smooth deployment process.

  • OCI Account and Permissions: You need an active Oracle Cloud Infrastructure account. Your user must have sufficient permissions to manage networking, IAM, functions, and container registry resources. A policy like Allow group <YourGroup> to manage all-resources in compartment <YourCompartment> is sufficient for this tutorial, but in production, you should follow the principle of least privilege.
  • Terraform Installed: Terraform CLI must be installed on the machine where you will run the deployment scripts. This guide assumes a basic understanding of Terraform concepts like providers, resources, and variables.
  • OCI Provider for Terraform: Your Terraform project must be configured to communicate with your OCI tenancy. This typically involves setting up an API key pair for your user and configuring the OCI provider with your user OCID, tenancy OCID, fingerprint, private key path, and region.
  • Docker: OCI Functions are packaged as Docker container images. You will need Docker installed locally to build your function’s image before pushing it to the OCI Container Registry (OCIR).
  • OCI CLI (Recommended): While not strictly required for Terraform deployment, the OCI Command Line Interface is an invaluable tool for testing, troubleshooting, and invoking your functions directly.

Core OCI Components for Functions

A serverless function doesn’t exist in a vacuum. It relies on a set of interconnected OCI resources that provide networking, identity, and storage. Understanding these components is key to writing effective Terraform configurations.

Compartment

A compartment is a logical container within your OCI tenancy used to organize and isolate your cloud resources. All resources for your function, including the VCN and the function application itself, will reside within a designated compartment.

Virtual Cloud Network (VCN) and Subnets

Every OCI Function must be associated with a subnet within a VCN. This allows the function to have a network presence, enabling it to connect to other OCI services (like databases or object storage) or external endpoints. It is a security best practice to place functions in private subnets, which do not have direct internet access. Access to other OCI services can be granted through a Service Gateway, and outbound internet access can be provided via a NAT Gateway.

OCI Container Registry (OCIR)

OCI Functions are deployed as Docker images. OCIR is a private, OCI-managed Docker registry where you store these images. Before Terraform can create the function, the corresponding Docker image must be built, tagged, and pushed to a repository in OCIR.

IAM Policies and Dynamic Groups

To interact with other OCI services, your function needs permissions. The best practice for granting these permissions is through Dynamic Groups and IAM Policies.

  • Dynamic Group: A group of OCI resources (like functions) that match rules you define. For example, you can create a dynamic group of all functions within a specific compartment.
  • IAM Policy: A policy grants a dynamic group specific permissions. For instance, a policy could allow all functions in a dynamic group to read objects from a specific OCI Object Storage bucket.

Application

In the context of OCI Functions, an Application is a logical grouping for one or more functions. It provides a way to define shared configuration, such as subnet association and logging settings, that apply to all functions within it. It also serves as a boundary for defining IAM policies.

Function

This is the core resource representing your serverless code. The Terraform resource defines metadata for the function, including the Docker image to use, the memory allocation, and the execution timeout.

Step-by-Step Guide: Creating an OCI Function with Terraform

Now, let’s translate the component knowledge into a practical, step-by-step implementation. We will build the necessary infrastructure and deploy a simple function.

Step 1: Project Setup and Provider Configuration

First, create a new directory for your project and add a provider.tf file to configure the OCI provider.

provider.tf:

terraform {
  required_providers {
    oci = {
      source  = "oracle/oci"
      version = "~> 5.0"
    }
  }
}

provider "oci" {
  tenancy_ocid     = var.tenancy_ocid
  user_ocid        = var.user_ocid
  fingerprint      = var.fingerprint
  private_key_path = var.private_key_path
  region           = var.region
}

Use a variables.tf file to manage your credentials and configuration, avoiding hardcoding sensitive information.

Step 2: Defining Networking Resources

Create a network.tf file to define the VCN and a private subnet for the function.

network.tf:

resource "oci_core_vcn" "fn_vcn" {
  compartment_id = var.compartment_ocid
  cidr_block     = "10.0.0.0/16"
  display_name   = "FunctionVCN"
}

resource "oci_core_subnet" "fn_subnet" {
  compartment_id = var.compartment_ocid
  vcn_id         = oci_core_vcn.fn_vcn.id
  cidr_block     = "10.0.1.0/24"
  display_name   = "FunctionSubnet"
  # This makes it a private subnet
  prohibit_public_ip_on_vnic = true 
}

# A Security List to allow necessary traffic (e.g., egress for OCI services)
resource "oci_core_security_list" "fn_security_list" {
  compartment_id = var.compartment_ocid
  vcn_id         = oci_core_vcn.fn_vcn.id
  display_name   = "FunctionSecurityList"

  egress_security_rules {
    protocol    = "all"
    destination = "0.0.0.0/0"
  }
}

Step 3: Creating the Function Application

Next, define the OCI Functions Application. This resource links your functions to the subnet you just created.

functions.tf:

resource "oci_functions_application" "test_application" {
  compartment_id = var.compartment_ocid
  display_name   = "my-terraform-app"
  subnet_ids     = [oci_core_subnet.fn_subnet.id]
}

Step 4: Preparing the Function Code and Image

This step happens outside of the main Terraform workflow but is a critical prerequisite. Terraform only manages the infrastructure; it doesn’t build your code or the Docker image.

  1. Create Function Code: Write a simple Python function. Create a file named func.py.


    import io
    import json

    def handler(ctx, data: io.BytesIO=None):
    name = "World"
    try:
    body = json.loads(data.getvalue())
    name = body.get("name")
    except (Exception, ValueError) as ex:
    print(str(ex))

    return { "message": "Hello, {}!".format(name) }


  2. Create func.yaml: This file defines metadata for the function.


    schema_version: 20180708
    name: my-tf-func
    version: 0.0.1
    runtime: python
    entrypoint: /python/bin/fdk /function/func.py handler
    memory: 256


  3. Build and Push the Image to OCIR:
    • First, log in to OCIR using Docker. Replace <region-key>, <tenancy-namespace>, and <your-username>. You’ll use an Auth Token as your password.

      $ docker login <region-key>.ocir.io -u <tenancy-namespace>/<your-username>


    • Next, build, tag, and push the image.

      # Define image name variable

      $ export IMAGE_NAME=<region-key>.ocir.io/<tenancy-namespace>/my-repo/my-tf-func:0.0.1


      # Build the image using the OCI Functions build image

      $ fn build


      # Tag the locally built image with the full OCIR path

      $ docker tag my-tf-func:0.0.1 ${IMAGE_NAME}


      # Push the image to OCIR

      $ docker push ${IMAGE_NAME}


The IMAGE_NAME value is what you will provide to your Terraform configuration.

Step 5: Defining the OCI Function Resource

Now, add the oci_functions_function resource to your functions.tf file. This resource points to the image you just pushed to OCIR.

functions.tf (updated):

# ... (oci_functions_application resource from before)

resource "oci_functions_function" "test_function" {
  application_id = oci_functions_application.test_application.id
  display_name   = "my-terraform-function"
  image          = var.function_image_name # e.g., "phx.ocir.io/your_namespace/my-repo/my-tf-func:0.0.1"
  memory_in_mbs  = 256
  timeout_in_seconds = 30
}

Add the function_image_name to your variables.tf file and provide the full image path.

Step 6: Deploy with Terraform

With all the configuration in place, you can now deploy your serverless infrastructure.

  1. Initialize Terraform: terraform init
  2. Plan the Deployment: terraform plan
  3. Apply the Configuration: terraform apply

After you confirm the apply step, Terraform will provision the VCN, subnet, application, and function in your OCI tenancy.

Invoking Your Deployed Function

Once deployed, there are several ways to invoke your function. Using Terraform to manage an OCI Function with Terraform also extends to its invocation for testing or integration purposes.

Invocation via OCI CLI

The most direct way to test your function is with the OCI CLI. You’ll need the function’s OCID, which you can get from the Terraform output.

# Get the function OCID
$ FUNCTION_OCID=$(terraform output -raw function_ocid)

# Invoke the function with a payload
$ oci fn function invoke --function-id ${FUNCTION_OCID} --body '{"name": "Terraform"}' output.json

# View the result
$ cat output.json
{"message":"Hello, Terraform!"}

Invocation via Terraform Data Source

Terraform can also invoke a function during a plan or apply using the oci_functions_invoke_function data source. This is useful for performing a quick smoke test after deployment or for chaining infrastructure deployments where one step depends on a function’s output.

data "oci_functions_invoke_function" "test_invocation" {
  function_id      = oci_functions_function.test_function.id
  invoke_function_body = "{\"name\": \"Terraform Data Source\"}"
}

output "function_invocation_result" {
  value = data.oci_functions_invoke_function.test_invocation.content
}

Running terraform apply again will trigger this data source, invoke the function, and place the result in the `function_invocation_result` output.

Exposing the Function via API Gateway

For functions that need to be triggered via an HTTP endpoint, the standard practice is to use OCI API Gateway. You can also manage the API Gateway configuration with Terraform, creating a complete end-to-end serverless API.

Here is a basic example of an API Gateway that routes a request to your function:

resource "oci_apigateway_gateway" "fn_gateway" {
  compartment_id = var.compartment_ocid
  endpoint_type  = "PUBLIC"
  subnet_id      = oci_core_subnet.fn_subnet.id # Can be a different, public subnet
  display_name   = "FunctionAPIGateway"
}

resource "oci_apigateway_deployment" "fn_api_deployment" {
  gateway_id     = oci_apigateway_gateway.fn_gateway.id
  compartment_id = var.compartment_ocid
  path_prefix    = "/v1"

  specification {
    routes {
      path    = "/greet"
      methods = ["GET", "POST"]
      backend {
        type         = "ORACLE_FUNCTIONS_BACKEND"
        function_id  = oci_functions_function.test_function.id
      }
    }
  }
}

This configuration creates a public API endpoint. A POST request to <gateway-invoke-url>/v1/greet would trigger your function.

Frequently Asked Questions

Can I manage the function’s source code directly with Terraform?
No, Terraform is an Infrastructure as Code tool, not a code deployment tool. It manages the OCI resource definition (memory, timeout, image pointer). The function’s source code must be built into a Docker image and pushed to a registry separately. This process is typically handled by a CI/CD pipeline (e.g., OCI DevOps, Jenkins, GitHub Actions).
How do I securely manage secrets and configuration for my OCI Function?
The recommended approach is to use the config map within the oci_functions_function resource for non-sensitive configuration. For secrets like API keys or database passwords, you should use OCI Vault. Store the secret OCID in the function’s configuration, and grant the function IAM permissions to read that secret from the Vault at runtime.
What is the difference between `terraform apply` and the `fn deploy` command?
The fn CLI’s deploy command is a convenience utility that combines multiple steps: it builds the Docker image, pushes it to OCIR, and updates the function resource on OCI. In contrast, the Terraform approach decouples these concerns. The image build/push is a separate CI step, and `terraform apply` handles only the declarative update of the OCI infrastructure. This separation is more robust and suitable for production GitOps workflows.
How can I automate the image push before running `terraform apply`?
This is a classic use case for a CI/CD pipeline. The pipeline would have stages:

  1. Build: Checkout the code, build the Docker image.
  2. Push: Tag the image (e.g., with the Git commit hash) and push it to OCIR.
  3. Deploy: Run `terraform apply`, passing the new image tag as a variable. This ensures the infrastructure update uses the latest version of your function code.

Conclusion

Automating the lifecycle of an OCI Function with Terraform transforms serverless development from a manual, click-based process into a reliable, version-controlled, and collaborative practice. By defining your networking, applications, and functions as code, you gain unparalleled consistency across environments, reduce the risk of human error, and create a clear audit trail of all infrastructure changes.

This guide has walked you through the entire process, from setting up prerequisites to defining each necessary OCI component and finally deploying and invoking the function. By integrating this IaC approach into your development workflow, you unlock the full potential of serverless on Oracle Cloud, building scalable, resilient, and efficiently managed applications. Thank you for reading the DevopsRoles page!

Automating Serverless Batch Prediction with Google Cloud Run and Terraform

In the world of machine learning operations (MLOps), deploying models is only half the battle. A critical, and often recurring, task is running predictions on large volumes of data—a process known as batch prediction. Traditionally, this required provisioning and managing dedicated servers or complex compute clusters, leading to high operational overhead and inefficient resource utilization. This article tackles this challenge head-on by providing a comprehensive guide to building a robust, cost-effective, and fully automated pipeline for Serverless Batch Prediction using Google Cloud Run Jobs and Terraform.

By leveraging the power of serverless computing with Cloud Run and the declarative infrastructure-as-code (IaC) approach of Terraform, you will learn how to create a system that runs on-demand, scales to zero, and is perfectly reproducible. This eliminates the need for idle infrastructure, drastically reduces costs, and allows your team to focus on model development rather than server management.

Understanding the Core Components

Before diving into the implementation, it’s essential to understand the key technologies that form the foundation of our serverless architecture. Each component plays a specific and vital role in creating an efficient and automated prediction pipeline.

What is Batch Prediction?

Batch prediction, or offline inference, is the process of generating predictions for a large set of observations simultaneously. Unlike real-time prediction, which provides immediate responses for single data points, batch prediction operates on a dataset (a “batch”) at a scheduled time or on-demand. Common use cases include:

  • Daily Fraud Detection: Analyzing all of the previous day’s transactions for fraudulent patterns.
  • Customer Segmentation: Grouping an entire customer database into segments for marketing campaigns.
  • Product Recommendations: Pre-calculating recommendations for all users overnight.
  • Risk Assessment: Scoring a portfolio of loan applications at the end of the business day.

The primary advantage is computational efficiency, as the model and data can be loaded once to process millions of records.

Why Google Cloud Run for Serverless Jobs?

Google Cloud Run is a managed compute platform that enables you to run stateless containers. While many associate it with web services, its “Jobs” feature is specifically designed for containerized tasks that run to completion. This makes it an ideal choice for batch processing workloads.

Key benefits of Cloud Run Jobs include:

  • Pay-per-use: You are only billed for the exact CPU and memory resources consumed during the job’s execution, down to the nearest 100 milliseconds. When the job isn’t running, you pay nothing.
  • Scales to Zero: There is no underlying infrastructure to manage or pay for when your prediction job is idle.
  • Container-based: You can package your application, model, and all its dependencies into a standard container image, ensuring consistency across environments. This gives you complete control over your runtime and libraries (e.g., Python, R, Go).
  • High Concurrency: A single Cloud Run Job can be configured to run multiple parallel container instances (tasks) to process large datasets faster.

The Role of Terraform for Infrastructure as Code (IaC)

Terraform is an open-source tool that allows you to define and provision infrastructure using a declarative configuration language. Instead of manually clicking through the Google Cloud Console to create resources, you describe your desired state in code. This is a cornerstone of modern DevOps and MLOps.

Using Terraform for this project provides:

  • Reproducibility: Guarantees that the exact same infrastructure can be deployed in different environments (dev, staging, prod).
  • Version Control: Your infrastructure configuration can be stored in Git, tracked, reviewed, and rolled back just like application code.
  • Automation: The entire setup—from storage buckets to IAM permissions and the Cloud Run Job itself—can be created or destroyed with a single command.
  • Clarity: The Terraform files serve as clear documentation of all the components in your architecture.

Architecting a Serverless Batch Prediction Pipeline

Our goal is to build a simple yet powerful pipeline that can be triggered to perform predictions on data stored in Google Cloud Storage (GCS).

System Architecture Overview

The data flow for our pipeline is straightforward:

  1. Input Data: Raw data for prediction (e.g., a CSV file) is uploaded to a designated GCS bucket.
  2. Trigger: The process is initiated. This can be done manually via the command line, on a schedule using Cloud Scheduler, or in response to an event (like a file upload). For this guide, we’ll focus on manual and scheduled execution.
  3. Execution: The trigger invokes a Google Cloud Run Job.
  4. Processing: The Cloud Run Job spins up one or more container instances. Each container runs our Python application, which:
    • Downloads the pre-trained ML model and the input data from GCS.
    • Performs the predictions.
    • Uploads the results (e.g., a new CSV with a predictions column) to a separate output GCS bucket.
  5. Completion: Once the processing is finished, the Cloud Run Job terminates, and all compute resources are released.

Prerequisites and Setup

Before you begin, ensure you have the following tools installed and configured:

  • Google Cloud SDK: Authenticated and configured with a default project (`gcloud init`).
  • Terraform: Version 1.0 or newer.
  • Docker: To build and test the container image locally.
  • Enabled APIs: Ensure the following APIs are enabled in your GCP project: Cloud Run API (`run.googleapis.com`), Artifact Registry API (`artifactregistry.googleapis.com`), Cloud Build API (`cloudbuild.googleapis.com`), and IAM API (`iam.googleapis.com`). You can enable them with `gcloud services enable [API_NAME]`.

Building and Containerizing the Prediction Application

The core of our Cloud Run Job is a containerized application that performs the actual prediction. We’ll use Python with Pandas and Scikit-learn for this example.

The Python Prediction Script

First, let’s create a simple prediction script. Assume we have a pre-trained logistic regression model saved as `model.pkl`. This script will read a CSV from an input bucket, add a prediction column, and save it to an output bucket.

Create a file named main.py:

import os
import pandas as pd
import joblib
from google.cloud import storage

# --- Configuration ---
# Get environment variables passed by Cloud Run
PROJECT_ID = os.environ.get('GCP_PROJECT')
INPUT_BUCKET = os.environ.get('INPUT_BUCKET')
OUTPUT_BUCKET = os.environ.get('OUTPUT_BUCKET')
MODEL_FILE = 'model.pkl' # The name of your model file in the input bucket
INPUT_FILE = 'data.csv'   # The name of the input data file

# Initialize GCS client
storage_client = storage.Client()

def download_blob(bucket_name, source_blob_name, destination_file_name):
    """Downloads a blob from the bucket."""
    bucket = storage_client.bucket(bucket_name)
    blob = bucket.blob(source_blob_name)
    blob.download_to_filename(destination_file_name)
    print(f"Blob {source_blob_name} downloaded to {destination_file_name}.")

def upload_blob(bucket_name, source_file_name, destination_blob_name):
    """Uploads a file to the bucket."""
    bucket = storage_client.bucket(bucket_name)
    blob = bucket.blob(destination_blob_name)
    blob.upload_from_filename(source_file_name)
    print(f"File {source_file_name} uploaded to {destination_blob_name}.")

def main():
    """Main prediction logic."""
    local_model_path = f"/tmp/{MODEL_FILE}"
    local_input_path = f"/tmp/{INPUT_FILE}"
    local_output_path = f"/tmp/predictions.csv"

    # 1. Download model and data from GCS
    print("--- Downloading artifacts ---")
    download_blob(INPUT_BUCKET, MODEL_FILE, local_model_path)
    download_blob(INPUT_BUCKET, INPUT_FILE, local_input_path)

    # 2. Load model and data
    print("--- Loading model and data ---")
    model = joblib.load(local_model_path)
    data_df = pd.read_csv(local_input_path)

    # 3. Perform prediction (assuming model expects all columns except a target)
    print("--- Performing prediction ---")
    # For this example, we assume all columns are features.
    # In a real scenario, you'd select specific feature columns.
    predictions = model.predict(data_df)
    data_df['predicted_class'] = predictions

    # 4. Save results locally and upload to GCS
    print("--- Uploading results ---")
    data_df.to_csv(local_output_path, index=False)
    upload_blob(OUTPUT_BUCKET, local_output_path, 'predictions.csv')
    
    print("--- Batch prediction job finished successfully! ---")

if __name__ == "__main__":
    main()

And a requirements.txt file:

pandas
scikit-learn
joblib
google-cloud-storage
gcsfs

Creating the Dockerfile

Next, we need to package this application into a Docker container. Create a file named Dockerfile:

# Use an official Python runtime as a parent image
FROM python:3.9-slim

# Set the working directory
WORKDIR /app

# Copy the requirements file into the container
COPY requirements.txt .

# Install any needed packages specified in requirements.txt
RUN pip install --no-cache-dir -r requirements.txt

# Copy the content of the local src directory to the working directory
COPY main.py .

# Define the command to run the application
CMD ["python", "main.py"]

Building and Pushing the Container to Artifact Registry

We’ll use Google Cloud Build to build our Docker image and push it to Artifact Registry, Google’s recommended container registry.

  1. Create an Artifact Registry repository:

    gcloud artifacts repositories create batch-prediction-repo --repository-format=docker --location=us-central1 --description="Repo for batch prediction jobs"
  2. Build and push the image using Cloud Build:

    Replace `[PROJECT_ID]` with your GCP project ID.


    gcloud builds submit --tag us-central1-docker.pkg.dev/[PROJECT_ID]/batch-prediction-repo/prediction-job:latest .

This command packages your code, sends it to Cloud Build, builds the Docker image, and pushes the tagged image to your repository. Now your container is ready for deployment.

Implementing the Infrastructure with Terraform for Serverless Batch Prediction

With our application containerized, we can now define the entire supporting infrastructure using Terraform. This section covers the core resource definitions for achieving our Serverless Batch Prediction pipeline.

Create a file named main.tf.

Setting up the Terraform Provider

First, we configure the Google Cloud provider.

terraform {
  required_providers {
    google = {
      source  = "hashicorp/google"
      version = "~> 4.50"
    }
  }
}

provider "google" {
  project = "your-gcp-project-id" # Replace with your Project ID
  region  = "us-central1"
}

Defining GCP Resources

Now, let’s define each piece of our infrastructure in code.

Service Account and IAM Permissions

It’s a best practice to run services with dedicated, least-privilege service accounts.

# Service Account for the Cloud Run Job
resource "google_service_account" "job_sa" {
  account_id   = "batch-prediction-job-sa"
  display_name = "Service Account for Batch Prediction Job"
}

# Grant the Service Account permissions to read/write to GCS
resource "google_project_iam_member" "storage_admin_binding" {
  project = provider.google.project
  role    = "roles/storage.objectAdmin"
  member  = "serviceAccount:${google_service_account.job_sa.email}"
}

Google Cloud Storage Buckets

We need two buckets: one for input data and the model, and another for the prediction results. We use the random_pet resource to ensure unique bucket names.

resource "random_pet" "suffix" {
  length = 2
}

resource "google_storage_bucket" "input_bucket" {
  name          = "batch-pred-input-${random_pet.suffix.id}"
  location      = "US"
  force_destroy = true # Use with caution in production
}

resource "google_storage_bucket" "output_bucket" {
  name          = "batch-pred-output-${random_pet.suffix.id}"
  location      = "US"
  force_destroy = true # Use with caution in production
}

The Cloud Run Job Resource

This is the central part of our Terraform configuration. We define the Cloud Run Job, pointing it to our container image and configuring its environment.

resource "google_cloud_run_v2_job" "batch_prediction_job" {
  name     = "batch-prediction-job"
  location = provider.google.region

  template {
    template {
      service_account = google_service_account.job_sa.email
      containers {
        image = "us-central1-docker.pkg.dev/${provider.google.project}/batch-prediction-repo/prediction-job:latest"
        
        resources {
          limits = {
            cpu    = "1"
            memory = "512Mi"
          }
        }

        env {
          name  = "INPUT_BUCKET"
          value = google_storage_bucket.input_bucket.name
        }

        env {
          name  = "OUTPUT_BUCKET"
          value = google_storage_bucket.output_bucket.name
        }
      }
      # Set a timeout for the job to avoid runaway executions
      timeout = "600s" # 10 minutes
    }
  }
}

Applying the Terraform Configuration

With the `main.tf` file complete, you can deploy the infrastructure:

  1. Initialize Terraform: terraform init
  2. Review the plan: terraform plan
  3. Apply the configuration: terraform apply

After you confirm the changes, Terraform will create the service account, GCS buckets, and the Cloud Run Job in your GCP project.

Executing and Monitoring the Batch Job

Once your infrastructure is deployed, you can run and monitor the prediction job.

Manual Execution

  1. Upload data: Upload your `model.pkl` and `data.csv` files to the newly created input GCS bucket.
  2. Execute the job: Use the `gcloud` command to start an execution.

    gcloud run jobs execute batch-prediction-job --region=us-central1

This command will trigger the Cloud Run Job. You can monitor its progress in the Google Cloud Console or via the command line.

Monitoring and Logging

You can find detailed logs for each job execution in Google Cloud’s operations suite (formerly Stackdriver).

  • Cloud Logging: Go to the Cloud Run section of the console, find your job, and view the “LOGS” tab. Any `print` statements from your Python script will appear here, which is invaluable for debugging.
  • Cloud Monitoring: Key metrics such as execution count, failure rate, and execution duration are automatically collected and can be viewed in dashboards or used to create alerts.

For more details, you can refer to the official Google Cloud Run monitoring documentation.

Frequently Asked Questions

What is the difference between Cloud Run Jobs and Cloud Functions for batch processing?

While both are serverless, Cloud Run Jobs are generally better for batch processing. Cloud Functions have shorter execution timeouts (max 9 minutes for 1st gen, 60 minutes for 2nd gen), whereas Cloud Run Jobs can run for up to 60 minutes by default and can be configured for up to 24 hours (in preview). Furthermore, Cloud Run’s container-based approach offers more flexibility for custom runtimes and heavy dependencies that might not fit easily into a Cloud Function environment.

How do I handle secrets like database credentials or API keys in my Cloud Run Job?

The recommended approach is to use Google Secret Manager. You can store your secrets securely and then grant your Cloud Run Job’s service account permission to access them. Within the Terraform configuration (or console), you can mount these secrets directly as environment variables or as files in the container’s filesystem. This avoids hardcoding sensitive information in your container image.

Can I scale my job to process data faster?

Yes. The `google_cloud_run_v2_job` resource in Terraform supports `task_count` and `parallelism` arguments within its template. `task_count` defines how many total container instances will be run for the job. `parallelism` defines how many of those instances can run concurrently. By increasing these values, you can split your input data and process it in parallel, significantly reducing the total execution time for large datasets. This requires your application logic to be designed to handle a specific subset of the data.

For more details, see the Terraform documentation for `google_cloud_run_v2_job`.

Conclusion

By combining Google Cloud Run Jobs with Terraform, you can build a powerful, efficient, and fully automated framework for Serverless Batch Prediction. This approach liberates you from the complexities of infrastructure management, allowing you to deploy machine learning inference pipelines that are both cost-effective and highly scalable. The infrastructure-as-code model provided by Terraform ensures your deployments are repeatable, version-controlled, and transparent.

Adopting this serverless pattern not only modernizes your MLOps stack but also empowers your data science and engineering teams to deliver value faster. You can now run complex prediction jobs on-demand or on a schedule, paying only for the compute you use, and scaling effortlessly from zero to thousands of parallel tasks. This is the future of operationalizing machine learning models in the cloud. Thank you for reading the DevopsRoles page!