Tag Archives: DevOps

DevOps as a Service (DaaS): The Future of Development?

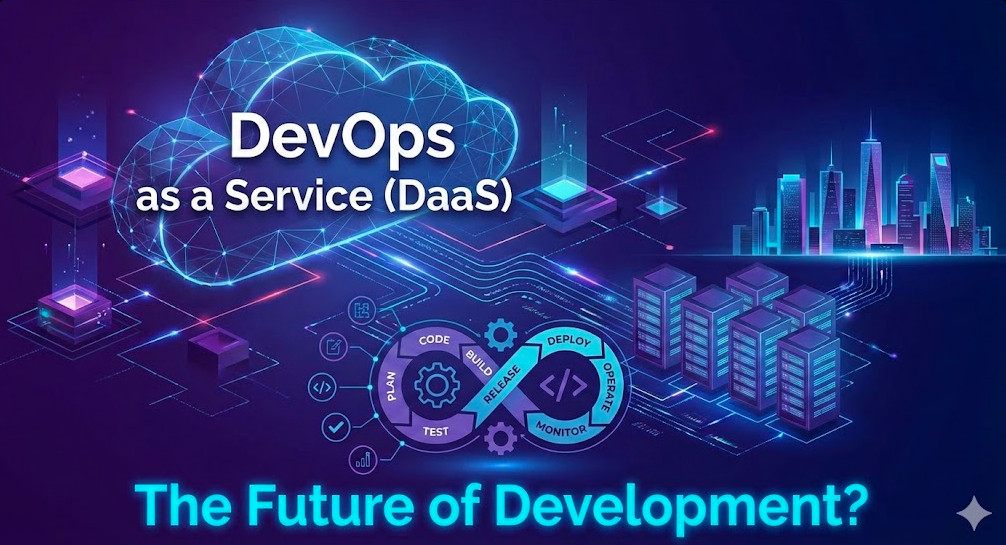
For years, the industry mantra has been “You build it, you run it.” While this philosophy dismantled silos, it also burdened expert engineering teams with cognitive overload. The sheer complexity of the modern cloud-native landscape—Kubernetes orchestration, Service Mesh implementation, compliance automation, and observability stacks—has birthed a new operational model: DevOps as a Service (DaaS).

This isn’t just about outsourcing CI/CD pipelines. For the expert SRE or Senior DevOps Architect, DaaS represents a fundamental shift from building bespoke infrastructure to consuming standardized, managed platforms. Whether you are building an Internal Developer Platform (IDP) or leveraging a third-party managed service, adopting a DevOps as a Service model aims to decouple developer velocity from infrastructure complexity.

The Architectural Shift: Defining DaaS for the Enterprise

At an expert level, DevOps as a Service is the commoditization of the DevOps toolchain. It transforms the role of the DevOps engineer from a “ticket resolver” and “script maintainer” to a “Platform Engineer.”

The core value proposition addresses the scalability of human capital. If every microservice requires bespoke Helm charts, unique Terraform state files, and custom pipeline logic, the operational overhead scales linearly with the number of services. DaaS abstracts this into a “Vending Machine” model.

Architectural Note: In a mature DaaS implementation, the distinction between “Infrastructure” and “Application” blurs. The platform provides “Golden Paths”—pre-approved, secure, and compliant templates that developers consume via self-service APIs.

Anatomy of a Production-Grade DaaS Platform

A robust DevOps as a Service strategy rests on three technical pillars. It is insufficient to simply subscribe to a SaaS CI tool; the integration layer is where the complexity lies.

1. The Abstracted CI/CD Pipeline

In a DaaS model, pipelines are treated as products. Rather than copy-pasting .gitlab-ci.yml or Jenkinsfiles, teams inherit centralized pipeline libraries. This allows the Platform team to roll out security scanners (SAST/DAST) or policy checks globally by updating a single library version.

2. Infrastructure as Code (IaC) Abstraction

The DaaS approach moves away from raw resource definitions. Instead of defining an AWS S3 bucket directly, a developer defines a “Storage Capability” which the platform resolves to an encrypted, compliant, and tagged S3 bucket.

Here is an example of how a DaaS module might abstract complexity using Terraform:

# The Developer Interface (Simple, Intent-based)
module "microservice_stack" {
  source      = "git::https://internal-daas/modules/app-stack.git?ref=v2.4.0"
  app_name    = "payment-service"
  environment = "production"
  # DaaS handles VPC peering, IAM roles, and SG rules internally
  expose_publicly = false 
}

# The Platform Engineering Implementation (Complex, Opinionated)
# Inside the module, we enforce organization-wide standards
resource "aws_s3_bucket" "logs" {
  bucket = "${var.app_name}-${var.environment}-logs"
  
  # Enforced Compliance
  server_side_encryption_configuration {
    rule {
      apply_server_side_encryption_by_default {
        sse_algorithm = "AES256"
      }
    }
  }
}

This abstraction ensures that Infrastructure as Code remains consistent across hundreds of repositories, mitigating “configuration drift.”

Build vs. Buy: The Technical Trade-offs

For the Senior Staff Engineer, the decision to implement DevOps as a Service often comes down to a “Build vs. Buy” analysis. Are you building an internal DaaS (Platform Engineering) or hiring an external DaaS provider?

FactorInternal DaaS (Platform Eng.)External Managed DaaS
ControlHigh. Full customizability of the toolchain.Medium/Low. constrained by vendor opinion.
Day 2 OperationsHigh burden. You own the uptime of the CI/CD stack.Low. SLAs guaranteed by the vendor.
Cost ModelCAPEX heavy (Engineering hours).OPEX heavy (Subscription fees).
ComplianceMust build custom controls for SOC2/HIPAA.Often inherits vendor compliance certifications.

Pro-Tip: Avoid the “Not Invented Here” syndrome. If your core business isn’t infrastructure, an external DaaS partner or a highly opinionated managed platform (like Heroku or Vercel for enterprise) is often the superior strategic choice to reduce Time-to-Market.

Security Implications: The Shared Responsibility Model

Adopting DevOps as a Service introduces a specific set of security challenges. When you centralize DevOps logic, you create a high-value target for attackers. A compromise of the DaaS pipeline can lead to a supply chain attack, injecting malicious code into every artifact built by the system.

Hardening the DaaS Interface

  • Least Privilege: The DaaS agent (e.g., GitHub Actions Runner, Jenkins Agent) must have ephemeral permissions. Use OIDC (OpenID Connect) to assume roles rather than storing long-lived AWS_ACCESS_KEY_ID secrets.
  • Policy as Code: Implement Open Policy Agent (OPA) to gate deployments. The DaaS platform should reject any infrastructure request that violates compliance rules (e.g., creating a public Load Balancer in a PCI-DSS environment).
  • Artifact Signing: Ensure the DaaS pipeline signs container images (using tools like Cosign) so that the Kubernetes admission controller only allows trusted images to run.

Frequently Asked Questions (FAQ)

How does DaaS differ from PaaS (Platform as a Service)?

PaaS (like Google App Engine) provides the runtime environment for applications. DevOps as a Service focuses on the delivery pipeline—the tooling, automation, and processes that get code from commit to the PaaS or IaaS. DaaS manages the “How,” while PaaS provides the “Where.”

Is DevOps as a Service cost-effective for large enterprises?

It depends on your “Undifferentiated Heavy Lifting.” If your expensive DevOps engineers are spending 40% of their time patching Jenkins or upgrading K8s clusters, moving to a DaaS model (managed or internal platform) yields a massive ROI by freeing them to focus on application reliability and performance tuning.

What are the risks of vendor lock-in with DaaS?

High. If you build your entire delivery flow around a proprietary DaaS provider’s specific YAML syntax or plugins, migrating away becomes a refactoring nightmare. To mitigate this, rely on open standards like Docker, Kubernetes, and Terraform, using the DaaS provider merely as the orchestrator rather than the logic holder.

Conclusion

DevOps as a Service is not merely a trend; it is the industrialization of software delivery. For expert practitioners, it signals a move away from “crafting” servers to “engineering” platforms.

Whether you choose to build an internal platform or leverage a managed service, the goal remains the same: reduce cognitive load for developers and increase deployment velocity without sacrificing stability. As we move toward 2026, the organizations that succeed will be those that treat their DevOps capabilities not as a series of tickets, but as a reliable, scalable product.

Ready to architect your platform strategy? Start by auditing your current “Day 2” operational costs to determine if a DaaS migration is your next logical step. Thank you for reading the DevopsRoles page!

Master AWS Batch: Terraform Deployment on Amazon EKS

For years, AWS Batch and Amazon EKS (Elastic Kubernetes Service) operated in parallel universes. Batch excelled at queue management and compute provisioning for high-throughput workloads, while Kubernetes won the war for container orchestration. With the introduction of AWS Batch support for EKS, we can finally unify these paradigms.

This convergence allows you to leverage the robust job scheduling of AWS Batch while utilizing the namespace isolation, sidecars, and familiarity of your existing EKS clusters. However, orchestrating this integration via Infrastructure as Code (IaC) is non-trivial. It requires precise IAM trust relationships, Kubernetes RBAC (Role-Based Access Control) configuration, and specific compute environment parameters.

In this guide, we will bypass the GUI entirely. We will architect and deploy a production-ready AWS Batch Terraform EKS solution, focusing on the nuances that trip up even experienced engineers.

GigaCode Pro-Tip:
Unlike standard EC2 compute environments, AWS Batch on EKS does not manage the EC2 instances directly. Instead, it submits Pods to your cluster. This means your EKS Nodes (Node Groups) must already exist and scale appropriately (e.g., using Karpenter or Cluster Autoscaler) to handle the pending Pods injected by Batch.

Architecture: How Batch Talks to Kubernetes

Before writing Terraform, understand the control flow:

  1. Job Submission: You submit a job to an AWS Batch Job Queue.
  2. Translation: AWS Batch translates the job definition into a Kubernetes PodSpec.
  3. API Call: The AWS Batch Service Principal interacts with the EKS Control Plane (API Server) to create the Pod.
  4. Execution: The Pod is scheduled on an available node in your EKS cluster.

This flow implies two critical security boundaries we must bridge with Terraform: IAM (AWS permissions) and RBAC (Kubernetes permissions).

Step 1: IAM Roles for Batch Service

AWS Batch needs a specific service-linked role or a custom IAM role to communicate with the EKS cluster. For strict security, we define a custom role.

resource "aws_iam_role" "batch_eks_service_role" {
  name = "aws-batch-eks-service-role"

  assume_role_policy = jsonencode({
    Version = "2012-10-17"
    Statement = [
      {
        Action = "sts:AssumeRole"
        Effect = "Allow"
        Principal = {
          Service = "batch.amazonaws.com"
        }
      }
    ]
  })
}

resource "aws_iam_role_policy_attachment" "batch_eks_policy" {
  role       = aws_iam_role.batch_eks_service_role.name
  policy_arn = "arn:aws:iam::aws:policy/AWSBatchServiceRole"
}

Step 2: Preparing the EKS Cluster (RBAC)

This is the most common failure point for AWS Batch Terraform EKS deployments. Even with the correct IAM role, Batch cannot schedule Pods if the Kubernetes API rejects the request.

We must map the IAM role created in Step 1 to a Kubernetes user, then grant that user permissions via a ClusterRole and ClusterRoleBinding. We can use the HashiCorp Kubernetes Provider for this.

2.1 Define the ClusterRole

resource "kubernetes_cluster_role" "aws_batch_cluster_role" {
  metadata {
    name = "aws-batch-cluster-role"
  }

  rule {
    api_groups = [""]
    resources  = ["namespaces"]
    verbs      = ["get", "list", "watch"]
  }

  rule {
    api_groups = [""]
    resources  = ["nodes"]
    verbs      = ["get", "list", "watch"]
  }

  rule {
    api_groups = [""]
    resources  = ["pods"]
    verbs      = ["get", "list", "watch", "create", "delete", "patch"]
  }

  rule {
    api_groups = ["rbac.authorization.k8s.io"]
    resources  = ["clusterroles", "clusterrolebindings"]
    verbs      = ["get", "list"]
  }
}

2.2 Bind the Role to the IAM User

You must ensure the IAM role ARN matches the user configured in your aws-auth ConfigMap (or EKS Access Entries if using the newer API). Here, we create the binding assuming the user is mapped to aws-batch.

resource "kubernetes_cluster_role_binding" "aws_batch_cluster_role_binding" {
  metadata {
    name = "aws-batch-cluster-role-binding"
  }

  role_ref {
    api_group = "rbac.authorization.k8s.io"
    kind      = "ClusterRole"
    name      = kubernetes_cluster_role.aws_batch_cluster_role.metadata[0].name
  }

  subject {
    kind      = "User"
    name      = "aws-batch" # This must match the username in aws-auth
    api_group = "rbac.authorization.k8s.io"
  }
}

Step 3: The Terraform Compute Environment

Now we define the aws_batch_compute_environment resource. The key differentiator here is the compute_resources block type, which must be set to FARGATE_SPOT, FARGATE, EC2, or SPOT, and strictly linked to the EKS configuration.

resource "aws_batch_compute_environment" "eks_batch_ce" {
  compute_environment_name = "eks-batch-compute-env"
  type                     = "MANAGED"
  service_role             = aws_iam_role.batch_eks_service_role.arn

  eks_configuration {
    eks_cluster_arn      = data.aws_eks_cluster.main.arn
    kubernetes_namespace = "batch-jobs" # Ensure this namespace exists!
  }

  compute_resources {
    type               = "EC2" # Or FARGATE
    max_vcpus          = 256
    min_vcpus          = 0
    
    # Note: For EKS, security_group_ids and subnets might be ignored 
    # if you are relying on existing Node Groups, but are required for validation.
    security_group_ids = [aws_security_group.batch_sg.id]
    subnets            = module.vpc.private_subnets
    
    instance_types = ["c5.large", "m5.large"]
  }

  depends_on = [
    aws_iam_role_policy_attachment.batch_eks_policy,
    kubernetes_cluster_role_binding.aws_batch_cluster_role_binding
  ]
}

Technical Note:
When using EKS, the instance_types and subnets defined in the Batch Compute Environment are primarily used by Batch to calculate scaling requirements. However, the actual Pod placement depends on the Node Groups (or Karpenter provisioners) available in your EKS cluster.

Step 4: Job Queues and Definitions

Finally, we wire up the Job Queue and a basic Job Definition. In the EKS context, the Job Definition looks different—it wraps Kubernetes properties.

resource "aws_batch_job_queue" "eks_batch_jq" {
  name                 = "eks-batch-queue"
  state                = "ENABLED"
  priority             = 10
  compute_environments = [aws_batch_compute_environment.eks_batch_ce.arn]
}

resource "aws_batch_job_definition" "eks_job_def" {
  name        = "eks-job-def"
  type        = "container"
  
  # Crucial: EKS Job Definitions define node properties differently
  eks_properties {
    pod_properties {
      host_network = false
      containers {
        image = "public.ecr.aws/amazonlinux/amazonlinux:latest"
        command = ["/bin/sh", "-c", "echo 'Hello from EKS Batch'; sleep 30"]
        
        resources {
          limits = {
            cpu    = "1.0"
            memory = "1024Mi"
          }
          requests = {
            cpu    = "0.5"
            memory = "512Mi"
          }
        }
      }
    }
  }
}

Best Practices for Production

  • Use Karpenter: Standard Cluster Autoscaler can be sluggish with Batch spikes. Karpenter observes the unschedulable Pods created by Batch and provisions nodes in seconds.
  • Namespace Isolation: Always isolate Batch workloads in a dedicated Kubernetes namespace (e.g., batch-jobs). Configure ResourceQuotas on this namespace to prevent Batch from starving your microservices.
  • Logging: Ensure your EKS nodes have Fluent Bit or similar log forwarders installed. Batch logs in the console are helpful, but aggregating them into CloudWatch or OpenSearch via the node’s daemonset is superior for debugging.

Frequently Asked Questions (FAQ)

Can I use Fargate with AWS Batch on EKS?

Yes. You can specify FARGATE or FARGATE_SPOT in your compute resources. However, you must ensure you have a Fargate Profile in your EKS cluster that matches the namespace and labels defined in your Batch Job Definition.

Why is my Job stuck in RUNNABLE status?

This is the classic “It’s DNS” of Batch. In EKS, RUNNABLE usually means Batch has successfully submitted the Pod to the API Server, but the Pod is Pending. Check your K8s events (kubectl get events -n batch-jobs). You likely lack sufficient capacity (Node Groups not scaling) or have a `Taint/Toleration` mismatch.

How does this compare to standard Batch on EC2?

Standard Batch manages the ASG (Auto Scaling Group) for you. Batch on EKS delegates the infrastructure management to you (or your EKS autoscaler). EKS offers better unification if you already run K8s, but standard Batch is simpler if you just need raw compute without K8s management overhead.

Conclusion

Integrating AWS Batch with Amazon EKS using Terraform provides a powerful, unified compute plane for high-performance computing. By explicitly defining your IAM trust boundaries and Kubernetes RBAC permissions, you eliminate the “black box” magic and gain full control over your batch processing lifecycle.

Start by deploying the IAM roles and RBAC bindings defined above. Once the permissions handshake is verified, layer on the Compute Environment and Job Queues. Your infrastructure is now ready to process petabytes at scale. Thank you for reading the DevopsRoles page!

Unleash Your Python AI Agent: Build & Deploy in Under 20 Minutes

The transition from static chatbots to autonomous agents represents a paradigm shift in software engineering. We are no longer writing rigid procedural code; we are orchestrating probabilistic reasoning loops. For expert developers, the challenge isn’t just getting an LLM to respond—it’s controlling the side effects, managing state, and deploying a reliable Python AI Agent that can interact with the real world.

This guide bypasses the beginner fluff. We won’t be explaining what a variable is. Instead, we will architect a production-grade agent using LangGraph for state management, OpenAI for reasoning, and FastAPI for serving, wrapping it all in a multi-stage Docker build ready for Kubernetes or Cloud Run.

1. The Architecture: ReAct & Event Loops

Before writing code, we must define the control flow. A robust Python AI Agent typically follows the ReAct (Reasoning + Acting) pattern. Unlike a standard RAG pipeline which retrieves and answers, an agent maintains a loop: Think $\rightarrow$ Act $\rightarrow$ Observe $\rightarrow$ Repeat.

In a production environment, we model this as a state machine (a directed cyclic graph). This provides:

  • Cyclic Capability: The ability for the agent to retry failed tool calls.
  • Persistence: Storing the state of the conversation graph (checkpoints) in Redis or Postgres.
  • Human-in-the-loop: Pausing execution for approval before sensitive actions (e.g., writing to a database).

Pro-Tip: Avoid massive “God Chains.” Decompose your agent into specialized sub-graphs (e.g., a “Research Node” and a “Coding Node”) passed via a supervisor architecture for better determinism.

2. Prerequisites & Tooling

We assume a Linux/macOS environment with Python 3.11+. We will use uv (an extremely fast Python package manager written in Rust) for dependency management, though pip works fine.

pip install langchain-openai langgraph fastapi uvicorn pydantic python-dotenv

Ensure your OPENAI_API_KEY is set in your environment.

3. Step 1: The Reasoning Engine (LangGraph)

We will use LangGraph rather than standard LangChain `AgentExecutor` because it offers fine-grained control over the transition logic.

Defining the State

First, we define the AgentState using TypedDict. This effectively acts as the context object passed between nodes in our graph.

from typing import TypedDict, Annotated, Sequence
import operator
from langchain_core.messages import BaseMessage

class AgentState(TypedDict):
    messages: Annotated[Sequence[BaseMessage], operator.add]
    # You can add custom keys here like 'user_id' or 'trace_id'

The Graph Construction

Here we bind the LLM to tools and define the execution nodes.

from langchain_openai import ChatOpenAI
from langgraph.graph import StateGraph, END
from langchain_core.tools import tool

# Initialize Model
model = ChatOpenAI(model="gpt-4-turbo-preview", temperature=0)

# Define the nodes
def call_model(state):
    messages = state['messages']
    response = model.invoke(messages)
    return {"messages": [response]}

# Define the graph
workflow = StateGraph(AgentState)
workflow.add_node("agent", call_model)
# Note: "action" node logic for tool execution will be added in Step 2

workflow.set_entry_point("agent")

4. Step 2: Implementing Deterministic Tools

A Python AI Agent is only as good as its tools. We use Pydantic for strict schema validation of tool inputs. This ensures the LLM hallucinates arguments less frequently.

from langchain_core.tools import tool
from langchain_community.tools.tavily_search import TavilySearchResults

@tool
def get_weather(location: str) -> str:
    """Returns the weather for a specific location."""
    # In production, this would hit a real API like OpenWeatherMap
    return f"The weather in {location} is 22 degrees Celsius and sunny."

# Bind tools to the model
tools = [get_weather]
model = model.bind_tools(tools)

# Update the graph with a ToolNode
from langgraph.prebuilt import ToolNode

tool_node = ToolNode(tools)
workflow.add_node("tools", tool_node)

# Add Conditional Edge (The Logic)
def should_continue(state):
    last_message = state['messages'][-1]
    if last_message.tool_calls:
        return "tools"
    return END

workflow.add_conditional_edges("agent", should_continue)
workflow.add_edge("tools", "agent")

app = workflow.compile()

5. Step 3: Asynchronous Serving with FastAPI

Running an agent in a script is useful for debugging, but deployment requires an HTTP interface. FastAPI provides the asynchronous capabilities needed to handle long-running LLM requests without blocking the event loop.

from fastapi import FastAPI, HTTPException
from pydantic import BaseModel
from langchain_core.messages import HumanMessage

class QueryRequest(BaseModel):
    query: str
    thread_id: str = "default_thread"

api = FastAPI(title="Python AI Agent API")

@api.post("/chat")
async def chat_endpoint(request: QueryRequest):
    try:
        inputs = {"messages": [HumanMessage(content=request.query)]}
        config = {"configurable": {"thread_id": request.thread_id}}
        
        # Stream or invoke
        response = await app.ainvoke(inputs, config=config)
        
        return {
            "response": response["messages"][-1].content,
            "tool_usage": len(response["messages"]) > 2 # varied based on flow
        }
    except Exception as e:
        raise HTTPException(status_code=500, detail=str(e))

# Run with: uvicorn main:api --host 0.0.0.0 --port 8000

6. Step 4: Production Containerization

To deploy this “under 20 minutes,” we need a Dockerfile that leverages caching and multi-stage builds to keep the image size low and secure.

# Use a slim python image for smaller attack surface
FROM python:3.11-slim as builder

WORKDIR /app

# Install dependencies
COPY requirements.txt .
RUN pip install --no-cache-dir -r requirements.txt

# Copy source code
COPY . .

# Runtime configuration
ENV PORT=8080
EXPOSE 8080

# Use array syntax for CMD to handle signals correctly
CMD ["uvicorn", "main:api", "--host", "0.0.0.0", "--port", "8080"]

Security Note: Never bake your OPENAI_API_KEY into the Docker image. Inject it as an environment variable or a Kubernetes Secret at runtime.

7. Advanced Patterns: Memory & Observability

Once your Python AI Agent is live, two problems emerge immediately: context window limits and “black box” behavior.

Vector Memory

For long-term memory, simply passing the full history becomes expensive. Implementing a RAG (Retrieval-Augmented Generation) memory store allows the agent to recall specific details from past conversations without reloading the entire context.

The relevance of a memory is often calculated using Cosine Similarity:

$$ \text{similarity} = \cos(\theta) = \frac{\mathbf{A} \cdot \mathbf{B}}{\|\mathbf{A}\| \|\mathbf{B}\|} $$

Where $\mathbf{A}$ is the query vector and $\mathbf{B}$ is the stored memory vector.

Observability

You cannot improve what you cannot measure. Integrate tools like LangSmith or Arize Phoenix to trace the execution steps inside your graph. This allows you to pinpoint exactly which tool call failed or where the latency bottleneck exists.

8. Frequently Asked Questions (FAQ)

How do I reduce the latency of my Python AI Agent?

Latency usually comes from the LLM generation tokens. To reduce it: 1) Use faster models (GPT-4o or Haiku) for routing and heavy models only for complex reasoning. 2) Implement semantic caching (Redis) for identical queries. 3) Stream the response to the client using FastAPI’s StreamingResponse so the user sees the first token immediately.

Can I run this agent locally without an API key?

Yes. You can swap ChatOpenAI for ChatOllama using Ollama. This allows you to run models like Llama 3 or Mistral locally on your machine, though you will need significant RAM/VRAM.

How do I handle authentication for the tools?

If your tools (e.g., a Jira or GitHub integration) require OAuth, do not let the LLM generate the token. Handle authentication at the middleware level or pass the user’s token securely in the configurable config of the graph, injecting it into the tool execution context safely.

9. Conclusion

Building a Python AI Agent has evolved from a scientific experiment to a predictable engineering discipline. By combining the cyclic graph capabilities of LangGraph with the type safety of Pydantic and the scalability of Docker/FastAPI, you can deploy agents that are not just cool demos, but reliable enterprise assets.

The next step is to add “human-in-the-loop” breakpoints to your graph, ensuring that your agent asks for permission before executing high-stakes tools. The code provided above is your foundation—now build the skyscraper. Thank you for reading the DevopsRoles page!

Ansible vs Kubernetes: Key Differences Explained Simply

In the modern DevOps landscape, the debate often surfaces: Ansible vs Kubernetes. While both are indispensable heavyweights in the open-source automation ecosystem, comparing them directly is often like comparing a hammer to a 3D printer. They both build things, but the fundamental mechanics, philosophies, and use cases differ radically.

If you are an engineer designing a cloud-native platform, understanding the boundary where Configuration Management ends and Container Orchestration begins is critical. In this guide, we will dissect the architectural differences, explore the “Mutable vs. Immutable” infrastructure paradigms, and demonstrate why the smartest teams use them together.

The Core Distinction: Scope and Philosophy

At a high level, the confusion stems from the fact that both tools use YAML and both “manage software.” However, they operate at different layers of the infrastructure stack.

Ansible: Configuration Management

Ansible is a Configuration Management (CM) tool. Its primary job is to configure operating systems, install packages, and manage files on existing servers. It follows a procedural or imperative model (mostly) where tasks are executed in a specific order to bring a machine to a desired state.

Pro-Tip for Experts: While Ansible modules are idempotent, the playbook execution is linear. Ansible connects via SSH (agentless), executes a Python script, and disconnects. It does not maintain a persistent “watch” over the state of the system once the playbook finishes.

Kubernetes: Container Orchestration

Kubernetes (K8s) is a Container Orchestrator. Its primary job is to schedule, scale, and manage the lifecycle of containerized applications across a cluster of nodes. It follows a strictly declarative model based on Control Loops.

Pro-Tip for Experts: Unlike Ansible’s “fire and forget” model, Kubernetes uses a Reconciliation Loop. The Controller Manager constantly watches the current state (in etcd) and compares it to the desired state. If a Pod dies, K8s restarts it automatically. If you delete a Deployment’s pod, K8s recreates it. Ansible would not fix this configuration drift until the next time you manually ran a playbook.

Architectural Deep Dive: How They Work

To truly understand the Ansible vs Kubernetes dynamic, we must look at how they communicate with infrastructure.

Ansible Architecture: Push Model

[Image of Ansible Architecture]

Ansible utilizes a Push-based architecture.

  • Control Node: Where you run the `ansible-playbook` command.
  • Inventory: A list of IP addresses or hostnames.
  • Transport: SSH (Linux) or WinRM (Windows).
  • Execution: Pushes small Python programs to the target, executes them, and captures the output.

Kubernetes Architecture: Pull/Converge Model

[Image of Kubernetes Architecture]

Kubernetes utilizes a complex distributed architecture centered around an API.

  • Control Plane: The API Server, Scheduler, and Controllers.
  • Data Store: etcd (stores the state).
  • Worker Nodes: Run the `kubelet` agent.
  • Execution: The `kubelet` polls the API Server (Pull), sees a generic assignment (e.g., “Run Pod X”), and instructs the container runtime (Docker/containerd) to spin it up.

Code Comparison: Installing Nginx

Let’s look at how a simple task—getting an Nginx server running—differs in implementation.

Ansible Playbook (Procedural Setup)

Here, we are telling the server exactly what steps to take to install Nginx on the bare metal OS.

---
- name: Install Nginx
  hosts: webservers
  become: yes
  tasks:
    - name: Ensure Nginx is installed
      apt:
        name: nginx
        state: present
        update_cache: yes

    - name: Start Nginx service
      service:
        name: nginx
        state: started
        enabled: yes

Kubernetes Manifest (Declarative State)

Here, we describe the desired result. We don’t care how K8s installs it or on which node it lands; we just want 3 copies running.

apiVersion: apps/v1
kind: Deployment
metadata:
  name: nginx-deployment
spec:
  replicas: 3
  selector:
    matchLabels:
      app: nginx
  template:
    metadata:
      labels:
        app: nginx
    spec:
      containers:
      - name: nginx
        image: nginx:1.14.2
        ports:
        - containerPort: 80

Detailed Comparison Table

Below is a technical breakdown of Ansible vs Kubernetes across key operational vectors.

Feature Ansible Kubernetes
Primary Function Configuration Management (CM) Container Orchestration
Infrastructure Paradigm Mutable (Updates existing servers) Immutable (Replaces containers/pods)
Architecture Agentless, Push Model (SSH) Agent-based, Pull/Reconcile Model
State Management Check mode / Idempotent runs Continuous Reconciliation Loop (Self-healing)
Language Python (YAML for config) Go (YAML for config)
Scaling Manual (Update inventory + run playbook) Automatic (Horizontal Pod Autoscaler)

Better Together: The Synergy

The most effective DevOps engineers don’t choose between Ansible and Kubernetes; they use them to complement each other.

1. Infrastructure Provisioning (Day 0)

Kubernetes cannot install itself (easily). You need physical or virtual servers configured with the correct OS dependencies, networking settings, and container runtimes before K8s can even start.

The Workflow: Use Ansible to provision the underlying infrastructure, harden the OS, and install container runtimes (containerd/CRI-O). Then, use tools like Kubespray (which is essentially a massive set of Ansible Playbooks) to bootstrap the Kubernetes cluster.

2. The Ansible Operator

For teams deep in Ansible knowledge who are moving to Kubernetes, the Ansible Operator SDK is a game changer. It allows you to wrap standard Ansible roles into a Kubernetes Operator. This brings the power of the K8s “Reconciliation Loop” to Ansible automation.

Frequently Asked Questions (FAQ)

Can Ansible replace Kubernetes?

No. While Ansible can manage Docker containers directly using the `docker_container` module, it lacks the advanced scheduling, service discovery, self-healing, and auto-scaling capabilities inherent to Kubernetes. For simple, single-host container deployments, Ansible is sufficient. For distributed microservices, you need Kubernetes.

Can Kubernetes replace Ansible?

Partially, but not fully. Kubernetes excels at managing the application layer. However, it cannot manage the underlying hardware, OS patches, or kernel tuning of the nodes it runs on. You still need a tool like Ansible (or Terraform/Ignition) to manage the base infrastructure.

What is Kubespray?

Kubespray is a Kubernetes incubator project that uses Ansible playbooks to deploy production-ready Kubernetes clusters. It bridges the gap, allowing you to use Ansible’s inventory management to build K8s clusters.

Conclusion

When analyzing Ansible vs Kubernetes, the verdict is clear: they are tools for different stages of the lifecycle. Ansible excels at the imperative setup of servers and the heavy lifting of OS configuration. Kubernetes reigns supreme at the declarative management of containerized applications at scale.

The winning strategy? Use Ansible to build the stadium (infrastructure), and use Kubernetes to manage the game (applications) played inside it.

Would you like me to generate a sample Ansible playbook for bootstrapping a Kubernetes worker node?

Thank you for reading the DevopsRoles page!

Google Antigravity IDE: The Revolutionary New Way to Code

The era of “Autocomplete” is dead. The era of “Agentic Orchestration” has arrived. For the last two years, we’ve been treating AI as a really smart pair programmer—a chatbot living in your sidebar that suggests lines of code or refactors functions. Google Antigravity IDE fundamentally changes this relationship. It doesn’t just want to help you write code; it wants to build the software for you while you act as the architect.

Powered by the newly released Gemini 3 model, Antigravity is an “agent-first” IDE that introduces a new paradigm: asynchronous task execution. Instead of typing alongside you, it spins up autonomous agents to plan, implement, debug, and—crucially—verify features in a headless browser. In this deep dive, we’ll move past the marketing fluff to understand the architecture, the “Mission Control” interface, and the security implications of handing your terminal keys to an LLM.

Beyond the VS Code Fork: The Agent-First Architecture

At first glance, Antigravity looks like a highly polished fork of Visual Studio Code (because, under the hood, it is). However, unlike Cursor or Windsurf, which focus on deep context integration within the editor, Antigravity bifurcates the developer experience into two distinct modes.

1. The Editor View (Synchronous)

This is the familiar IDE experience. You type, you get IntelliSense, and you have an AI chat panel. It utilizes Gemini 3 Pro (or Claude Sonnet 4.5 if configured) for low-latency code completion and inline refactoring. It’s what you use when you need to be “hands-on-keyboard.”

2. The Manager View (Asynchronous)

This is the revolutionary shift. Also called “Mission Control,” this interface treats development tasks as tickets. You assign a high-level goal (e.g., “Refactor the Auth middleware to support JWT rotation”), and an autonomous agent accepts the mission. The agent then:

  • Plans: Generates a step-by-step execution strategy.
  • Acts: Edits files, runs terminal commands, and manages dependencies.
  • Verifies: Spins up a browser instance to physically click through the UI to confirm the fix works.

Pro-Tip: The Manager View allows for parallel execution. You can have one agent fixing a CSS bug on the frontend while another agent writes unit tests for the backend API. You are no longer the bottleneck.

The “Artifacts” Protocol: Trust but Verify

The biggest friction point in AI coding has always been trust. How do you know the AI didn’t hallucinate a dependency or break a downstream service? Antigravity solves this with Artifacts.

Artifacts are structured, verifiable outputs that the agent produces to prove its work. It doesn’t just say “I fixed it.” It presents:

Artifact TypeFunctionWhy it Matters for Experts
Implementation PlanA markdown document outlining the proposed changes before code is touched.Allows you to catch architectural flaws (e.g., “Don’t use a global variable there”) before implementation begins.
Browser RecordingA video file of the agent navigating your local localhost app.Visual proof that the button is clickable and the modal opens, without you needing to pull the branch locally.
Test ManifestA structured log of new unit tests created and their pass/fail status.Ensures the agent isn’t just writing code, but also maintaining coverage standards.

Technical Implementation: Sandboxing & Security

Giving an autonomous agent access to your shell (`zsh` or `bash`) is terrifying for any security-conscious DevOps engineer. Google handles this via a permission model similar to Android’s intent system, but for the CLI.

Configuring the Allow/Deny Lists

Antigravity operates in three modes: Off (Safe), Auto (Balanced), and Turbo (Risky). For enterprise environments, you should explicitly configure the terminal.executionPolicy in your settings.json to whitelist only benign commands.

Here is a production-ready configuration that allows build tools but blocks network egress tools like curl or wget to prevent data exfiltration by a hallucinating agent:

{
    "antigravity.agent.mode": "agent-assisted",
    "terminal.executionPolicy": "custom",
    "terminal.allowList": [
        "npm install",
        "git status",
        "docker ps",
        "make *"
    ],
    "terminal.denyList": [
        "curl",
        "wget",
        "nc",
        "ssh",
        "rm -rf /"
    ],
    "agent.reviewMode": "require-approval-for-file-deletion"
}

SECURITY WARNING: Researchers at Mindgard recently identified a “Persistent Code Execution” vulnerability in early previews of Antigravity. If a workspace is compromised, an agent could theoretically embed malicious startup scripts that persist across sessions. Always treat the Agent’s terminal sessions as untrusted and run Antigravity within an ephemeral container (like a DevContainer) rather than directly on your host metal.

Workflow: The “Architect” Loop

To get the most out of Google Antigravity, you must stop coding and start architecting. Here is the ideal workflow for an expert developer:

  1. Context Loading: Instead of pasting snippets, use the @codebase symbol to let Gemini 3 index your entire repository AST (Abstract Syntax Tree).
  2. The Prompt: Issue a high-level directive.


    “Create a new ‘Settings’ page with a toggle for Dark Mode. Use the existing Tailwind components from /src/components/ui. Ensure state persists to LocalStorage.”
  3. Plan Review: The agent will generate a text artifact. Review it. If it suggests a new dependency you hate, comment on the artifact directly: “No, use native Context API, do not install Redux.”
  4. Async Execution: Switch to the Manager View. Let the agent work. Go review a PR or grab coffee.
  5. Verification: The agent pings you. Watch the Browser Recording artifact. If the toggle works in the video, accept the diff.

Frequently Asked Questions (FAQ)

Is Google Antigravity free?

Currently, it is in Public Preview and free for individuals using a Google Account. However, heavy usage of the Gemini 3 agentic loop will eventually be tied to a Gemini Advanced or Google Cloud subscription.

How does this compare to Cursor?

Cursor is currently the king of “Editor Mode” (synchronous coding). Antigravity is betting the farm on “Manager Mode” (asynchronous agents). If you like writing code yourself with super-powers, stick with Cursor. If you want to delegate entire features to an AI junior developer, Antigravity is the superior tool.

Can I use other models besides Gemini?

Yes. Antigravity supports “Model Optionality.” You can swap the underlying reasoning engine to Claude Sonnet 4.5 or GPT-OSS via the settings, though Gemini 3 currently has the tightest integration with the “Artifacts” verification system.

Conclusion Google Antigravity IDE

Google Antigravity IDE is a glimpse into the future where “Senior Engineer” means “Manager of AI Agents.” It reduces the cognitive load of syntax and boilerplate, allowing you to focus on system design, security, and user experience.

However, the abstraction comes with risks. The removal of “gravity” (manual effort) can lead to a detachment from the codebase quality if you rely too heavily on the agent without rigorous review. Use the tool to amplify your output, not to replace your judgment.

Next Step: Download the Antigravity preview, open a non-critical repository, and try the “Mission Control” view. Assign the agent a task to “Write a comprehensive README.md based on the code,” and see how well it interprets your architecture.  Thank you for reading the DevopsRoles page!

Master TimescaleDB Deployment on AWS using Terraform

Time-series data is the lifeblood of modern observability, IoT, and financial analytics. While managed services exist, enterprise-grade requirements—such as strict data sovereignty, VPC peering latency, or custom ZFS compression tuning—often mandate a self-hosted architecture. This guide focuses on a production-ready TimescaleDB deployment on AWS using Terraform.

We aren’t just spinning up an EC2 instance; we are engineering a storage layer capable of handling massive ingest rates and complex analytical queries. We will leverage Infrastructure as Code (IaC) to orchestrate compute, high-performance block storage, and automated bootstrapping.

Architecture Decisions: optimizing for Throughput

Before writing HCL, we must define the infrastructure characteristics required by TimescaleDB. Unlike stateless microservices, database performance is bound by I/O and memory.

  • Compute (EC2): We will target memory-optimized instances (e.g., r6i or r7g families) to maximize the RAM available for PostgreSQL’s shared buffers and OS page cache.
  • Storage (EBS): We will separate the WAL (Write Ahead Log) from the Data directory.
    • WAL Volume: Requires low latency sequential writes. io2 Block Express or high-throughput gp3.
    • Data Volume: Requires high random read/write throughput. gp3 is usually sufficient, but striping multiple volumes (RAID 0) is a common pattern for extreme performance.
  • OS Tuning: We will use cloud-init to tune kernel parameters (hugepages, swappiness) and run timescaledb-tune automatically.

Pro-Tip: Avoid using burstable instances (T-family) for production databases. The CPU credit exhaustion can lead to catastrophic latency spikes during data compaction or high-ingest periods.

Phase 1: Provider & VPC Foundation

Assuming you have a VPC setup, let’s establish the security context. Your TimescaleDB instance should reside in a private subnet, accessible only via a Bastion host or VPN.

Security Group Definition

resource "aws_security_group" "timescale_sg" {
  name        = "timescaledb-sg"
  description = "Security group for TimescaleDB Node"
  vpc_id      = var.vpc_id

  # Inbound: PostgreSQL Standard Port
  ingress {
    from_port       = 5432
    to_port         = 5432
    protocol        = "tcp"
    security_groups = [var.app_security_group_id] # Only allow app tier
    description     = "Allow PGSQL access from App Tier"
  }

  # Outbound: Allow package updates and S3 backups
  egress {
    from_port   = 0
    to_port     = 0
    protocol    = "-1"
    cidr_blocks = ["0.0.0.0/0"]
  }

  tags = {
    Name = "timescaledb-production-sg"
  }
}

Phase 2: Storage Engineering (EBS)

This is the critical differentiator for expert deployments. We explicitly define EBS volumes separate from the root device to ensure data persistence independent of the instance lifecycle and to optimize I/O channels.

# Data Volume - Optimized for Throughput
resource "aws_ebs_volume" "pg_data" {
  availability_zone = var.availability_zone
  size              = 500
  type              = "gp3"
  iops              = 12000 # Provisioned IOPS
  throughput        = 500   # MB/s

  tags = {
    Name = "timescaledb-data-vol"
  }
}

# WAL Volume - Optimized for Latency
resource "aws_ebs_volume" "pg_wal" {
  availability_zone = var.availability_zone
  size              = 100
  type              = "io2"
  iops              = 5000 

  tags = {
    Name = "timescaledb-wal-vol"
  }
}

resource "aws_volume_attachment" "pg_data_attach" {
  device_name = "/dev/sdf"
  volume_id   = aws_ebs_volume.pg_data.id
  instance_id = aws_instance.timescale_node.id
}

resource "aws_volume_attachment" "pg_wal_attach" {
  device_name = "/dev/sdg"
  volume_id   = aws_ebs_volume.pg_wal.id
  instance_id = aws_instance.timescale_node.id
}

Phase 3: The TimescaleDB Instance & Bootstrapping

We use the user_data attribute to handle the “Day 0” operations: mounting volumes, installing the TimescaleDB packages (which install PostgreSQL as a dependency), and applying initial configuration tuning.

Warning: Ensure your IAM Role attached to this instance has permissions for ec2:DescribeTags if you use cloud-init to self-discover volume tags, or s3:* if you automate WAL-G backups immediately.

resource "aws_instance" "timescale_node" {
  ami           = data.aws_ami.ubuntu.id # Recommend Ubuntu 22.04 or 24.04 LTS
  instance_type = "r6i.2xlarge"
  subnet_id     = var.private_subnet_id
  key_name      = var.key_name

  vpc_security_group_ids = [aws_security_group.timescale_sg.id]
  iam_instance_profile   = aws_iam_instance_profile.timescale_role.name

  root_block_device {
    volume_type = "gp3"
    volume_size = 50
  }

  # "Day 0" Configuration Script
  user_data = <<-EOF
    #!/bin/bash
    set -e
    
    # 1. Mount EBS Volumes
    # Note: NVMe device names may vary on Nitro instances (e.g., /dev/nvme1n1)
    mkfs.xfs /dev/sdf
    mkfs.xfs /dev/sdg
    mkdir -p /var/lib/postgresql/data
    mkdir -p /var/lib/postgresql/wal
    mount /dev/sdf /var/lib/postgresql/data
    mount /dev/sdg /var/lib/postgresql/wal
    
    # Persist mounts in fstab... (omitted for brevity)

    # 2. Add Timescale PPA & Install
    echo "deb https://packagecloud.io/timescale/timescaledb/ubuntu/ $(lsb_release -c -s) main" | sudo tee /etc/apt/sources.list.d/timescaledb.list
    wget --quiet -O - https://packagecloud.io/timescale/timescaledb/gpgkey | sudo apt-key add -
    apt-get update
    apt-get install -y timescaledb-2-postgresql-14

    # 3. Initialize Database
    chown -R postgres:postgres /var/lib/postgresql
    su - postgres -c "/usr/lib/postgresql/14/bin/initdb -D /var/lib/postgresql/data --waldir=/var/lib/postgresql/wal"

    # 4. Tune Configuration
    # This is critical: It calculates memory settings based on the instance type
    timescaledb-tune --quiet --yes --conf-path=/var/lib/postgresql/data/postgresql.conf

    # 5. Enable Service
    systemctl enable postgresql
    systemctl start postgresql
  EOF

  tags = {
    Name = "TimescaleDB-Primary"
  }
}

Optimizing Terraform for Stateful Resources

Managing databases with Terraform requires handling state carefully. Unlike a stateless web server, you cannot simply destroy and recreate this resource if you change a parameter.

Lifecycle Management

Use the lifecycle meta-argument to prevent accidental deletion of your primary database node.

lifecycle {
  prevent_destroy = true
  ignore_changes  = [
    ami, 
    user_data # Prevent recreation if boot script changes
  ]
}

Validation and Post-Deployment

Once terraform apply completes, verification is necessary. You should verify that the TimescaleDB extension is correctly loaded and that your memory settings reflect the timescaledb-tune execution.

Connect to your instance and run:

sudo -u postgres psql -c "SELECT * FROM pg_extension WHERE extname = 'timescaledb';"
sudo -u postgres psql -c "SHOW shared_buffers;"

For further reading on tuning parameters, refer to the official TimescaleDB Tune documentation.

Frequently Asked Questions (FAQ)

1. Can I use RDS for TimescaleDB instead of EC2?

Yes, AWS RDS for PostgreSQL supports the TimescaleDB extension. However, you are often limited to older versions of the extension, and you lose control over low-level filesystem tuning (like using ZFS for compression) which can be critical for high-volume time-series data.

2. How do I handle High Availability (HA) with this Terraform setup?

This guide covers a single-node deployment. For HA, you would expand the Terraform code to deploy a secondary EC2 instance in a different Availability Zone and configure Streaming Replication. Tools like Patroni are the industry standard for managing auto-failover on self-hosted PostgreSQL/TimescaleDB.

3. Why separate WAL and Data volumes?

WAL operations are sequential and synchronous. If they share bandwidth with random read/write operations of the Data volume, write latency will spike, causing backpressure on your ingestion pipeline. Separating them physically (different EBS volumes) ensures consistent write performance.

Conclusion

Mastering TimescaleDB Deployment on AWS requires moving beyond simple “click-ops” to a codified, reproducible infrastructure. By using Terraform to orchestrate not just the compute, but the specific storage characteristics required for time-series workloads, you ensure your database can scale with your data.

Next Steps: Once your instance is running, implement a backup strategy using WAL-G to stream backups directly to S3, ensuring point-in-time recovery (PITR) capabilities. Thank you for reading the DevopsRoles page!

Docker Hardened Images & Docker Scout Disruption: Key Insights

For years, the “CVE Treadmill” has been the bane of every Staff Engineer’s existence. You spend more time patching trivial vulnerabilities in base images than shipping value. Enter Docker Hardened Images (DHI)—a strategic partnership between Docker and Chainguard that fundamentally disrupts how we handle container security. This isn’t just about “fewer vulnerabilities”; it’s about a zero-CVE baseline powered by Wolfi, integrated with the real-time intelligence of Docker Scout.

This guide is written for Senior DevOps professionals and SREs who need to move beyond “scanning and patching” to “secure by design.” We will dissect the architecture of Wolfi, operationalize distroless images, and debug shell-less containers in production.

1. The Architecture of Hardened Images: Wolfi vs. Alpine

Most “minimal” images rely on Alpine Linux. While Alpine is excellent, its reliance on musl libc often creates friction for enterprise applications (e.g., DNS resolution quirks, Python wheel compilation failures).

Docker Hardened Images are primarily built on Wolfi, a Linux “undistro” designed specifically for containers.

Why Wolfi Matters for Experts

  • glibc Compatibility: Unlike Alpine, Wolfi uses glibc. This ensures binary compatibility with standard software (like Python wheels) without the bloat of a full Debian/Ubuntu OS.
  • Apk Package Manager: It uses the speed of the apk format but draws from its own curated, secure repository.
  • Declarative Builds: Every package in Wolfi is built from source using Melange, ensuring full SLSA Level 3 provenance.

Pro-Tip: The “Distroless” myth is that there is no OS. In reality, there is a minimal filesystem with just enough libraries (glibc, openssl) to run your app. Wolfi strikes the perfect balance: the compatibility of Debian with the footprint of Alpine.

2. Operationalizing Hardened Images (Code & Patterns)

Adopting DHI requires a shift in your Dockerfile strategy. You cannot simply apt-get install your way to victory.

The “Builder Pattern” with Wolfi

Since runtime images often lack package managers, you must use multi-stage builds. Use a “Dev” variant for building and a “Hardened” variant for runtime.

# STAGE 1: Build
# Use a Wolfi-based SDK image that includes build tools (compilers, git, etc.)
FROM cgr.dev/chainguard/go:latest-dev AS builder

WORKDIR /app
COPY go.mod go.sum ./
RUN go mod download
COPY . .
# Build a static binary
RUN CGO_ENABLED=0 go build -o myapp .

# STAGE 2: Runtime
# Switch to the minimal, hardened runtime image (Distroless philosophy)
# No shell, no package manager, zero-CVE baseline
FROM cgr.dev/chainguard/static:latest

COPY --from=builder /app/myapp /myapp
CMD ["/myapp"]

Why this works: The final image contains only your binary and the bare minimum system libraries. Attackers gaining RCE have no shell (`/bin/sh`) and no package manager (`apk`/`apt`) to expand their foothold.

3. Docker Scout: Real-Time Intelligence, Not Just Scanning

Traditional scanners provide a snapshot in time. Docker Scout treats vulnerability management as a continuous stream. It correlates your image’s SBOM (Software Bill of Materials) against live CVE feeds.

Configuring the “Valid DHI” Policy

For enterprise environments, you can enforce a policy that only allows Docker Hardened Images. This is done via the Docker Scout policy engine.

# Example: Check policy compliance for an image via CLI
$ docker scout policy local-image:tag --org my-org

# Expected Output for a compliant image:
# ✓  Policy "Valid Docker Hardened Image" passed
#    - Image is based on a verified Docker Hardened Image
#    - Base image has valid provenance attestation

Integrating this into CI/CD (e.g., GitHub Actions) prevents non-compliant base images from ever reaching production registries.

4. Troubleshooting “Black Box” Containers

The biggest friction point for Senior Engineers adopting distroless images is debugging. “How do I `exec` into the pod if there’s no shell?”

Do not install a shell in your production image. Instead, use Kubernetes Ephemeral Containers.

The `kubectl debug` Pattern

This command attaches a “sidecar” container with a full toolkit (shell, curl, netcat) to your running target pod, sharing the process namespace.

# Target a running distroless pod
kubectl debug -it my-distroless-pod \
  --image=cgr.dev/chainguard/wolfi-base \
  --target=my-app-container

# Once inside the debug container:
# The target container's filesystem is available at /proc/1/root
$ ls /proc/1/root/app/config/

Advanced Concept: By sharing the Process Namespace (`shareProcessNamespace: true` in Pod spec or implicit via `kubectl debug`), you can see processes running in the target container (PID 1) from your debug container and even run tools like `strace` or `tcpdump` against them.

Frequently Asked Questions (FAQ)

Q: How much do Docker Hardened Images cost?

A: As of late 2025, Docker Hardened Images are an add-on subscription available to users on Pro, Team, and Business plans. They are not included in the free Personal tier.

Q: Can I mix Alpine packages with Wolfi images?

A: No. Wolfi packages are built against glibc; Alpine packages are built against musl. Binary incompatibility will cause immediate failures. Use apk within a Wolfi environment to pull purely from Wolfi repositories.

Q: What if my legacy app relies on `systemd` or specific glibc versions?

A: Wolfi is glibc-based, so it has better compatibility than Alpine. However, it lacks a system manager like `systemd`. For legacy “fat” containers, you may need to refactor to decouple the application from OS-level daemons.

Conclusion

Docker Hardened Images represent the maturity of the container ecosystem. By shifting from “maintenance” (patching debian-slim) to “architecture” (using Wolfi/Chainguard), you drastically reduce your attack surface and operational toil.

The combination of Wolfi’s glibc compatibility and Docker Scout’s continuous policy evaluation creates a “secure-by-default” pipeline that satisfies both the developer’s need for speed and the CISO’s need for compliance.

Next Step: Run a Docker Scout Quickview on your most critical production image (`docker scout quickview `) to see how many vulnerabilities you could eliminate today by switching to a Hardened Image base. Thank you for reading the DevopsRoles page!

AWS ECS & EKS Power Up with Remote MCP Servers

The Model Context Protocol (MCP) has rapidly become the standard for connecting AI models to your data and tools. However, most initial implementations are strictly local—relying on stdio to pipe data between a local process and your AI client (like Claude Desktop or Cursor). While this works for personal scripts, it doesn’t scale for teams.

To truly unlock the potential of AI agents in the enterprise, you need to decouple the “Brain” (the AI client) from the “Hands” (the tools). This means moving your MCP servers from localhost to robust cloud infrastructure.

This guide details the architectural shift required to run AWS ECS EKS MCP workloads. We will cover how to deploy remote MCP servers using Server-Sent Events (SSE), how to host them on Fargate and Kubernetes, and—most importantly—how to secure them so you aren’t exposing your internal database tools to the open internet.

The Architecture Shift: From Stdio to Remote SSE

In a local setup, the MCP client spawns the server process and communicates via standard input/output. This is secure by default because it’s isolated to your machine. To move this to AWS, we must switch the transport layer.

The MCP specification supports SSE (Server-Sent Events) for remote connections. This changes the communication flow:

  • Server-to-Client: Uses a persistent SSE connection to push events (like tool outputs or log messages).
  • Client-to-Server: Uses standard HTTP POST requests to send commands (like “call tool X”).

Pro-Tip: Unlike WebSockets, SSE is unidirectional (Server -> Client). This is why the protocol also requires an HTTP POST endpoint for the client to talk back. When deploying to AWS, your Load Balancer must support long-lived HTTP connections for the SSE channel.

Option A: Serverless Simplicity with AWS ECS (Fargate)

For most standalone MCP servers—such as a tool that queries a specific RDS database or interacts with an internal API—AWS ECS Fargate is the ideal host. It removes the overhead of managing EC2 instances while providing native integration with AWS VPCs for security.

1. The Container Image

You need an MCP server that listens on a port (usually via a web framework like FastAPI or Starlette) rather than just running a script. Here is a conceptual Dockerfile for a Python-based remote MCP server:

FROM python:3.11-slim

WORKDIR /app

# Install MCP SDK and a web server (e.g., Starlette/Uvicorn)
RUN pip install mcp[cli] uvicorn starlette

COPY . .

# Expose the port for SSE and HTTP POST
EXPOSE 8080

# Run the server using the SSE transport adapter
CMD ["uvicorn", "server:app", "--host", "0.0.0.0", "--port", "8080"]

2. The Task Definition & ALB

When defining your ECS Service, you must place an Application Load Balancer (ALB) in front of your tasks. The critical configuration here is the Idle Timeout.

  • Health Checks: Ensure your container exposes a simple /health endpoint, or the ALB will kill the task during long AI-generation cycles.
  • Timeout: Increase the ALB idle timeout to at least 300 seconds. AI models can take time to “think” or process large tool outputs, and you don’t want the SSE connection to drop prematurely.

Option B: Scalable Orchestration with Amazon EKS

If your organization already operates on Kubernetes, deploying AWS ECS EKS MCP servers as standard deployments allows for advanced traffic management. This is particularly useful if you are running a “Mesh” of MCP servers.

The Ingress Challenge

The biggest hurdle on EKS is the Ingress Controller. If you use NGINX Ingress, it defaults to buffering responses, which breaks SSE (the client waits for the buffer to fill before receiving the first event).

You must apply specific annotations to your Ingress resource to disable buffering for the SSE path:

apiVersion: networking.k8s.io/v1
kind: Ingress
metadata:
  name: mcp-server-ingress
  annotations:
    # Critical for SSE to work properly
    nginx.ingress.kubernetes.io/proxy-buffering: "off"
    nginx.ingress.kubernetes.io/proxy-read-timeout: "3600"
    nginx.ingress.kubernetes.io/proxy-send-timeout: "3600"
spec:
  ingressClassName: nginx
  rules:
    - host: mcp.internal.yourcompany.com
      http:
        paths:
          - path: /sse
            pathType: Prefix
            backend:
              service:
                name: mcp-service
                port:
                  number: 80

Warning: Never expose an MCP server Service as LoadBalancer (public) without strict Security Groups or authentication. An exposed MCP server gives an AI direct execution access to whatever tools you’ve enabled (e.g., “Drop Database”).

Security: The “MCP Proxy” & Auth Patterns

This is the section that separates a “toy” project from a production deployment. How do you let an AI client (running on a developer’s laptop) access a private ECS/EKS service securely?

1. The VPN / Tailscale Approach

The simplest method is network isolation. Keep the MCP server in a private subnet. Developers must be on the corporate VPN or use a mesh overlay like Tailscale to reach the `http://internal-mcp:8080/sse` endpoint. This requires zero code changes to the MCP server.

2. The AWS SigV4 / Auth Proxy Approach

For a more cloud-native approach, AWS recently introduced the concept of an MCP Proxy. This involves:

  1. Placing your MCP Server behind an ALB with AWS IAM Authentication or Cognito.
  2. Running a small local proxy on the client machine (the developer’s laptop).
  3. The developer configures their AI client to talk to localhost:proxy-port.
  4. The local proxy signs requests with the developer’s AWS credentials (SigV4) and forwards them to the remote ECS/EKS endpoint.

This ensures that only users with the correct IAM Policy (e.g., AllowInvokeMcpServer) can access your tools.

Frequently Asked Questions (FAQ)

Can I use the official Amazon EKS MCP Server remotely?

Yes, but it’s important to distinguish between hosting a server and using a tool. AWS provides an open-source Amazon EKS MCP Server. This is a tool you run (locally or remotely) that gives your AI the ability to run kubectl commands and inspect your cluster. You can host this inside your cluster to give an AI agent “SRE superpowers” over that specific environment.

Why does my remote MCP connection drop after 60 seconds?

This is almost always a Load Balancer or Reverse Proxy timeout. SSE requires a persistent connection. Check your AWS ALB “Idle Timeout” settings or your Nginx proxy_read_timeout. Ensure they are set to a value higher than your longest expected idle time (e.g., 5-10 minutes).

Should I use ECS or Lambda for MCP?

While Lambda is cheaper for sporadic use, MCP is a stateful protocol (via SSE). Running SSE on Lambda requires using Function URLs with response streaming, which has a 15-minute hard limit and can be tricky to debug. ECS Fargate is generally preferred for the stability of the long-lived connection required by the protocol.

Conclusion

Moving your Model Context Protocol infrastructure from local scripts to AWS ECS and EKS is a pivotal step in maturing your AI operations. By leveraging Fargate for simplicity or EKS for mesh-scale orchestration, you provide your AI agents with a stable, high-performance environment to operate in.

Remember, “Powering Up” isn’t just about connectivity; it’s about security. Whether you choose a VPN-based approach or the robust AWS SigV4 proxy pattern, ensuring your AI tools are authenticated is non-negotiable in a production environment.

Next Step: Audit your current local MCP tools. Identify one “heavy” tool (like a database inspector or a large-context retriever) and containerize it using the Dockerfile pattern above to deploy your first remote MCP service on Fargate. Thank you for reading the DevopsRoles page!

Agentic AI is Revolutionizing AWS Security Incident Response

For years, the gold standard in cloud security has been defined by deterministic automation. We detect an anomaly in Amazon GuardDuty, trigger a CloudWatch Event (now EventBridge), and fire a Lambda function to execute a hard-coded remediation script. While effective for known threats, this approach is brittle. It lacks context, reasoning, and adaptability.

Enter Agentic AI. By integrating Large Language Models (LLMs) via services like Amazon Bedrock into your security stack, we are moving from static “Runbooks” to dynamic “Reasoning Engines.” AWS Security Incident Response is no longer just about automation; it is about autonomy. This guide explores how to architect Agentic workflows that can analyze forensics, reason through containment strategies, and execute remediation with human-level nuance at machine speed.

The Evolution: From SOAR to Agentic Security

Traditional Security Orchestration, Automation, and Response (SOAR) platforms rely on linear logic: If X, then Y. This works for blocking an IP address, but it fails when the threat requires investigation. For example, if an IAM role is exfiltrating data, a standard script might revoke keys immediately—potentially breaking production applications—whereas a human analyst would first check if the activity aligns with a scheduled maintenance window.

Agentic AI introduces the ReAct (Reasoning + Acting) pattern to AWS Security Incident Response. Instead of blindly firing scripts, the AI Agent:

  1. Observes the finding (e.g., “S3 Bucket Public Access Enabled”).
  2. Reasons about the context (Queries CloudTrail: “Who did this? Was it authorized?”).
  3. Acts using defined tools (Calls boto3 functions to correct the policy).
  4. Evaluates the result (Verifies the bucket is private).

GigaCode Pro-Tip:
Don’t confuse “Generative AI” with “Agentic AI.” Generative AI writes a report about the hack. Agentic AI logs into the console (via API) and fixes the hack. The differentiator is the Action Group.

Architecture: Building a Bedrock Security Agent

To modernize your AWS Security Incident Response, we leverage Amazon Bedrock Agents. This managed service orchestrates the interaction between the LLM (reasoning), the knowledge base (RAG for company policies), and the action groups (Lambda functions).

1. The Foundation: Knowledge Bases

Your agent needs context. Using Retrieval-Augmented Generation (RAG), you can index your internal Wiki, incident response playbooks, and architecture diagrams into an Amazon OpenSearch Serverless vector store connected to Bedrock. When a finding occurs, the agent first queries this base: “What is the protocol for a compromised EC2 instance in the Production VPC?”

2. Action Groups (The Hands)

Action groups map OpenAPI schemas to AWS Lambda functions. This allows the LLM to “call” Python code. Below is an example of a remediation tool that an agent might decide to use during an active incident.

Code Implementation: The Isolation Tool

This Lambda function serves as a “tool” that the Bedrock Agent can invoke when it decides an instance must be quarantined.

import boto3
import json
import logging

logger = logging.getLogger()
logger.setLevel(logging.INFO)

ec2 = boto3.client('ec2')

def lambda_handler(event, context):
    """
    Tool for Bedrock Agent: Isolates an EC2 instance by attaching a forensic SG.
    Input: {'instance_id': 'i-xxxx', 'vpc_id': 'vpc-xxxx'}
    """
    agent_params = event.get('parameters', [])
    instance_id = next((p['value'] for p in agent_params if p['name'] == 'instance_id'), None)
    
    if not instance_id:
        return {"response": "Error: Instance ID is required for isolation."}

    try:
        # Logic to find or create a 'Forensic-No-Ingress' Security Group
        logger.info(f"Agent requested isolation for {instance_id}")
        
        # 1. Get current SG for rollback context (Forensics)
        current_attr = ec2.describe_instance_attribute(
            InstanceId=instance_id, Attribute='groupSet'
        )
        
        # 2. Attach Isolation SG (Assuming sg-isolation-id is pre-provisioned)
        isolation_sg = "sg-0123456789abcdef0" 
        
        ec2.modify_instance_attribute(
            InstanceId=instance_id,
            Groups=[isolation_sg]
        )
        
        return {
            "response": f"SUCCESS: Instance {instance_id} has been isolated. Previous SGs logged for analysis."
        }
        
    except Exception as e:
        logger.error(f"Failed to isolate: {str(e)}")
        return {"response": f"FAILED: Could not isolate instance. Reason: {str(e)}"}

Implementing the Workflow

Deploying this requires an Event-Driven Architecture. Here is the lifecycle of an Agentic AWS Security Incident Response:

  • Detection: GuardDuty detects UnauthorizedAccess:EC2/TorIPCaller.
  • Ingestion: EventBridge captures the finding and pushes it to an SQS queue (for throttling/buffering).
  • Invocation: A Lambda “Controller” picks up the finding and invokes the Bedrock Agent Alias using the invoke_agent API.
  • Reasoning Loop:
    • The Agent receives the finding details.
    • It checks the “Knowledge Base” and sees that Tor connections are strictly prohibited.
    • It decides to call the GetInstanceDetails tool to check tags.
    • It sees the tag Environment: Production.
    • It decides to call the IsolateInstance tool (code above).
  • Resolution: The Agent updates AWS Security Hub with the workflow status, marks the finding as RESOLVED, and emails the SOC team a summary of its actions.

Human-in-the-Loop (HITL) and Guardrails

For expert practitioners, the fear of “hallucinating” agents deleting production databases is real. To mitigate this in AWS Security Incident Response, we implement Guardrails for Amazon Bedrock.

Guardrails allow you to define denied topics and content filters. Furthermore, for high-impact actions (like terminating instances), you should design the Agent to request approval rather than execute immediately. The Agent can send an SNS notification with a standard “Approve/Deny” link. The Agent pauses execution until the approval signal is received via a callback webhook.

Pro-Tip: Use CloudTrail Lake to audit your Agents. Every API call made by the Agent (via the assumed IAM role) is logged. Create a QuickSight dashboard to visualize “Agent Remediation Success Rates” vs. “Human Intervention Required.”

Frequently Asked Questions (FAQ)

How does Agentic AI differ from AWS Lambda automation?

Lambda automation is deterministic (scripted steps). Agentic AI is probabilistic and reasoning-based. It can handle ambiguity, such as deciding not to act if a threat looks like a false positive based on cross-referencing logs, whereas a script would execute blindly.

Is it safe to let AI modify security groups automatically?

It is safe if scoped correctly using IAM Roles. The Agent’s role should adhere to the Principle of Least Privilege. Start with “Read-Only” agents that only perform forensics and suggest remediation, then graduate to “Active” agents for low-risk environments.

Which AWS services are required for this architecture?

At a minimum: Amazon Bedrock (Agents & Knowledge Bases), AWS Lambda (Action Groups), Amazon EventBridge (Triggers), Amazon GuardDuty (Detection), and AWS Security Hub (Centralized Management).

Conclusion

The landscape of AWS Security Incident Response is shifting. By adopting Agentic AI, organizations can reduce Mean Time to Respond (MTTR) from hours to seconds. However, this is not a “set and forget” solution. It requires rigorous engineering of prompts, action schemas, and IAM boundaries.

Start small: Build an agent that purely performs automated forensics—gathering logs, querying configurations, and summarizing the blast radius—before letting it touch your infrastructure. The future of cloud security is autonomous, and the architects who master these agents today will define the standards of tomorrow.

For deeper reading on configuring Bedrock Agents, consult the official AWS Bedrock User Guide or review the AWS Security Incident Response Guide.

Kubernetes DRA: Optimize GPU Workloads with Dynamic Resource Allocation

For years, Kubernetes Platform Engineers and SREs have operated under a rigid constraint: the Device Plugin API. While it served the initial wave of containerization well, its integer-based resource counting (e.g., nvidia.com/gpu: 1) is fundamentally insufficient for modern, high-performance AI/ML workloads. It lacks the nuance to handle topology awareness, arbitrary constraints, or flexible device sharing at the scheduler level.

Enter Kubernetes DRA (Dynamic Resource Allocation). This is not just a patch; it is a paradigm shift in how Kubernetes requests and manages hardware accelerators. By moving resource allocation logic out of the Kubelet and into the control plane (via the Scheduler and Resource Drivers), DRA allows for complex claim lifecycles, structured parameters, and significantly improved cluster utilization.

The Latency of Legacy: Why Device Plugins Are Insufficient

To understand the value of Kubernetes DRA, we must first acknowledge the limitations of the standard Device Plugin framework. In the “classic” model, the Scheduler is essentially blind. It sees nodes as bags of counters (Capacity/Allocatable). It does not know which specific GPU it is assigning, nor its topology (PCIe switch locality, NVLink capabilities) relative to other requested devices.

Pro-Tip: In the classic model, the actual device assignment happens at the Kubelet level, long after scheduling. If a Pod lands on a node that has free GPUs but lacks the specific topology required for efficient distributed training, you incur a silent performance penalty or a runtime failure.

The Core Limitations

  • Opaque Integers: You cannot request “A GPU with 24GB VRAM.” You can only request “1 Unit” of a device, requiring complex node labeling schemes to separate hardware tiers.
  • Late Binding: Allocation happens at container creation time (StartContainer), making it impossible for the scheduler to make globally optimal decisions based on device attributes.
  • No Cross-Pod Sharing: Device Plugins generally assume exclusive access or rigid time-slicing, lacking native API support for dynamic sharing of a specific device instance across Pods.

Architectural Deep Dive: How Kubernetes DRA Works

Kubernetes DRA decouples the resource definition from the Pod spec. It introduces a new API group, resource.k8s.io, and a set of Custom Resource Definitions (CRDs) that treat hardware requests similarly to Persistent Volume Claims (PVCs).

1. The Shift to Control Plane Allocation

Unlike Device Plugins, DRA involves the Scheduler directly. When utilizing the new Structured Parameters model (promoted in K8s 1.30+), the scheduler can make decisions based on the actual attributes of the devices without needing to call out to an external driver for every Pod decision, dramatically reducing scheduling latency compared to early alpha DRA implementations.

2. Core API Objects

If you are familiar with PVCs and StorageClasses, the DRA mental model will feel intuitive.

API Object Role Analogy
ResourceClass Defines the driver and common parameters for a type of hardware. StorageClass
ResourceClaim A request for a specific device instance satisfying certain constraints. PVC (Persistent Volume Claim)
ResourceSlice Published by the driver; advertises available resources and their attributes to the cluster. PV (but dynamic and granular)
DeviceClass (New in Structured Parameters) Defines a set of configuration presets or hardware selectors. Hardware Profile

Implementing DRA: A Practical Workflow

Let’s look at how to implement Kubernetes DRA for a GPU workload. We assume a cluster running Kubernetes 1.30+ with the DynamicResourceAllocation feature gate enabled.

Step 1: The ResourceClass

First, the administrator defines a class that points to the specific DRA driver (e.g., the NVIDIA DRA driver).

apiVersion: resource.k8s.io/v1alpha2
kind: ResourceClass
metadata:
  name: nvidia-gpu
driverName: dra.nvidia.com
structuredParameters: true  # Enabling the high-performance scheduler path

Step 2: The ResourceClaimTemplate

Instead of embedding requests in the Pod spec, we create a template. This allows the Pod to generate a unique ResourceClaim upon creation. Notice how we can now specify arbitrary selectors, not just counts.

apiVersion: resource.k8s.io/v1alpha2
kind: ResourceClaimTemplate
metadata:
  name: gpu-claim-template
spec:
  metadata:
    labels:
      app: deep-learning
  spec:
    resourceClassName: nvidia-gpu
    parametersRef:
      kind: GpuConfig
      name: v100-high-mem
      apiGroup: dra.nvidia.com

Step 3: The Pod Specification

The Pod references the claim template. The Kubelet ensures the container is not started until the claim is “Allocated” and “Reserved.”

apiVersion: v1
kind: Pod
metadata:
  name: model-training-pod
spec:
  containers:
  - name: trainer
    image: nvidia/cuda:12.0-base
    command: ["/bin/sh", "-c", "nvidia-smi; sleep 3600"]
    resources:
      claims:
      - name: gpu-access
  resourceClaims:
  - name: gpu-access
    source:
      resourceClaimTemplateName: gpu-claim-template

Advanced Concept: Unlike PVCs, ResourceClaims have a allocationMode. Setting this to WaitForFirstConsumer (similar to storage) ensures that the GPU is not locked to a node until the Pod is actually scheduled, preventing resource fragmentation.

Structured Parameters: The “Game Changer” for Scheduler Performance

Early iterations of DRA had a major flaw: the Scheduler had to communicate with a sidecar controller via gRPC for every pod to check if a claim could be satisfied. This was too slow for large clusters.

Structured Parameters (introduced in KEP-3063) solves this.

  • How it works: The Driver publishes ResourceSlice objects containing the device inventory and opaque parameters. However, the constraints are defined in a standardized format that the Scheduler understands natively.
  • The Result: The generic Kubernetes Scheduler can calculate which node satisfies a ResourceClaim entirely in-memory, without network round-trips to external drivers. It only calls the driver for the final “Allocation” confirmation.

Best Practices for Production DRA

As you migrate from Device Plugins to DRA, keep these architectural constraints in mind:

  1. Namespace Isolation: Unlike device plugins which are node-global, ResourceClaims are namespaced. This provides better multi-tenancy security but requires stricter RBAC management for the resource.k8s.io API group.
  2. CDI Integration: DRA relies heavily on the Container Device Interface (CDI) for the actual injection of device nodes into containers. Ensure your container runtime (containerd/CRI-O) is updated to a version that supports CDI injection fully.
  3. Monitoring: The old metric kubelet_device_plugin_allocations will no longer tell the full story. You must monitor `ResourceClaim` statuses. A claim stuck in Pending often indicates that no `ResourceSlice` satisfies the topology constraints.

Frequently Asked Questions (FAQ)

Is Kubernetes DRA ready for production?

As of Kubernetes 1.30, DRA is in Beta. While the API is stabilizing, the ecosystem of drivers (Intel, NVIDIA, AMD) is still maturing. For critical, high-uptime production clusters, a hybrid approach is recommended: keep critical workloads on Device Plugins and experiment with DRA for batch AI jobs.

Can I use DRA and Device Plugins simultaneously?

Yes. You can run the NVIDIA Device Plugin and the NVIDIA DRA Driver on the same node. However, you must ensure they do not manage the same physical devices to avoid conflicts. Typically, this is done by using node labels to segregate “Legacy Nodes” from “DRA Nodes.”

Does DRA support GPU sharing (MIG/Time-Slicing)?

Yes, and arguably better than before. DRA allows drivers to expose “Shared” claims where multiple Pods reference the same `ResourceClaim` object, or where the driver creates multiple slices representing fractions of a physical GPU (e.g., MIG instances) with distinct attributes.

Conclusion

Kubernetes DRA represents the maturation of Kubernetes as a platform for high-performance computing. By treating devices as first-class schedulable resources rather than opaque counters, we unlock the ability to manage complex topologies, improve cluster density, and standardize how we consume hardware.

While the migration requires learning new API objects like ResourceClaim and ResourceSlice, the control it offers over GPU workloads makes it an essential upgrade for any serious AI/ML platform team. Thank you for reading the DevopsRoles page!