Tag Archives: DevOps

Securely Scale AWS with Terraform Sentinel Policy

In high-velocity engineering organizations, the “move fast and break things” mantra often collides violently with security compliance and cost governance. As you scale AWS infrastructure using Infrastructure as Code (IaC), manual code reviews become the primary bottleneck. For expert practitioners utilizing Terraform Cloud or Enterprise, the solution isn’t slowing down-it’s automating governance. This is the domain of Terraform Sentinel Policy.

Sentinel is HashiCorp’s embedded policy-as-code framework. Unlike external linting tools that check syntax, Sentinel sits directly in the provisioning path, intercepting the Terraform plan before execution. It allows SREs and Platform Engineers to define granular, logic-based guardrails that enforce CIS benchmarks, limit blast radius, and control costs without hindering developer velocity. In this guide, we will bypass the basics and dissect how to architect, write, and test advanced Sentinel policies for enterprise-grade AWS environments.

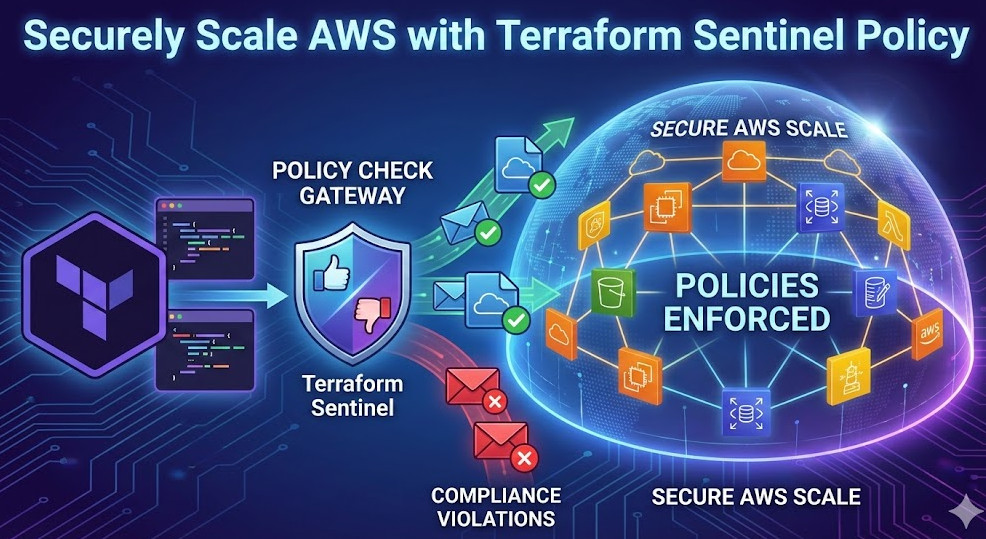
The Architecture of Policy Enforcement

To leverage Terraform Sentinel Policy effectively, one must understand where it lives in the lifecycle. Sentinel runs in a sandboxed environment within the Terraform Cloud/Enterprise execution layer. It does not have direct access to the internet or your cloud provider APIs; instead, it relies on imports to make decisions based on context.

When a run is triggered:

  1. Plan Phase: Terraform generates the execution plan.
  2. Policy Check: Sentinel evaluates the plan against your defined policy sets.
  3. Decision: The run is allowed, halted (Hard Mandatory), or flagged for override (Soft Mandatory).
  4. Apply Phase: Provisioning occurs only if the policy check passes.

Pro-Tip: The tfplan/v2 import is the standard for accessing resource data. Avoid the legacy tfplan import as it lacks the detailed resource changes structure required for complex AWS resource evaluations.

Anatomy of an AWS Sentinel Policy

A robust policy typically consists of three phases: Imports, Filtering, and Evaluation. Let’s examine a scenario where we must ensure all AWS S3 buckets have server-side encryption enabled.

1. The Setup

First, we define our imports and useful helper functions to filter the plan for specific resource types.

import "tfplan/v2" as tfplan

# Filter resources by type
get_resources = func(type) {
  resources = {}
  for tfplan.resource_changes as address, rc {
    if rc.type is type and
       (rc.change.actions contains "create" or rc.change.actions contains "update") {
      resources[address] = rc
    }
  }
  return resources
}

# Fetch all S3 Buckets
s3_buckets = get_resources("aws_s3_bucket")

2. The Logic Rule

Next, we iterate through the filtered resources to validate their configuration. Note the use of the all quantifier, which ensures the rule returns true only if every instance passes the check.

# Rule: specific encryption configuration check
encryption_enforced = rule {
  all s3_buckets as _, bucket {
    keys(bucket.change.after) contains "server_side_encryption_configuration" and
    length(bucket.change.after.server_side_encryption_configuration) > 0
  }
}

# Main Rule
main = rule {
  encryption_enforced
}

This policy inspects the after state—the predicted state of the resource after the apply—ensuring that we are validating the final outcome, not just the code written in main.tf.

Advanced AWS Scaling Patterns

Scaling securely on AWS requires more than just resource configuration checks. It requires context-aware policies. Here are two advanced patterns for expert SREs.

Pattern 1: Cost Control via Instance Type Allow-Listing

To prevent accidental provisioning of expensive x1e.32xlarge instances, use a policy that compares requested types against an allowed list.

# Allowed EC2 types
allowed_types = ["t3.micro", "t3.small", "m5.large"]

# Check function
instance_type_allowed = rule {
  all get_resources("aws_instance") as _, instance {
    instance.change.after.instance_type in allowed_types
  }
}

Pattern 2: Enforcing Mandatory Tags for Cost Allocation

At scale, untagged resources are “ghost resources.” You can enforce that every AWS resource created carries specific tags (e.g., CostCenter, Environment).

mandatory_tags = ["CostCenter", "Environment"]

validate_tags = rule {
  all get_resources("aws_instance") as _, instance {
    all mandatory_tags as t {
      keys(instance.change.after.tags) contains t
    }
  }
}

Testing and Mocking Policies

Writing policy is development. Therefore, it requires testing. You should never push a Terraform Sentinel Policy to production without verifying it against mock data.

Use the Sentinel CLI to generate mocks from real Terraform plans:

$ terraform plan -out=tfplan
$ terraform show -json tfplan > plan.json
$ sentinel apply -trace policy.sentinel

By creating a suite of test cases (passing and failing mocks), you can integrate policy testing into your CI/CD pipeline, ensuring that a change to the governance logic doesn’t accidentally block legitimate deployments.

Enforcement Levels: The Deployment Strategy

When rolling out new policies, avoid the “Big Bang” approach. Sentinel offers three enforcement levels:

  • Advisory: Logs a warning but allows the run to proceed. Ideal for testing new policies in production without impact.
  • Soft Mandatory: Halts the run but allows administrators to override. Useful for edge cases where human judgment is required.
  • Hard Mandatory: Halts the run explicitly. No overrides. Use this for strict security violations (e.g., public S3 buckets, open security group 0.0.0.0/0).

Frequently Asked Questions (FAQ)

How does Sentinel differ from OPA (Open Policy Agent)?

While OPA is a general-purpose policy engine using Rego, Sentinel is embedded deeply into the HashiCorp ecosystem. Sentinel’s integration with Terraform Cloud allows it to access data from the Plan, Configuration, and State without complex external setups. However, OPA is often used for Kubernetes (Gatekeeper), whereas Sentinel excels in the Terraform layer.

Can I access cost estimates in my policy?

Yes. Terraform Cloud generates a cost estimate for every plan. By importing tfrun, you can write policies that deny infrastructure changes if the delta in monthly cost exceeds a certain threshold (e.g., increasing the bill by more than $500/month).

Does Sentinel affect the performance of Terraform runs?

Sentinel executes after the plan is calculated. While the execution time of the policy itself is usually negligible (milliseconds to seconds), extensive API calls within the policy (if using external HTTP imports) can add latency. Stick to using the standard tfplan imports for optimal performance.

Conclusion

Implementing Terraform Sentinel Policy is a definitive step towards maturity in your cloud operating model. It shifts security left, turning vague compliance documents into executable code that scales with your AWS infrastructure. By treating policy as code—authoring, testing, and versioning it—you empower your developers to deploy faster with the confidence that the guardrails will catch any critical errors.

Start small: Audit your current AWS environment, identify the top 3 risks (e.g., unencrypted volumes, open security groups), and implement them as Advisory policies today. Thank you for reading the DevopsRoles page!

Unlock the AWS SAA-C03 Exam with This Vibecoded Cheat Sheet

Let’s be real: you don’t need another tutorial defining what an EC2 instance is. If you are targeting the AWS Certified Solutions Architect – Associate (SAA-C03), you likely already know the primitives. The SAA-C03 isn’t just a vocabulary test; it’s a test of your ability to arbitrate trade-offs under constraints.

This AWS SAA-C03 Cheat Sheet is “vibecoded”—stripped of the documentation fluff and optimized for the high-entropy concepts that actually trip up experienced engineers. We are focusing on the sharp edges: complex networking, consistency models, and the specific anti-patterns that AWS penalizes in exam scenarios.

1. Identity & Security: The Policy Evaluation Logic

Security is the highest weighted domain. The exam loves to test the intersection of Identity-based policies, Resource-based policies, and Service Control Policies (SCPs).

IAM Policy Evaluation Flow

Memorize this evaluation order. If you get this wrong, you fail the security questions.

  1. Explicit Deny: Overrides everything.
  2. SCP (Organizations): Filters permissions; does not grant them.
  3. Resource-based Policies: (e.g., S3 Bucket Policy).
  4. Identity-based Policies: (e.g., IAM User/Role).
  5. Implicit Deny: The default state if nothing is explicitly allowed.

Senior Staff Tip: A common “gotcha” on SAA-C03 is Cross-Account access. Even if an IAM Role in Account A has s3:*, it cannot access a bucket in Account B unless Account B’s Bucket Policy explicitly grants access to that Role AR. Both sides must agree.

KMS Envelope Encryption

You don’t encrypt data with the Customer Master Key (CMK/KMS Key). You encrypt data with a Data Key (DK). The CMK encrypts the DK.

  • GenerateDataKey: Returns a plaintext key (to encrypt data) and an encrypted key (to store with data).
  • Decrypt: You send the encrypted DK to KMS; KMS uses the CMK to return the plaintext DK.

2. Networking: The Transit Gateway & Hybrid Era

The SAA-C03 has moved heavy into hybrid connectivity. Legacy VPC Peering is still tested, but AWS Transit Gateway (TGW) is the answer for scale.

Connectivity Decision Matrix

Requirement AWS Service Why?
High Bandwidth, Private, Consistent Direct Connect (DX) Dedicate fiber. No internet jitter.
Quick Deployment, Encrypted, Cheap Site-to-Site VPN Uses public internet. Quick setup.
Transitive Routing (Many VPCs) Transit Gateway Hub-and-spoke topology. Solves the mesh peeling limits.
SaaS exposure via Private IP PrivateLink (VPC Endpoint) Keeps traffic on AWS backbone. No IGW needed.

Route 53 Routing Policies

Don’t confuse Latency-based (performance) with Geolocation (compliance/GDPR).

  • Failover: Active-Passive (Primary/Secondary).
  • Multivalue Answer: Poor man’s load balancing (returns multiple random IPs).
  • Geoproximity: Bias traffic based on physical distance (requires Traffic Flow).

3. Storage: Performance & Consistency Nuances

You know S3 and EBS. But do you know how they break?

S3 Consistency Model

Since Dec 2020, S3 is Strongly Consistent for all PUTs and DELETEs.

Old exam dumps might say “Eventual Consistency”—they are wrong. Update your mental model.

EBS Volume Types (The “io2 vs gp3” War)

The exam will ask you to optimize for cost vs. IOPS.

  • gp3: The default. You can scale IOPS and Throughput independent of storage size.
  • io2 Block Express: Sub-millisecond latency. Use for Mission Critical DBs (SAP HANA, Oracle). Expensive.
  • st1/sc1: HDD based. Throughput optimized. Great for Big Data/Log processing. Cannot be boot volumes.

EFS vs FSx


IF workload == "Linux specific" AND "Shared File System":
    Use **Amazon EFS** (POSIX compliant, grew/shrinks auto)

IF workload == "Windows" OR "SMB" OR "Active Directory":
    Use **FSx for Windows File Server**

IF workload == "HPC" OR "Lustre":
    Use **FSx for Lustre** (S3 backed high-performance filesystem)
    

4. Decoupling & Serverless Architecture

Microservices are the heart of modern AWS architecture. The exam focuses on how to buffer and process asynchronous data.

SQS vs SNS vs EventBridge

  • SQS (Simple Queue Service): Pull-based. Use for buffering to prevent downstream throttling.


    Limit: Standard = Unlimited throughput. FIFO = 300/s (or 3000/s with batching).
  • SNS (Simple Notification Service): Push-based. Fan-out architecture (One message -> SQS, Lambda, Email).
  • EventBridge: The modern bus. Content-based filtering and schema registry. Use for SaaS integrations and decoupled event routing.

Pro-Tip: If the exam asks about maintaining order in a distributed system, the answer is almost always SQS FIFO groups. If it asks about “filtering events before processing,” look for EventBridge.

Frequently Asked Questions (FAQ)

What is the difference between Global Accelerator and CloudFront?

CloudFront caches content at the edge (great for static HTTP/S content). Global Accelerator uses the AWS global network to improve performance for TCP/UDP traffic (great for gaming, VoIP, or non-HTTP protocols) by proxying packets to the nearest edge location. It does not cache.

When should I use Kinesis Data Streams vs. Firehose?

Use Data Streams when you need custom processing, real-time analytics, or replay capability (data stored for 1-365 days). Use Firehose when you just need to load data into S3, Redshift, or OpenSearch with zero administration (load & dump).

How do I handle “Database Migration” questions?

Look for AWS DMS (Database Migration Service). If the schema is different (e.g., Oracle to Aurora PostgreSQL), you must combine DMS with the SCT (Schema Conversion Tool).

Conclusion

This AWS SAA-C03 Cheat Sheet covers the structural pillars of the exam. Remember, the SAA-C03 is looking for the “AWS Way”—which usually means decoupled, stateless, and managed services over monolithic EC2 setups. When in doubt on the exam: De-couple it (SQS), Cache it (ElastiCache/CloudFront), and Secure it (IAM/KMS).

For deep dives into specific limits, always verify with the AWS General Reference. Thank you for reading the DevopsRoles page!

OpenEverest: Effortless Database Management on Kubernetes

For years, the adage in the DevOps community was absolute: “Run your stateless apps on Kubernetes, but keep your databases on bare metal or managed cloud services.” While this advice minimized risk in the early days of container orchestration, the ecosystem has matured. Today, Database Management on Kubernetes is not just possible-it is often the preferred architecture for organizations seeking cloud agnosticism, granular control over storage topology, and unified declarative infrastructure.

However, native Kubernetes primitives like StatefulSets and PersistentVolumeClaims (PVCs) only solve the deployment problem. They do not address the “Day 2” operational nightmares: automated failover, point-in-time recovery (PITR), major version upgrades, and topology-aware scheduling. This is where OpenEverest enters the chat. In this guide, we dissect how OpenEverest leverages the Operator pattern to transform Kubernetes into a database-aware control plane.

The Evolution of Stateful Workloads on K8s

To understand the value proposition of OpenEverest, we must first acknowledge the limitations of raw Kubernetes for data-intensive applications. Experienced SREs know that a database is not just a pod with a disk attached; it is a complex distributed system that requires strict ordering, consensus, and data integrity.

Why StatefulSets Are Insufficient

While the StatefulSet controller guarantees stable network IDs and ordered deployment, it lacks application-level awareness.

  • No Semantic Knowledge: K8s doesn’t know that a PostgreSQL primary needs to be demoted before a new leader is elected; it just kills the pod.
  • Storage Blindness: Standard PVCs don’t handle volume expansion or snapshots in a database-consistent manner (flushing WALs to disk before snapshotting).
  • Config Drift: Managing my.cnf or postgresql.conf via ConfigMaps requires manual reloads or pod restarts, often causing downtime.

Pro-Tip: In high-performance database environments on K8s, always configure your StorageClasses with volumeBindingMode: WaitForFirstConsumer. This ensures the PVC is not bound until the scheduler places the Pod, allowing K8s to respect zone-anti-affinity rules and keeping data local to the compute node where possible.

OpenEverest: The Operator-First Approach

OpenEverest abstracts the complexity of database management on Kubernetes by codifying operational knowledge into a Custom Resource Definition (CRD) and a custom controller. It essentially places a robot DBA inside your cluster.

Architecture Overview

OpenEverest operates on the Operator pattern. It watches for changes in custom resources (like DatabaseCluster) and reconciles the current state of the cluster with the desired state defined in your manifest.

  1. Custom Resource (CR): The developer defines the intent (e.g., “I want a 3-node Percona XtraDB Cluster with 100GB storage each”).
  2. Controller Loop: The OpenEverest operator detects the CR. It creates the necessary StatefulSets, Services, Secrets, and ConfigMaps.
  3. Sidecar Injection: OpenEverest injects sidecars for logging, metrics (Prometheus exporters), and backup agents (e.g., pgBackRest or Xtrabackup) into the database pods.

Core Capabilities for Production Environments

1. Automated High Availability (HA) & Failover

OpenEverest implements intelligent consensus handling. In a MySQL/Percona environment, it manages the Galera cluster bootstrapping process automatically. For PostgreSQL, it often leverages tools like Patroni within the pods to manage leader elections via K8s endpoints or etcd.

Crucially, OpenEverest handles Pod Disruption Budgets (PDBs) automatically, preventing Kubernetes node upgrades from taking down the entire database cluster simultaneously.

2. Declarative Scaling and Upgrades

Scaling a database vertically (adding CPU/RAM) or horizontally (adding read replicas) becomes a simple patch to the YAML manifest. The operator handles the rolling update, ensuring that replicas are updated first, followed by a controlled failover of the primary, and finally the update of the old primary.

apiVersion: everest.io/v1alpha1
kind: DatabaseCluster
metadata:
  name: production-db
spec:
  engine: postgresql
  version: "14.5"
  instances: 3 # Just change this to 5 for horizontal scaling
  resources:
    requests:
      cpu: "4"
      memory: "16Gi" # Update this for vertical scaling
  storage:
    size: 500Gi
    class: io1-fast

3. Day-2 Operations: Backup & Recovery

Perhaps the most critical aspect of database management on Kubernetes is disaster recovery. OpenEverest integrates with S3-compatible storage (AWS S3, MinIO, GCS) to stream Write-Ahead Logs (WAL) continuously.

  • Scheduled Backups: Define cron-style schedules directly in the CRD.
  • PITR (Point-in-Time Recovery): The operator provides a simple interface to clone a database cluster from a specific timestamp, essential for undoing accidental DROP TABLE commands.

Advanced Configuration: Tuning for Performance

Expert SREs know that default container settings are rarely optimal for databases. OpenEverest allows for deep customization.

Kernel Tuning & HugePages

Databases like PostgreSQL benefit significantly from HugePages. OpenEverest facilitates the mounting of HugePages resources and configuring vm.nr_hugepages via init containers or privileged sidecars, assuming the underlying nodes are provisioned correctly.

Advanced Concept: Anti-Affinity Rules
To survive an Availability Zone (AZ) failure, your database pods must be spread across different nodes and zones. OpenEverest automatically injects podAntiAffinity rules. However, for strict hard-multi-tenancy, you should verify these rules leverage topology.kubernetes.io/zone as the topology key.

Implementation Guide

Below is a production-ready example of deploying a highly available database cluster using OpenEverest.

Step 1: Install the Operator

Typically done via Helm. This installs the CRDs and the controller deployment.

helm repo add open-everest https://charts.open-everest.io
helm install open-everest-operator open-everest/operator --namespace db-operators --create-namespace

Step 2: Deploy the Cluster Manifest

This YAML requests a 3-node HA cluster with anti-affinity, dedicated storage class, and backup configuration.

apiVersion: everest.io/v1alpha1
kind: DatabaseCluster
metadata:
  name: order-service-db
  namespace: backend
spec:
  engine: percona-xtradb-cluster
  version: "8.0"
  replicas: 3
  
  # Anti-Affinity ensures pods are on different nodes
  affinity:
    antiAffinityTopologyKey: "kubernetes.io/hostname"

  # Persistent Storage Configuration
  volumeSpec:
    pvc:
      storageClassName: gp3-encrypted
      accessModes: [ "ReadWriteOnce" ]
      resources:
        requests:
          storage: 100Gi

  # Automated Backups to S3
  backup:
    enabled: true
    schedule: "0 0 * * *" # Daily at midnight
    storageName: s3-backup-conf
    
  # Monitoring Sidecars
  monitoring:
    pmm:
      enabled: true
      url: "http://pmm-server.monitoring.svc.cluster.local"

Frequently Asked Questions (FAQ)

Can I run stateful workloads on Spot Instances?

Generally, no. While K8s handles pod rescheduling, the time taken for a database to recover (crash recovery, replay WAL) is often longer than the application tolerance for downtime. However, running Read Replicas on Spot instances is a viable cost-saving strategy if your operator supports splitting node pools for primary vs. replica.

How does OpenEverest handle storage resizing?

Kubernetes allows PVC expansion (if the StorageClass supports allowVolumeExpansion: true). OpenEverest detects the change in the CRD, expands the PVC, and then restarts the pods one by one (if required by the filesystem) to recognize the new size, ensuring zero downtime.

Is this suitable for multi-region setups?

Cross-region replication adds significant latency constraints. OpenEverest typically manages clusters within a single region (multi-AZ). For multi-region, you would deploy independent clusters in each region and set up asynchronous replication between them, often using an external load balancer or service mesh for traffic routing.

Conclusion

Database Management on Kubernetes has graduated from experimental to essential. Tools like OpenEverest bridge the gap between the stateless design of Kubernetes and the stateful requirements of modern databases. By leveraging Operators, we gain the self-healing, auto-scaling, and declarative benefits of K8s without sacrificing data integrity.

For the expert SRE, the move to OpenEverest reduces the cognitive load of “Day 2” operations, allowing teams to focus on query optimization and architecture rather than manual backups and failover drills. Thank you for reading the DevopsRoles page!

Seamlessly Import Custom EC2 Key Pairs to AWS

In a mature DevOps environment, relying on AWS-generated key pairs often creates technical debt. AWS-generated keys are region-specific, difficult to rotate programmatically, and often leave private keys sitting in download folders rather than secure vaults. To achieve multi-region consistency and enforce strict security compliance, expert practitioners choose to import EC2 key pairs generated externally.

By bringing your own public key material to AWS, you gain full control over the private key lifecycle, enabling usage of hardware security modules (HSMs) or YubiKeys for generation, and simplifying fleet management across global infrastructure. This guide covers the technical implementation of importing keys via the AWS CLI, Terraform, and CloudFormation, specifically tailored for high-scale environments.

Why Import Instead of Create?

While aws ec2 create-key-pair is convenient for sandboxes, it is rarely suitable for production. Importing your key material offers specific architectural advantages:

  • Multi-Region Consistency: An imported public key can share the same name and cryptographic material across us-east-1, eu-central-1, and ap-southeast-1. This allows you to use a single private key to authenticate against instances globally, simplifying your SSH config and Bastion host setups.
  • Security Provenance: You can generate the private key on an air-gapped machine or within a secure enclave, ensuring the private key never touches the network—not even AWS’s API response.
  • Algorithm Choice: While AWS now supports ED25519, importing gives you granular control over the specific generation parameters (e.g., rounds of hashing for the passphrase) before the cloud provider ever sees the public half.

Pro-Tip: AWS only stores the public key. When you “import” a key pair, you are uploading the public key material (usually id_rsa.pub or id_ed25519.pub). AWS calculates the fingerprint from this material. You remain the sole custodian of the private key.

Prerequisites and Key Generation Standards

Before you import EC2 key pairs, ensure your key material meets AWS specifications.

Supported Formats

  • Type: RSA (2048 or 4096-bit) or ED25519.
  • Format: OpenSSH public key format (Base64 encoded).
  • RFC Compliance: RFC 4716 (SSH2) is generally supported, but standard OpenSSH format is preferred for compatibility.

Generating a Production-Grade Key

If you do not already have a key from your security team, generate one using modern standards. We recommend ED25519 for performance and security, provided your AMI OS supports it (most modern Linux distros do).

# Generate an ED25519 key with a specific comment
ssh-keygen -t ed25519 -C "prod-fleet-access-2025" -f ~/.ssh/prod-key

# Output the public key to verify format (starts with ssh-ed25519)
cat ~/.ssh/prod-key.pub

Method 1: The AWS CLI Approach (Shell Automation)

The AWS CLI is the fastest way to register a key, particularly when bootstrapping a new environment. The core command is import-key-pair.

Basic Import

aws ec2 import-key-pair \
    --key-name "prod-global-key" \
    --public-key-material fileb://~/.ssh/prod-key.pub

Note the use of fileb:// which tells the CLI to treat the file as binary blob data, preventing encoding issues on some shells.

Advanced: Multi-Region Import Script

A common requirement for SREs is ensuring the key exists in every active region. Here is a bash loop to import EC2 key pairs across all enabled regions:

#!/bin/bash
KEY_NAME="prod-global-key"
PUB_KEY_PATH="~/.ssh/prod-key.pub"

# Get list of all available regions
regions=$(aws ec2 describe-regions --query "Regions[].RegionName" --output text)

for region in $regions; do
    echo "Importing key to $region..."
    aws ec2 import-key-pair \
        --region "$region" \
        --key-name "$KEY_NAME" \
        --public-key-material "fileb://$PUB_KEY_PATH" \
        || echo "Key may already exist in $region"
done

Method 2: Infrastructure as Code (Terraform)

For persistent infrastructure, Terraform is the standard. Using the aws_key_pair resource allows you to manage the lifecycle of the key registration without exposing the private key in your state file (since you only provide the public key).

resource "aws_key_pair" "production_key" {
  key_name   = "prod-access-key"
  public_key = file("~/.ssh/prod-key.pub")
  
  tags = {
    Environment = "Production"
    ManagedBy   = "Terraform"
  }
}

output "key_pair_id" {
  value = aws_key_pair.production_key.key_pair_id
}

Security Warning: Do not hardcode the public key string directly into the Terraform code if the repo is public. While public keys are not “secrets” in the same vein as private keys, exposing internal infrastructure identifiers is bad practice. Use the file() function or pass it as a variable.

Method 3: CloudFormation

If you are operating strictly within the AWS ecosystem or utilizing Service Catalog, CloudFormation is your tool.

AWSTemplateFormatVersion: '2010-09-09'
Description: Import a custom EC2 Key Pair

Parameters:
  PublicKeyMaterial:
    Type: String
    Description: The OpenSSH public key string (ssh-rsa AAAA...)

Resources:
  ImportedKeyPair:
    Type: AWS::EC2::KeyPair
    Properties: 
      KeyName: "prod-cfn-key"
      PublicKeyMaterial: !Ref PublicKeyMaterial
      Tags: 
        - Key: Purpose
          Value: Automation

Troubleshooting Common Import Errors

Even expert engineers encounter friction when dealing with encoding standards. Here are the most common failures when you attempt to import EC2 key pairs.

1. “Invalid Key.Format”

This usually happens if you attempt to upload the key in PEM format or PKCS#8 format instead of OpenSSH format. AWS expects the string to begin with ssh-rsa or ssh-ed25519 followed by the base64 body.

Fix: Ensure you are uploading the .pub file, not the private key. If you generated the key with OpenSSL directly, convert it:

ssh-keygen -y -f private_key.pem > public_key.pub

2. “Length exceeds maximum”

AWS has a strict size limit for key names (255 ASCII characters) and the public key material itself. While standard 2048-bit or 4096-bit RSA keys fit easily, pasting a key with extensive metadata or newlines can trigger this. Ensure the public key is a single line without line breaks.

Frequently Asked Questions (FAQ)

Can I import a private key into AWS EC2?

No. The EC2 service only stores the public key. AWS does not have a vault for your private SSH keys associated with EC2 Key Pairs. If you lose your private key, you cannot recover it from the AWS console.

Does importing a key allow access to existing instances?

No. The Key Pair is injected into the instance only during the initial launch (via cloud-init). To add a key to a running instance, you must manually append the public key string to the ~/.ssh/authorized_keys file on that server.

How do I rotate an imported key pair?

Since EC2 key pairs are immutable, you cannot “update” the material behind a key name. You must:
1. Import the new key with a new name (e.g., prod-key-v2).
2. Update your Auto Scaling Groups or Terraform code to reference the new key.
3. Roll your instances to pick up the new configuration.

Conclusion

The ability to import EC2 key pairs is a fundamental skill for securing cloud infrastructure at scale. By decoupling key generation from key registration, you ensure that your cryptographic assets remain under your control while enabling seamless multi-region operations. Whether you utilize the AWS CLI for quick tasks or Terraform for stateful management, standardization on imported keys is a hallmark of a production-ready AWS environment.Thank you for reading the DevopsRoles page!

Mastering Factorio with Terraform: The Ultimate Automation Guide

For the uninitiated, Factorio is a game about automation. For the Senior DevOps Engineer, it is a spiritual mirror of our daily lives. You start by manually crafting plates (manual provisioning), move to burner drills (shell scripts), and eventually build a mega-base capable of launching rockets per minute (fully automated Kubernetes clusters).

But why stop at automating the gameplay? As infrastructure experts, we know that the factory must grow, and the server hosting it should be as resilient and reproducible as the factory itself. In this guide, we will bridge the gap between gaming and professional Infrastructure as Code (IaC). We are going to deploy a high-performance, cost-optimized, and fully persistent Factorio dedicated server using Factorio with Terraform.

Why Terraform for a Game Server?

If you are reading this, you likely already know Terraform’s value proposition. However, applying it to stateful workloads like game servers presents unique challenges that test your architectural patterns.

  • Immutable Infrastructure: Treat the game server binary and OS as ephemeral. Only the /saves directory matters.
  • Cost Control: Factorio servers don’t need to run 24/7 if no one is playing. Terraform allows you to spin up the infrastructure for a weekend session and destroy it Sunday night, while preserving state.
  • Disaster Recovery: If your server crashes or the instance degrades, a simple terraform apply brings the factory back online in minutes.

Pro-Tip: Factorio is heavily single-threaded. When choosing your compute instance (e.g., AWS EC2), prioritize high clock speeds (GHz) over core count. An AWS c5.large or c6i.large is often superior to general-purpose instances for maintaining 60 UPS (Updates Per Second) on large mega-bases.

Architecture Overview

We will design a modular architecture on AWS, though the concepts apply to GCP, Azure, or DigitalOcean. Our stack includes:

  • Compute: EC2 Instance (optimized for compute).
  • Storage: Separate EBS volume for game saves (preventing data loss on instance termination) or an S3-sync strategy.
  • Network: VPC, Subnet, and Security Groups allowing UDP/34197.
  • Provisioning: Cloud-Init (`user_data`) to bootstrap Docker and the headless Factorio container.

Step 1: The Network & Security Layer

Factorio uses UDP port 34197 by default. Unlike HTTP services, we don’t need a complex Load Balancer; a direct public IP attachment is sufficient and reduces latency.

resource "aws_security_group" "factorio_sg" {
  name        = "factorio-allow-udp"
  description = "Allow Factorio UDP traffic"
  vpc_id      = module.vpc.vpc_id

  ingress {
    description = "Factorio Game Port"
    from_port   = 34197
    to_port     = 34197
    protocol    = "udp"
    cidr_blocks = ["0.0.0.0/0"]
  }

  ingress {
    description = "SSH Access (Strict)"
    from_port   = 22
    to_port     = 22
    protocol    = "tcp"
    cidr_blocks = [var.admin_ip] # Always restrict SSH!
  }

  egress {
    from_port   = 0
    to_port     = 0
    protocol    = "-1"
    cidr_blocks = ["0.0.0.0/0"]
  }
}

Step 2: Persistent Storage Strategy

This is the most critical section. In a “Factorio with Terraform” setup, if you run terraform destroy, you must not lose the factory. We have two primary patterns:

  1. EBS Volume Attachment: A dedicated EBS volume that exists outside the lifecycle of the EC2 instance.
  2. S3 Sync (The Cloud-Native Way): The instance pulls the latest save from S3 on boot and pushes it back on shutdown (or via cron).

For experts, I recommend the S3 Sync pattern for true immutability. It avoids the headaches of EBS volume attachment states and availability zone constraints.

resource "aws_iam_role_policy" "factorio_s3_access" {
  name = "factorio_s3_policy"
  role = aws_iam_role.factorio_role.id

  policy = jsonencode({
    Version = "2012-10-17"
    Statement = [
      {
        Action = [
          "s3:GetObject",
          "s3:PutObject",
          "s3:ListBucket"
        ]
        Effect   = "Allow"
        Resource = [
          aws_s3_bucket.factorio_saves.arn,
          "${aws_s3_bucket.factorio_saves.arn}/*"
        ]
      },
    ]
  })
}

Step 3: The Compute Instance & Cloud-Init

We use the user_data field to bootstrap the environment. We will utilize the community-standard factoriotools/factorio Docker image. This image is robust and handles updates automatically.

data "template_file" "user_data" {
  template = file("${path.module}/scripts/setup.sh.tpl")

  vars = {
    bucket_name = aws_s3_bucket.factorio_saves.id
    save_file   = "my-megabase.zip"
  }
}

resource "aws_instance" "server" {
  ami           = data.aws_ami.ubuntu.id
  instance_type = "c5.large" # High single-core performance
  
  subnet_id                   = module.vpc.public_subnets[0]
  vpc_security_group_ids      = [aws_security_group.factorio_sg.id]
  iam_instance_profile        = aws_iam_instance_profile.factorio_profile.name
  user_data                   = data.template_file.user_data.rendered

  # Spot instances can save you 70% cost, but ensure you handle interruption!
  instance_market_options {
    market_type = "spot"
  }

  tags = {
    Name = "Factorio-Server"
  }
}

The Cloud-Init Script (setup.sh.tpl)

The bash script below handles the “hydrate” phase (downloading save) and the “run” phase.

#!/bin/bash
# Install Docker and AWS CLI
apt-get update && apt-get install -y docker.io awscli

# 1. Hydrate: Download latest save from S3
mkdir -p /opt/factorio/saves
aws s3 cp s3://${bucket_name}/${save_file} /opt/factorio/saves/save.zip || echo "No save found, starting fresh"

# 2. Permissions
chown -R 845:845 /opt/factorio

# 3. Run Factorio Container
docker run -d \
  -p 34197:34197/udp \
  -v /opt/factorio:/factorio \
  --name factorio \
  --restart always \
  factoriotools/factorio

# 4. Setup Auto-Save Sync (Crontab)
echo "*/5 * * * * aws s3 sync /opt/factorio/saves s3://${bucket_name}/ --delete" > /tmp/cronjob
crontab /tmp/cronjob

Advanced Concept: To prevent data loss on Spot Instance termination, listen for the EC2 Instance Termination Warning (via metadata service) and trigger a force-save and S3 upload immediately.

Managing State and Updates

One of the benefits of using Factorio with Terraform is update management. When Wube Software releases a new version of Factorio:

  1. Update the Docker tag in your Terraform variable or Cloud-Init script.
  2. Run terraform apply (or taint the instance).
  3. Terraform replaces the instance.
  4. Cloud-Init pulls the save from S3 and the new binary version.
  5. The server is back online in 2 minutes with the latest patch.

Cost Optimization: The Weekend Warrior Pattern

Running a c5.large 24/7 can cost roughly $60-$70/month. If you only play on weekends, this is wasteful.

By wrapping your Terraform configuration in a CI/CD pipeline (like GitHub Actions), you can create a “ChatOps” workflow (e.g., via Discord slash commands). A command like /start-server triggers terraform apply, and /stop-server triggers terraform destroy. Because your state is safely in S3 (both Terraform state and Game save state), you pay $0 for compute during the week.

Frequently Asked Questions (FAQ)

Can I use Terraform to manage in-game mods?

Yes. The factoriotools/factorio image supports a mods/ directory. You can upload your mod-list.json and zip files to S3, and have the Cloud-Init script pull them alongside the save file. Alternatively, you can define the mod list as an environment variable passed into the container.

How do I handle the initial world generation?

If no save file exists in S3 (the first run), the Docker container will generate a new map based on the server-settings.json. Once generated, your cron job will upload this new save to S3, establishing the persistence loop.

Is Terraform overkill for a single server?

For a “click-ops” manual setup, maybe. But as an expert, you know that “manual” means “unmaintainable.” Terraform documents your configuration, allows for version control of your server settings, and enables effortless migration between cloud providers or regions.

Conclusion

Deploying Factorio with Terraform is more than just a fun project; it is an exercise in designing stateful, resilient applications on ephemeral infrastructure. By decoupling storage (S3) from compute (EC2) and automating the configuration via Cloud-Init, you achieve a server setup that is robust, cheap to run, and easy to upgrade.

The factory must grow, and now, your infrastructure can grow with it. Thank you for reading the DevopsRoles page!

Deploy Generative AI with Terraform: Automated Agent Lifecycle

The shift from Jupyter notebooks to production-grade infrastructure is often the “valley of death” for AI projects. While data scientists excel at model tuning, the operational reality of managing API quotas, secure context retrieval, and scalable inference endpoints requires rigorous engineering. This is where Generative AI with Terraform becomes the critical bridge between experimental code and reliable, scalable application delivery.

In this guide, we will bypass the basics of “what is IaC” and focus on architecting a robust automated lifecycle for Generative AI agents. We will cover provisioning vector databases for RAG (Retrieval-Augmented Generation), securing LLM credentials via Secrets Manager, and deploying containerized agents using Amazon ECS—all defined strictly in HCL.

The Architecture of AI-Native Infrastructure

When we talk about deploying Generative AI with Terraform, we are typically orchestrating three distinct layers. Unlike traditional web apps, AI applications require specialized state management for embeddings and massive compute bursts for inference.

  • Knowledge Layer (RAG): Vector databases (e.g., Pinecone, Milvus, or AWS OpenSearch) to store embeddings.
  • Inference Layer (Compute): Containers hosting the orchestration logic (LangChain/LlamaIndex) running on ECS, EKS, or Lambda.
  • Model Gateway (API): Secure interfaces to foundation models (AWS Bedrock, OpenAI, Anthropic).

Pro-Tip for SREs: Avoid managing model weights directly in Terraform state. Terraform is designed for infrastructure state, not gigabyte-sized binary blobs. Use Terraform to provision the S3 buckets and permissions, but delegate the artifact upload to your CI/CD pipeline or DVC (Data Version Control).

1. Provisioning the Knowledge Base (Vector Store)

For a RAG architecture, the vector store is your database. Below is a production-ready pattern for deploying an AWS OpenSearch Serverless collection, which serves as a highly scalable vector store compatible with LangChain.

resource "aws_opensearchserverless_collection" "agent_memory" {
  name        = "gen-ai-agent-memory"
  type        = "VECTORSEARCH"
  description = "Vector store for Generative AI embeddings"

  depends_on = [aws_opensearchserverless_security_policy.encryption]
}

resource "aws_opensearchserverless_security_policy" "encryption" {
  name        = "agent-memory-encryption"
  type        = "encryption"
  policy      = jsonencode({
    Rules = [
      {
        ResourceType = "collection"
        Resource = ["collection/gen-ai-agent-memory"]
      }
    ],
    AWSOwnedKey = true
  })
}

output "vector_endpoint" {
  value = aws_opensearchserverless_collection.agent_memory.collection_endpoint
}

This HCL snippet ensures that encryption is enabled by default—a non-negotiable requirement for enterprise AI apps handling proprietary data.

2. Securing LLM Credentials

Hardcoding API keys is a cardinal sin in DevOps, but in GenAI, it’s also a financial risk due to usage-based billing. We leverage AWS Secrets Manager to inject keys into our agent’s environment at runtime.

resource "aws_secretsmanager_secret" "openai_api_key" {
  name        = "production/gen-ai/openai-key"
  description = "API Key for OpenAI Model Access"
}

resource "aws_iam_role_policy" "ecs_task_secrets" {
  name = "ecs-task-secrets-access"
  role = aws_iam_role.ecs_task_execution_role.id

  policy = jsonencode({
    Version = "2012-10-17"
    Statement = [
      {
        Action = "secretsmanager:GetSecretValue"
        Effect = "Allow"
        Resource = aws_secretsmanager_secret.openai_api_key.arn
      }
    ]
  })
}

By explicitly defining the IAM policy, we adhere to the principle of least privilege. The container hosting the AI agent can strictly access only the specific secret required for inference.

3. Deploying the Agent Runtime (ECS Fargate)

For agents that require long-running processes (e.g., maintaining WebSocket connections or processing large documents), AWS Lambda often hits timeout limits. ECS Fargate provides a serverless container environment perfect for hosting Python-based LangChain agents.

resource "aws_ecs_task_definition" "agent_task" {
  family                   = "gen-ai-agent"
  network_mode             = "awsvpc"
  requires_compatibilities = ["FARGATE"]
  cpu                      = 1024
  memory                   = 2048
  execution_role_arn       = aws_iam_role.ecs_task_execution_role.arn

  container_definitions = jsonencode([
    {
      name      = "agent_container"
      image     = "${aws_ecr_repository.agent_repo.repository_url}:latest"
      essential = true
      secrets   = [
        {
          name      = "OPENAI_API_KEY"
          valueFrom = aws_secretsmanager_secret.openai_api_key.arn
        }
      ]
      environment = [
        {
          name  = "VECTOR_DB_ENDPOINT"
          value = aws_opensearchserverless_collection.agent_memory.collection_endpoint
        }
      ]
      logConfiguration = {
        logDriver = "awslogs"
        options = {
          "awslogs-group"         = "/ecs/gen-ai-agent"
          "awslogs-region"        = var.aws_region
          "awslogs-stream-prefix" = "ecs"
        }
      }
    }
  ])
}

This configuration dynamically links the output of your vector store resource (created in Step 1) into the container’s environment variables. This creates a self-healing dependency graph where infrastructure updates automatically propagate to the application configuration.

4. Automating the Lifecycle with Terraform & CI/CD

Deploying Generative AI with Terraform isn’t just about the initial setup; it’s about the lifecycle. As models drift and prompts need updating, you need a pipeline that handles redeployment without downtime.

The “Blue/Green” Strategy for AI Agents

AI agents are non-deterministic. A prompt change that works for one query might break another. Implementing a Blue/Green deployment strategy using Terraform is crucial.

  • Infrastructure (Terraform): Defines the Load Balancer and Target Groups.
  • Application (CodeDeploy): Shifts traffic from the old agent version (Blue) to the new version (Green) gradually.

Using the AWS CodeDeploy Terraform resource, you can script this traffic shift to automatically rollback if error rates spike (e.g., if the LLM starts hallucinating or timing out).

Frequently Asked Questions (FAQ)

Can Terraform manage the actual LLM models?

Generally, no. Terraform is for infrastructure. While you can use Terraform to provision an Amazon SageMaker Endpoint or an EC2 instance with GPU support, the model weights themselves (the artifacts) are better managed by tools like DVC or MLflow. Terraform sets the stage; the ML pipeline puts the actors on it.

How do I handle GPU provisioning for self-hosted LLMs in Terraform?

If you are hosting open-source models (like Llama 3 or Mistral), you will need to specify instance types with GPU acceleration. In the aws_instance or aws_launch_template resource, ensure you select the appropriate instance type (e.g., g5.2xlarge or p3.2xlarge) and utilize a deeply integrated AMI (Amazon Machine Image) like the AWS Deep Learning AMI.

Is Terraform suitable for prompt management?

No. Prompts are application code/configuration, not infrastructure. Storing prompts in Terraform variables creates unnecessary friction. Store prompts in a dedicated database or as config files within your application repository.

Conclusion

Deploying Generative AI with Terraform transforms a fragile experiment into a resilient enterprise asset. By codifying the vector storage, compute environment, and security policies, you eliminate the “it works on my machine” syndrome that plagues AI development.

The code snippets provided above offer a foundational skeleton. As you scale, look into modularizing these resources into reusable Terraform Modules to empower your data science teams to spin up compliant environments on demand. Thank you for reading the DevopsRoles page!

New AWS ECR Remote Build Cache: Turbocharge Your Docker Image Builds

For high-velocity DevOps teams, the “cold cache” problem in ephemeral CI runners is a persistent bottleneck. You spin up a fresh runner, pull your base image, and then watch helplessly as Docker rebuilds layers that haven’t changed simply because the local context is empty. While solutions like inline caching helped, they bloated image sizes. S3 backends added latency.

The arrival of native support for ECR Remote Build Cache changes the game. By leveraging the advanced caching capabilities of Docker BuildKit and the OCI-compliant nature of Amazon Elastic Container Registry (ECR), you can now store cache artifacts directly alongside your images with high throughput and low latency. This guide explores how to implement this architecture to drastically reduce build times in your CI/CD pipelines.

The Evolution of Build Caching: Why ECR?

Before diving into implementation, it is crucial to understand where the ECR Remote Build Cache fits in the Docker optimization hierarchy. Experts know that layer caching is the single most effective way to speed up builds, but the storage mechanism of that cache dictates its efficacy in a distributed environment.

  • Local Cache: Fast but useless in ephemeral CI environments (GitHub Actions, AWS CodeBuild) where the workspace is wiped after every run.
  • Inline Cache (`–cache-from`): Embeds cache metadata into the image itself.


    Drawback: Increases the final image size and requires pulling the full image to extract cache data, wasting bandwidth.
  • Registry Cache (`type=registry`): The modern standard. It pushes cache blobs to a registry as a separate artifact.


    The ECR Advantage: AWS ECR now fully supports the OCI artifacts and manifest lists required by BuildKit, allowing for granular, high-performance cache retrieval without the overhead of S3 or the bloat of inline caching.

Pro-Tip for SREs: Unlike inline caching, the ECR Remote Build Cache allows you to use mode=max. This caches intermediate layers, not just the final stage layers. For multi-stage builds common in Go or Rust applications, this can prevent re-compiling dependencies even if the final image doesn’t contain them.

Architecture: How BuildKit Talks to ECR

The mechanism relies on the Docker BuildKit engine. When you execute a build with the type=registry exporter, BuildKit creates a cache manifest list. This list references the actual cache layers (blobs) stored in ECR.

Because ECR supports OCI 1.1 standards, it can distinguish between a runnable container image and a cache artifact, even though they reside in the same repository infrastructure. This allows your CI runners to pull only the cache metadata needed to determine a cache hit, rather than downloading gigabytes of previous images.

Implementation Guide

1. Prerequisites

Ensure your environment is prepped with the following:

  • Docker Engine: Version 20.10.0+ (BuildKit enabled by default).
  • Docker Buildx: The CLI plugin is required to access advanced cache exporters.
  • IAM Permissions: Your CI role needs standard ecr:GetAuthorizationToken, ecr:BatchCheckLayerAvailability, ecr:PutImage, and ecr:InitiateLayerUpload.

2. Configuring the Buildx Driver

The default Docker driver often limits scope. For advanced caching, create a new builder instance using the docker-container driver. This unlocks features like multi-platform builds and advanced garbage collection.

# Create and bootstrap a new builder
docker buildx create --name ecr-builder \
  --driver docker-container \
  --use

# Verify the builder is running
docker buildx inspect --bootstrap

3. The Build Command

Here is the production-ready command to build an image and push both the image and the cache to ECR. Note the separation of tags: one for the runnable image (`:latest`) and one for the cache (`:build-cache`).

export ECR_REPO="123456789012.dkr.ecr.us-east-1.amazonaws.com/my-app"

docker buildx build \
  --platform linux/amd64,linux/arm64 \
  -t $ECR_REPO:latest \
  --cache-to type=registry,ref=$ECR_REPO:build-cache,mode=max,image-manifest=true,oci-mediatypes=true \
  --cache-from type=registry,ref=$ECR_REPO:build-cache \
  --push \
  .

Key Flags Explained:

  • mode=max: Caches all intermediate layers. Essential for multi-stage builds.
  • image-manifest=true: Generates an image manifest for the cache, ensuring better compatibility with ECR’s lifecycle policies and visual inspection in the AWS Console.
  • oci-mediatypes=true: Forces the use of standard OCI media types, preventing compatibility issues with stricter registry parsers.

CI/CD Integration: GitHub Actions Example

Below is a robust GitHub Actions workflow snippet that authenticates with AWS and utilizes the setup-buildx-action to handle the plumbing.

name: Build and Push to ECR

on:
  push:
    branches: [ "main" ]

jobs:
  build:
    runs-on: ubuntu-latest
    permissions:
      id-token: write # Required for AWS OIDC
      contents: read

    steps:
      - name: Checkout Code
        uses: actions/checkout@v4

      - name: Configure AWS Credentials
        uses: aws-actions/configure-aws-credentials@v4
        with:
          role-to-assume: arn:aws:iam::123456789012:role/GitHubActionsRole
          aws-region: us-east-1

      - name: Login to Amazon ECR
        id: login-ecr
        uses: aws-actions/amazon-ecr-login@v2

      - name: Set up Docker Buildx
        uses: docker/setup-buildx-action@v3

      - name: Build and Push
        uses: docker/build-push-action@v5
        env:
          ECR_REGISTRY: ${{ steps.login-ecr.outputs.registry }}
          ECR_REPOSITORY: my-app
        with:
          context: .
          push: true
          tags: ${{ env.ECR_REGISTRY }}/${{ env.ECR_REPOSITORY }}:latest
          # Advanced Cache Configuration
          cache-from: type=registry,ref=${{ env.ECR_REGISTRY }}/${{ env.ECR_REPOSITORY }}:build-cache
          cache-to: type=registry,ref=${{ env.ECR_REGISTRY }}/${{ env.ECR_REPOSITORY }}:build-cache,mode=max,image-manifest=true,oci-mediatypes=true

Expert Considerations: Storage & Lifecycle Management

One common pitfall when implementing ECR Remote Build Cache with mode=max is the rapid accumulation of untagged storage layers. Since BuildKit generates unique blobs for intermediate layers, your ECR storage costs can spike if left unchecked.

The Lifecycle Policy Fix

Do not apply a blanket “expire untagged images” policy immediately, as cache blobs often appear as untagged artifacts to the ECR control plane. Instead, use the tagPrefixList to protect your cache tags specifically, or rely on the fact that BuildKit manages the cache manifest references.

However, a safer approach for high-churn environments is to use a dedicated ECR repository for cache (e.g., my-app-cache) separate from your production images. This allows you to apply aggressive lifecycle policies to the cache repo (e.g., “expire artifacts older than 7 days”) without risking your production releases.

Frequently Asked Questions (FAQ)

1. Is ECR Remote Cache faster than S3-backed caching?

Generally, yes. While S3 is highly performant, using type=registry with ECR leverages the optimized Docker registry protocol. It avoids the overhead of the S3 API translation layer and benefits from ECR’s massive concurrent transfer limits within the AWS network.

2. Does this support multi-architecture builds?

Absolutely. This is one of the strongest arguments for using the ECR Remote Build Cache. BuildKit can store cache layers for both amd64 and arm64 in the same registry reference (manifest list), allowing a runner on one architecture to potentially benefit from architecture-independent layer caching (like copying source code) generated by another.

3. Why am I seeing “blob unknown” errors?

This usually happens if an aggressive ECR Lifecycle Policy deletes the underlying blobs referenced by your cache manifest. Ensure your lifecycle policies account for the active duration of your development sprints.

Conclusion

The ECR Remote Build Cache represents a maturation of cloud-native CI/CD. It moves us away from hacked-together solutions involving tarballs and S3 buckets toward a standardized, OCI-compliant method that integrates natively with the Docker toolchain.

By implementing the type=registry cache backend with mode=max, you aren’t just saving minutes on build times; you are reducing compute costs and accelerating the feedback loop for your entire engineering organization. For expert AWS teams, this is no longer an optional optimization—it is the standard. Thank you for reading the DevopsRoles page!

Top 10 MCP Servers for DevOps: Boost Your Efficiency in 2026

The era of copy-pasting logs into ChatGPT is over. With the widespread adoption of the Model Context Protocol (MCP), AI agents no longer just chat about your infrastructure—they can interact with it. For DevOps engineers, SREs, and Platform teams, this is the paradigm shift we’ve been waiting for.

MCP Servers for DevOps allow your local LLM environment (like Claude Desktop, Cursor, or specialized IDEs) to securely connect to your Kubernetes clusters, production databases, cloud providers, and observability stacks. Instead of asking “How do I query a crashing pod?”, you can now ask your agent to “Check the logs of the crashing pod in namespace prod and summarize the stack trace.”

This guide cuts through the noise of the hundreds of community servers to give you the definitive, production-ready top 10 list for 2026, complete with configuration snippets and security best practices.

What is the Model Context Protocol (MCP)?

Before we dive into the tools, let’s briefly level-set. MCP is an open standard that standardizes how AI models interact with external data and tools. It follows a client-host-server architecture:

  • Host: The application you interact with (e.g., Claude Desktop, Cursor, VS Code).
  • Server: A lightweight process that exposes specific capabilities (tools, resources, prompts) via JSON-RPC.
  • Client: The bridge connecting the Host to the Server.

Pro-Tip for Experts: Most MCP servers run locally via stdio transport, meaning the data never leaves your machine unless the server specifically calls an external API (like AWS or GitHub). This makes MCP significantly more secure than web-based “Plugin” ecosystems.

The Top 10 MCP Servers for DevOps

1. Kubernetes (The Cluster Commander)

The Kubernetes MCP server is arguably the most powerful tool in a DevOps engineer’s arsenal. It enables your AI to run kubectl-like commands to inspect resources, view events, and debug failures.

  • Key Capabilities: List pods, fetch logs, describe deployments, check events, and inspect YAML configurations.
  • Why it matters: Instant context. You can say “Why is the payment-service crashing?” and the agent can inspect the events and logs immediately without you typing a single command.
{
  "kubernetes": {
    "command": "npx",
    "args": ["-y", "@modelcontextprotocol/server-kubernetes"]
  }
}

2. PostgreSQL (The Data Inspector)

Direct database access allows your AI to understand your schema and data relationships. This is invaluable for debugging application errors that stem from data inconsistencies or bad migrations.

  • Key Capabilities: Inspect table schemas, run read-only SQL queries, analyze indexes.
  • Security Warning: Always configure this with a READ-ONLY database user. Never give an LLM DROP TABLE privileges.

3. AWS (The Cloud Controller)

The official AWS MCP server unifies access to your cloud resources. It respects your local ~/.aws/credentials, effectively allowing the agent to act as you.

  • Key Capabilities: List EC2 instances, read S3 buckets, check CloudWatch logs, inspect Security Groups.
  • Use Case: “List all EC2 instances in us-east-1 that are stopped and estimate the cost savings.”

4. GitHub (The Code Context)

While many IDEs have Git integration, the GitHub MCP server goes deeper. It allows the agent to search issues, read PR comments, and inspect file history across repositories, not just the one you have open.

  • Key Capabilities: Search repositories, read file contents, manage issues/PRs, inspect commit history.

5. Filesystem (The Local Anchor)

Often overlooked, the Filesystem MCP server is foundational. It allows the agent to read your local config files, Terraform state (be careful!), and local logs that aren’t in the cloud yet.

  • Best Practice: explicitly allow-list only specific directories (e.g., /Users/me/projects) rather than your entire home folder.

6. Docker (The Container Whisperer)

Debug local containers faster. The Docker MCP server lets your agent interact with the Docker daemon to check container health, inspect images, and view runtime stats.

  • Key Capabilities: docker ps, docker logs, docker inspect via natural language.

7. Prometheus (The Metrics Watcher)

Context is nothing without metrics. The Prometheus MCP server connects your agent to your time-series data.

  • Use Case: “Analyze the CPU usage of the api-gateway over the last hour and tell me if it correlates with the error spikes.”
  • Value: Eliminates the need to write complex PromQL queries manually for quick checks.

8. Sentry (The Error Hunter)

When an alert fires, you need details. Connecting Sentry allows the agent to retrieve stack traces, user impact data, and release health info directly.

  • Key Capabilities: Search issues, retrieve latest event details, list project stats.

9. Brave Search (The External Brain)

DevOps requires constant documentation lookups. The Brave Search MCP server gives your agent internet access to find the latest error codes, deprecation notices, or Terraform module documentation without hallucinating.

  • Why Brave? It offers a clean API for search results that is often more “bot-friendly” than standard scrapers.

10. Cloudflare (The Edge Manager)

For modern stacks relying on edge compute, the Cloudflare MCP server is essential. Manage Workers, KV namespaces, and DNS records.

  • Key Capabilities: List workers, inspect KV keys, check deployment status.

Implementation: The claude_desktop_config.json

To get started, you need to configure your Host application. For Claude Desktop on macOS, this file is located at ~/Library/Application Support/Claude/claude_desktop_config.json.

Here is a production-ready template integrating a few of the top servers. Note the use of environment variables for security.

{
  "mcpServers": {
    "kubernetes": {
      "command": "npx",
      "args": ["-y", "@modelcontextprotocol/server-kubernetes"]
    },
    "postgres": {
      "command": "npx",
      "args": ["-y", "@modelcontextprotocol/server-postgres", "postgresql://readonly_user:securepassword@localhost:5432/mydb"]
    },
    "github": {
      "command": "npx",
      "args": ["-y", "@modelcontextprotocol/server-github"],
      "env": {
        "GITHUB_PERSONAL_ACCESS_TOKEN": "your-token-here"
      }
    },
    "filesystem": {
      "command": "npx",
      "args": ["-y", "@modelcontextprotocol/server-filesystem", "/Users/yourname/workspace"]
    }
  }
}

Note: You will need Node.js installed (`npm` and `npx`) for the examples above.

Security Best Practices for Expert DevOps

Opening your infrastructure to an AI agent requires rigorous security hygiene.

  1. Least Privilege (IAM/RBAC):
    • For AWS, create a specific IAM User for MCP with ReadOnlyAccess. Do not use your Admin keys.
    • For Kubernetes, create a ServiceAccount with a restricted Role (e.g., view only) and use that kubeconfig context.
  2. The “Human in the Loop” Rule:

    MCP allows tools to perform actions. While “reading” logs is safe, “writing” code or “deleting” resources should always require explicit user confirmation. Most Clients (like Claude Desktop) prompt you before executing a tool command—never disable this feature.


  3. Environment Variable Hygiene:

    Avoid hardcoding API keys in your claude_desktop_config.json if you share your dotfiles. Use a secrets manager or reference environment variables that are loaded into the shell session launching the host.


Frequently Asked Questions (FAQ)

Can I run MCP servers via Docker instead of npx?

Yes, and it’s often cleaner. You can replace the command in your config with docker and use run -i --rm ... args. This isolates the server environment from your local Node.js setup.

Is it safe to connect MCP to a production database?

Only if you use a read-only user. We strictly recommend connecting to a read-replica or a sanitized staging database rather than the primary production writer.

What is the difference between Stdio and SSE transport?

Stdio (Standard Input/Output) is used for local servers; the client spawns the process and communicates via pipes. SSE (Server-Sent Events) is used for remote servers (e.g., a server running inside your K8s cluster that your local client connects to over HTTP). Stdio is easier for local setup; SSE is better for shared team resources.

Conclusion

MCP Servers for DevOps are not just a shiny new toy—they are the bridge that turns Generative AI into a practical engineering assistant. By integrating Kubernetes, AWS, and Git directly into your LLM’s context, you reduce context switching and accelerate root cause analysis.

Start small: configure the Filesystem and Kubernetes servers today. Once you experience the speed of debugging a crashing pod using natural language, you won’t want to go back.Thank you for reading the DevopsRoles page!

Ready to deploy? Check out the Official MCP Servers Repository to find the latest configurations.

Master Amazon EKS Metrics: Automated Collection with AWS Prometheus

Observability at scale is the silent killer of Kubernetes operations. For expert platform engineers, the challenge isn’t just generating Amazon EKS metrics; it is ingesting, storing, and querying them without managing a fragile, self-hosted Prometheus stateful set that collapses under high cardinality.

In this guide, we bypass the basics. We will architect a production-grade observability pipeline using Amazon Managed Service for Prometheus (AMP) and the AWS Distro for OpenTelemetry (ADOT). We will cover Infrastructure as Code (Terraform) implementation, IAM Roles for Service Accounts (IRSA) security patterns, and advanced filtering techniques to keep your metric ingestion costs manageable.

The Scaling Problem: Why Self-Hosted Prometheus Fails EKS

Standard Prometheus deployments on EKS work flawlessly for development clusters. However, as you scale to hundreds of nodes and thousands of pods, the “pull-based” model combined with local TSDB storage hits a ceiling.

  • Vertical Scaling Limits: A single Prometheus server eventually runs out of memory (OOM) attempting to ingest millions of active series.
  • Data Persistence: Managing EBS volumes for long-term metric retention is operational toil.
  • High Availability: Running HA Prometheus pairs doubles your cost and introduces “gap” complexities during failovers.

Pro-Tip: The solution is to decouple collection from storage. By using stateless collectors (ADOT) to scrape Amazon EKS metrics and remote-writing them to a managed backend (AMP), you offload the heavy lifting of storage, availability, and backups to AWS.

Architecture: EKS, ADOT, and AMP

The modern AWS-native observability stack consists of three distinct layers:

  1. Generation: Your application pods and Kubernetes node exporters.
  2. Collection (The Agent): The AWS Distro for OpenTelemetry (ADOT) collector running as a DaemonSet or Deployment. It scrapes Prometheus endpoints and remote-writes data.
  3. Storage (The Backend): Amazon Managed Service for Prometheus (AMP), which is Cortex-based, scalable, and fully compatible with PromQL.

Step-by-Step Implementation

We will use Terraform for the infrastructure foundation and Helm for the Kubernetes components.

1. Provisioning the AMP Workspace

First, we create the AMP workspace. This is the distinct logical space where your metrics will reside.

resource "aws_prometheus_workspace" "eks_observability" {
  alias = "production-eks-metrics"

  tags = {
    Environment = "Production"
    ManagedBy   = "Terraform"
  }
}

output "amp_workspace_id" {
  value = aws_prometheus_workspace.eks_observability.id
}

output "amp_remote_write_url" {
  value = "${aws_prometheus_workspace.eks_observability.prometheus_endpoint}api/v1/remote_write"
}

2. Security: IRSA for Metric Ingestion

The ADOT collector needs permission to write to AMP. We utilize IAM Roles for Service Accounts (IRSA) to grant least-privilege access, avoiding static access keys.

Create an IAM policy AWSManagedPrometheusWriteAccess (or a scoped inline policy) and attach it to a role trusted by your EKS OIDC provider.

data "aws_iam_policy_document" "amp_ingest_policy" {
  statement {
    actions = [
      "aps:RemoteWrite",
      "aps:GetSeries",
      "aps:GetLabels",
      "aps:GetMetricMetadata"
    ]
    resources = [aws_prometheus_workspace.eks_observability.arn]
  }
}

resource "aws_iam_role" "adot_collector" {
  name = "eks-adot-collector-role"

  assume_role_policy = jsonencode({
    Version = "2012-10-17"
    Statement = [{
      Action = "sts:AssumeRoleWithWebIdentity"
      Effect = "Allow"
      Principal = {
        Federated = "arn:aws:iam::${var.account_id}:oidc-provider/${var.oidc_provider}"
      }
      Condition = {
        StringEquals = {
          "${var.oidc_provider}:sub" = "system:serviceaccount:adot-system:adot-collector"
        }
      }
    }]
  })
}

3. Deploying the ADOT Collector

We deploy the ADOT collector using the EKS add-on or Helm. For granular control over the scraping configuration, the Helm chart is often preferred by power users.

Below is a snippet of the values.yaml configuration required to enable the Prometheus receiver and configure the remote write exporter to send Amazon EKS metrics to your workspace.

# ADOT Helm values.yaml
mode: deployment
serviceAccount:
  create: true
  name: adot-collector
  annotations:
    eks.amazonaws.com/role-arn: "arn:aws:iam::123456789012:role/eks-adot-collector-role"

config:
  receivers:
    prometheus:
      config:
        global:
          scrape_interval: 15s
        scrape_configs:
          - job_name: 'kubernetes-pods'
            kubernetes_sd_configs:
              - role: pod
            relabel_configs:
              - source_labels: [__meta_kubernetes_pod_annotation_prometheus_io_scrape]
                action: keep
                regex: true

  exporters:
    prometheusremotewrite:
      endpoint: "https://aps-workspaces.us-east-1.amazonaws.com/workspaces/ws-xxxx/api/v1/remote_write"
      auth:
        authenticator: sigv4auth

  extensions:
    sigv4auth:
      region: "us-east-1"
      service: "aps"

  service:
    extensions: [sigv4auth]
    pipelines:
      metrics:
        receivers: [prometheus]
        exporters: [prometheusremotewrite]

Optimizing Costs: Managing High Cardinality

Amazon EKS metrics can generate massive bills if you ingest every label from every ephemeral pod. AMP charges based on ingestion (samples) and storage.

Filtering at the Collector Level

Use the processors block in your ADOT configuration to drop unnecessary metrics or labels before they leave the cluster.

processors:
  filter:
    metrics:
      exclude:
        match_type: strict
        metric_names:
          - kubelet_volume_stats_available_bytes
          - kubelet_volume_stats_capacity_bytes
          - container_fs_usage_bytes # Often high noise, low value
  resource:
    attributes:
      - key: jenkins_build_id
        action: delete  # Remove high-cardinality labels

Advanced Concept: Avoid including high-cardinality labels such as client_ip, user_id, or unique request_id in your metric dimensions. These explode the series count and degrade query performance in PromQL.

Visualizing with Amazon Managed Grafana

Once data is flowing into AMP, visualization is standard.

  1. Deploy Amazon Managed Grafana (AMG).
  2. Add the “Prometheus” data source.
  3. Toggle “SigV4 SDK” authentication in the data source settings (this seamlessly uses the AMG workspace IAM role to query AMP).
  4. Select your AMP region and workspace.

Because AMP is 100% PromQL compatible, you can import standard community dashboards (like the Kubernetes Cluster Monitoring dashboard) and they will work immediately.

Frequently Asked Questions (FAQ)

Does AMP support Prometheus Alert Manager?

Yes. AMP supports a serverless Alert Manager. You upload your alerting rules (YAML) and routing configuration directly to the AMP workspace via the AWS CLI or Terraform. You do not need to run a separate Alert Manager pod in your cluster.

What is the difference between ADOT and the standard Prometheus Server?

The standard Prometheus server is a monolithic binary that scrapes, stores, and serves data. ADOT (based on the OpenTelemetry Collector) is a pipeline that receives data, processes it, and exports it. ADOT is stateless and easier to scale horizontally, making it ideal for shipping Amazon EKS metrics to a managed backend.

How do I monitor the control plane (API Server, etcd)?

EKS Control Plane metrics are not exposed via standard scraping endpoints inside your VPC because the control plane is managed by AWS. However, you can enable “Control Plane Logging” in EKS to send metrics to CloudWatch, or use specific PromQL exporters if AWS exposes the metrics endpoint (varies by EKS version and configuration).

Conclusion

Migrating to Amazon Managed Service for Prometheus allows expert teams to treat observability as a service rather than a server. By leveraging ADOT for collection and IRSA for security, you build a robust, scalable pipeline for your Amazon EKS metrics.

Your next step is to audit your current metric cardinality using the ADOT processor configuration to ensure you aren’t paying for noise. Focus on the golden signals—Latency, Traffic, Errors, and Saturation—and let AWS manage the infrastructure. Thank you for reading the DevopsRoles page!

Linux Kernel Security: Mastering Essential Workflows & Best Practices

In the realm of high-performance infrastructure, the kernel is not just the engine; it is the ultimate arbiter of access. For expert Systems Engineers and SREs, Linux Kernel Security moves beyond simple package updates and firewall rules. It requires a comprehensive strategy involving surface reduction, advanced access controls, and runtime observability.

As containerization and microservices expose the kernel to new attack vectors—specifically container escapes and privilege escalation—relying solely on perimeter defense is insufficient. This guide dissects the architectural layers of kernel hardening, providing production-ready workflows for LSMs, Seccomp, and eBPF-based security to help you establish a robust defense-in-depth posture.

1. The Defense-in-Depth Model: Beyond Discretionary Access

Standard Linux permissions (Discretionary Access Control, or DAC) are the first line of defense but are notoriously prone to user error and privilege escalation. To secure a production kernel, we must enforce Mandatory Access Control (MAC).

Leveraging Linux Security Modules (LSMs)

Whether you utilize SELinux (Red Hat ecosystem) or AppArmor (Debian/Ubuntu ecosystem), the goal is identical: confine processes to the minimum necessary privileges.

Pro-Tip: SELinux in CI/CD
Experts often disable SELinux (`setenforce 0`) when facing friction. Instead, use audit2allow during your staging pipeline to generate permissive modules automatically, ensuring production remains in `Enforcing` mode without breaking applications.

To analyze a denial and generate a custom policy module:

# 1. Search for denials in the audit log
grep "denied" /var/log/audit/audit.log

# 2. Pipe the denial into audit2allow to see why it failed
grep "httpd" /var/log/audit/audit.log | audit2allow -w

# 3. Generate a loadable kernel module (.pp)
grep "httpd" /var/log/audit/audit.log | audit2allow -M my_httpd_policy

# 4. Load the module
semodule -i my_httpd_policy.pp

2. Reducing the Attack Surface via Sysctl Hardening

The default upstream kernel configuration prioritizes compatibility over security. For a hardened environment, specific sysctl parameters must be tuned to restrict memory access and network stack behavior.

Below is a production-grade /etc/sysctl.d/99-security.conf snippet targeting memory protection and network hardening.

# --- Kernel Self-Protection ---

# Restrict access to kernel pointers in /proc/kallsyms
# 0=disabled, 1=hide from unprivileged, 2=hide from all
kernel.kptr_restrict = 2

# Restrict access to the kernel log buffer (dmesg)
# Prevents attackers from reading kernel addresses from logs
kernel.dmesg_restrict = 1

# Restrict use of the eBPF subsystem to privileged users (CAP_BPF/CAP_SYS_ADMIN)
# Essential for preventing unprivileged eBPF exploits
kernel.unprivileged_bpf_disabled = 1

# Turn on BPF JIT hardening (blinding constants)
net.core.bpf_jit_harden = 2

# --- Network Stack Hardening ---

# Enable IP spoofing protection (Reverse Path Filtering)
net.ipv4.conf.all.rp_filter = 1
net.ipv4.conf.default.rp_filter = 1

# Disable ICMP Redirect Acceptance (prevents Man-in-the-Middle routing attacks)
net.ipv4.conf.all.accept_redirects = 0
net.ipv4.conf.default.accept_redirects = 0
net.ipv6.conf.all.accept_redirects = 0

Apply these changes dynamically with sysctl -p /etc/sysctl.d/99-security.conf. Refer to the official kernel sysctl documentation for granular details on specific parameters.

3. Syscall Filtering with Seccomp BPF

Secure Computing Mode (Seccomp) is critical for reducing the kernel’s exposure to userspace. By default, a process can make any system call. Seccomp acts as a firewall for syscalls.

In modern container orchestrators like Kubernetes, Seccomp profiles are defined in JSON. However, understanding how to profile an application is key.

Profiling Applications

You can use tools like strace to identify exactly which syscalls an application needs, then blacklist everything else.

# Trace the application and count syscalls
strace -c -f ./my-application

A basic whitelist profile (JSON) for a container runtime might look like this:

{
    "defaultAction": "SCMP_ACT_ERRNO",
    "architectures": [
        "SCMP_ARCH_X86_64"
    ],
    "syscalls": [
        {
            "names": [
                "read", "write", "exit", "exit_group", "futex", "mmap", "nanosleep"
            ],
            "action": "SCMP_ACT_ALLOW"
        }
    ]
}

Advanced Concept: Seccomp allows filtering based on syscall arguments, not just the syscall ID. This allows for extremely granular control, such as allowing `socket` calls but only for specific families (e.g., AF_UNIX).

4. Kernel Module Signing and Lockdown

Rootkits often persist by loading malicious kernel modules. To prevent this, enforce Module Signing. This ensures the kernel only loads modules signed by a trusted key (usually the distribution vendor or your own secure boot key).

Enforcing Lockdown Mode

The Linux Kernel Lockdown feature (available in 5.4+) draws a line between the root user and the kernel itself. Even if an attacker gains root, Lockdown prevents them from modifying kernel memory or injecting code.

Enable it via boot parameters or securityfs:

# Check current status
cat /sys/kernel/security/lockdown

# Enable integrity mode (prevents modifying running kernel)
# Usually set via GRUB: lockdown=integrity or lockdown=confidentiality

5. Runtime Observability & Security with eBPF

Traditional security tools rely on parsing logs or checking file integrity. Modern Linux Kernel Security leverages eBPF (Extended Berkeley Packet Filter) to observe kernel events in real-time with minimal overhead.

Tools like Tetragon or Falco attach eBPF probes to syscalls (e.g., `execve`, `connect`, `open`) to detect anomalous behavior.

Example: Detecting Shell Execution in Containers

Instead of scanning for signatures, eBPF can trigger an alert the moment a sensitive binary is executed inside a specific namespace.

# A conceptual Falco rule for detecting shell access
- rule: Terminal Shell in Container
  desc: A shell was used as the entrypoint for the container executable
  condition: >
    spawned_process and container
    and shell_procs
  output: >
    Shell executed in container (user=%user.name container_id=%container.id image=%container.image.repository)
  priority: WARNING

Frequently Asked Questions (FAQ)

Does enabling Seccomp cause performance degradation?

Generally, the overhead is negligible for most workloads. The BPF filters used by Seccomp are JIT-compiled and extremely fast. However, for syscall-heavy applications (like high-frequency trading platforms), benchmarking is recommended.

What is the difference between Kernel Lockdown “Integrity” and “Confidentiality”?

Integrity prevents userland from modifying the running kernel (e.g., writing to `/dev/mem` or loading unsigned modules). Confidentiality goes a step further by preventing userland from reading sensitive kernel information that could reveal cryptographic keys or layout randomization.

How do I handle kernel vulnerabilities (CVEs) without rebooting?

For mission-critical systems where downtime is unacceptable, use Kernel Live Patching technologies like kpatch (Red Hat) or Livepatch (Canonical). These tools inject functional replacements for vulnerable code paths into the running kernel memory.

Conclusion

Mastering Linux Kernel Security is not a checklist item; it is a continuous process of reducing trust and increasing observability. By implementing a layered defense—starting with strict LSM policies, minimizing the attack surface via sysctl, enforcing Seccomp filters, and utilizing modern eBPF observability—you transform the kernel from a passive target into an active guardian of your infrastructure.

Start by auditing your current sysctl configurations and moving your container workloads to a default-deny Seccomp profile. The security of the entire stack rests on the integrity of the kernel. Thank you for reading the DevopsRoles page!