The Kubernetes vs Serverless debate is tearing engineering teams apart right now.
I’ve spent 30 years in the trenches of software architecture. I’ve seen it all.
Mainframes. Client-server. Virtual machines. And now, the ultimate cloud-native showdown.
Founders and CTOs constantly ask me which path they should take.
They think it is just a technical choice. They are dead wrong.
It is a massive strategic decision that impacts your burn rate, hiring, and time-to-market.
Let’s strip away the marketing hype and look at the brutal reality.

The Core Philosophy: Kubernetes vs Serverless
To understand the Kubernetes vs Serverless battle, you have to understand the mindset behind each.
They solve the same fundamental problem: getting your code to run on the internet.
But they do it in completely opposite ways.
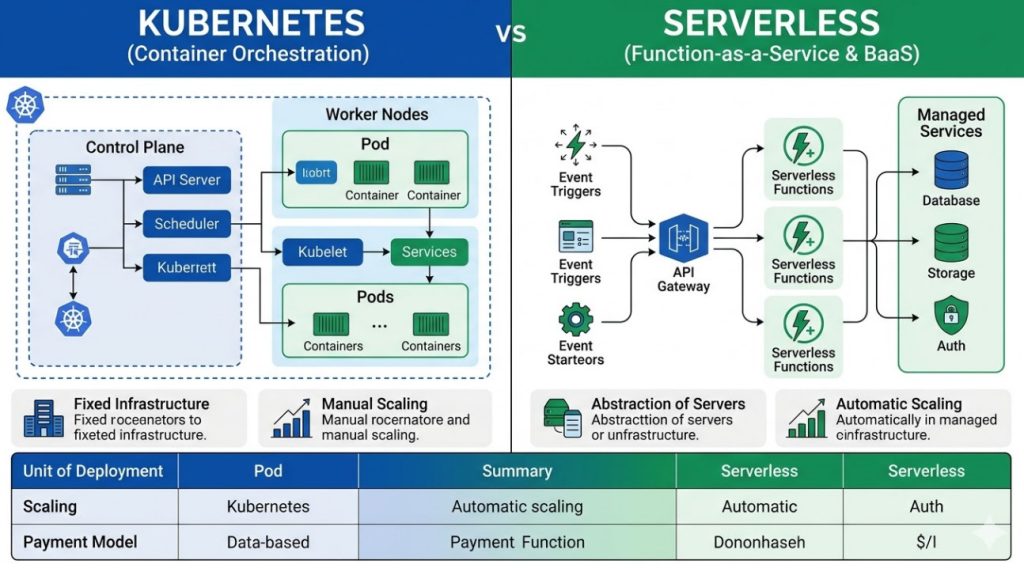
What exactly is Kubernetes?
Kubernetes (K8s) is an open-source container orchestration system.
Think of it as the operating system for your cloud.
You pack your application into a shipping container.
Kubernetes then decides which server that container runs on. It handles the logistics.
But here is the catch. You own the fleet of servers.
- You manage the underlying infrastructure.
- You handle the security patching of the nodes.
- You pay for the servers whether they are busy or idle.
For a deep dive into the technical specs, check out the official Kubernetes Documentation.
What exactly is Serverless?
Serverless computing completely abstracts the infrastructure away from you.
You write a function. You upload it to the cloud provider.
You never see a server. You never patch an operating system.
The provider handles absolutely everything behind the scenes.
And the best part? You only pay for the exact milliseconds your code executes.
- Zero idle costs.
- Instant, infinite scaling out of the box.
- Drastically reduced operational overhead.
Want to see how the industry reports on this shift? Read the strategic breakdown at Techgenyz.
Kubernetes vs Serverless: The 5 Strategic Differences
Now, let’s get into the weeds. This is where companies make million-dollar mistakes.
When evaluating Kubernetes vs Serverless, you must look beyond the code.
You have to look at the business impact.
1. Control vs. Convenience
This is the biggest dividing line.
Kubernetes gives you god-like control over your environment.
Need a specific kernel version? Done. Need custom networking rules? Easy.
But that control comes with a steep price tag: complexity.
You need a team of highly paid DevOps engineers just to keep the lights on.
Serverless is the exact opposite. It is pure convenience.
You give up control over the environment to gain developer speed.
Your engineers focus 100% on writing business logic, not managing YAML files.
If you want to read more about organizing your teams for this, check our [Internal Link: Microservices Architecture Guide].
2. The Reality of Vendor Lock-in
Everyone talks about vendor lock-in. Very few understand it.
In the Kubernetes vs Serverless debate, lock-in is a primary concern.
Kubernetes is highly portable. A standard K8s cluster runs exactly the same on AWS, GCP, or bare metal.
You can pick up your toys and move to a different cloud provider over the weekend.
Serverless, however, ties you down heavily.
If you build your entire app on AWS Lambda, DynamoDB, and API Gateway…
You are married to AWS. Moving to Azure will require a massive rewrite.
You have to ask yourself: how likely are you actually to switch cloud providers?
3. Financial Models and Billing
Let’s talk about money. This is where CFOs get involved.
Kubernetes requires baseline provisioning. You pay for the capacity you allocate.
If your cluster is running at 10% utilization at 3 AM, you are still paying for 100% of those servers.
It is predictable, but it is often wasteful.
Serverless is purely pay-per-use.
If no one visits your site at 3 AM, your compute bill is exactly $0.00.
But beware. At a massive, sustained scale, Serverless can actually become more expensive per transaction than a heavily optimized Kubernetes cluster.
4. The Cold Start Problem
You cannot discuss Kubernetes vs Serverless without mentioning cold starts.
When a Serverless function hasn’t been called in a while, the cloud provider spins it down.
The next time someone triggers it, the provider has to boot up a fresh container.
This can add hundreds of milliseconds (or even seconds) of latency to that request.
If you are building a high-frequency trading app, Serverless is absolutely the wrong choice.
Kubernetes pods are always running. Latency is consistently low.
5. Team Skillsets and Hiring
Do not underestimate the human element.
Hiring good Kubernetes talent is incredibly hard. And they are expensive.
The learning curve for K8s is notoriously brutal.
Serverless, on the other hand, democratizes deployment.
A junior JavaScript developer can deploy a globally scalable API on day one.
You don’t need a dedicated infrastructure team to launch a Serverless product.
Code Example: Deploying in Both Worlds
Let’s look at what the actual deployment files look like.
First, here is a standard Kubernetes Deployment YAML.
Notice how much infrastructure we have to declare.
apiVersion: apps/v1
kind: Deployment
metadata:
  name: my-app-deployment
spec:
  replicas: 3
  selector:
    matchLabels:
      app: my-app
  template:
    metadata:
      labels:
        app: my-app
    spec:
      containers:
      - name: my-app-container
        image: myrepo/myapp:v1.0
        ports:
        - containerPort: 8080
        resources:
          requests:
            memory: "64Mi"
            cpu: "250m"
          limits:
            memory: "128Mi"
            cpu: "500m"
Now, let’s look at the equivalent for a Serverless architecture.
Using the Serverless Framework, the deployment is vastly simpler.
We only define the function and the trigger.
service: my-serverless-app

provider:
  name: aws
  runtime: nodejs18.x
  region: us-east-1

functions:
  helloWorld:
    handler: handler.hello
    events:
      - http:
          path: hello
          method: get
The difference in cognitive load is staggering, isn’t it?
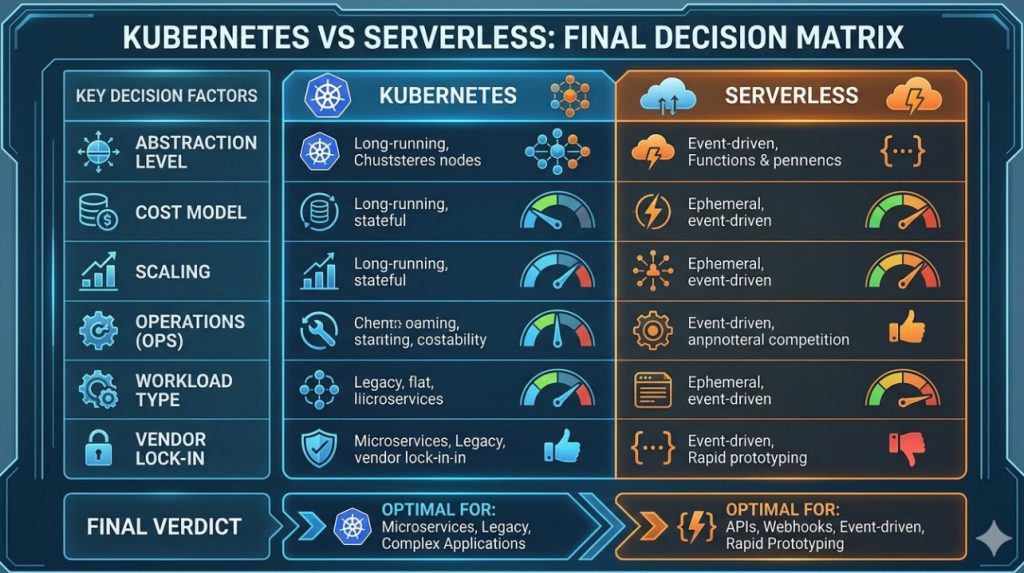
Kubernetes vs Serverless: When to Choose Which?
I hate it when consultants say “it depends.”
So, I will give you concrete, actionable rules.
You Must Choose Kubernetes If:
- You have highly predictable, sustained, high-volume traffic.
- You need extreme control over network latency and security perimeters.
- You are migrating legacy applications that require background processes.
- Your legal or compliance requirements forbid multi-tenant public cloud services.
- You absolutely must avoid vendor lock-in at all costs.
You Must Choose Serverless If:
- You are an early-stage startup racing to find product-market fit.
- Your traffic is highly unpredictable and spiky.
- You want to run a lean engineering team with zero dedicated DevOps headcount.
- Your application is primarily event-driven (e.g., reacting to file uploads or queue messages).
- You want to optimize for developer velocity above all else.
For a detailed breakdown of serverless use cases, check the AWS Serverless Hub.

FAQ Section
Can I use both Kubernetes and Serverless together?
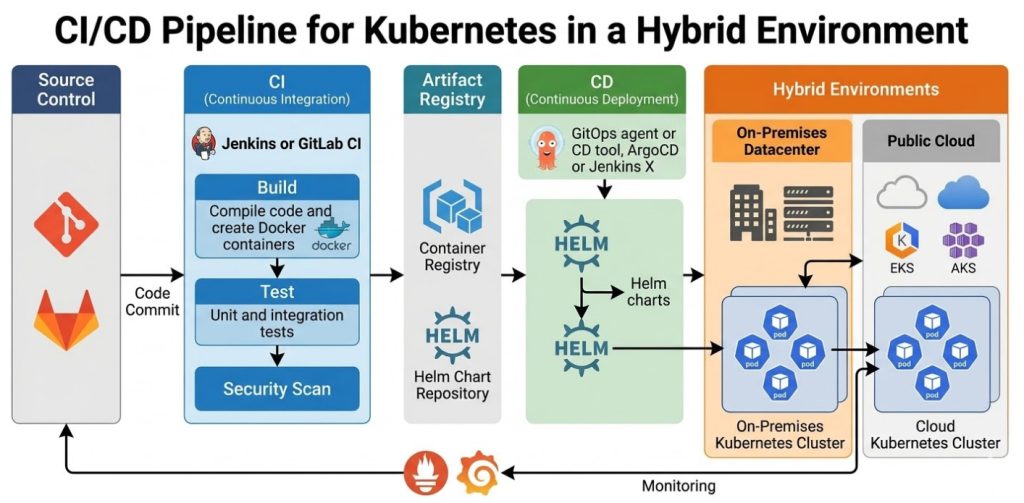
Yes. This is called a hybrid approach. Many enterprises run their core, steady-state APIs on K8s.
Then, they use Serverless functions for asynchronous, event-driven background tasks.
It is not an either/or situation if you have the engineering maturity to handle both.
Is Serverless actually cheaper than Kubernetes?
At a small to medium scale, absolutely yes. The zero-idle cost saves startups thousands.
However, at enterprise scale with millions of requests per minute, Serverless compute can cost significantly more.
You have to model your specific traffic patterns to know for sure.
Does Kubernetes have a Serverless option?
Yes, tools like Knative allow you to run serverless workloads on top of your Kubernetes cluster.
You get the scale-to-zero benefits of serverless, but you still have to manage the underlying K8s infrastructure.
It is a middle ground for teams that already have K8s expertise.
Conclusion: The Kubernetes vs Serverless debate shouldn’t be a religious war.
It is a pragmatic business choice.
If you value control, portability, and have the budget for a DevOps team, go with Kubernetes.
If you value speed, agility, and want to pay exactly for what you use, go Serverless.
Stop arguing on Reddit, pick the architecture that fits your business model, and get back to shipping features. Thank you for reading the DevopsRoles page!