Table of Contents
Introduction
In this tutorial, how to run Grafana version 8 using Docker-compose. Now, we will use Docker compose run Grafana version 8.
Docker compose run Grafana
Grafana Docker container
I will create a folder for Grafana on the Host Ubuntu OS.
sudo mkdir -p /home/huupv/docker/grafana/data
sudo mkdir -p /home/huupv/docker/compose-files/Grafana
cd /home/huupv/docker/compose-files/Grafana
Create a new docker-compose.yml file with the following
version: "3.5"

services:
  grafana8:
    image: grafana/grafana:latest
    network_mode: "bridge"
    container_name: grafana8
	# user: "1000" # needs to be `id -u` // alternatively chown the grafana/data dir to 472:472
    volumes:
      - /home/huupv/docker/grafana/data:/var/lib/grafana
    ports:
      - "3000:3000"
    restart: always
The change port if you want.
The deploy Grafana
sudo docker-compose up -d
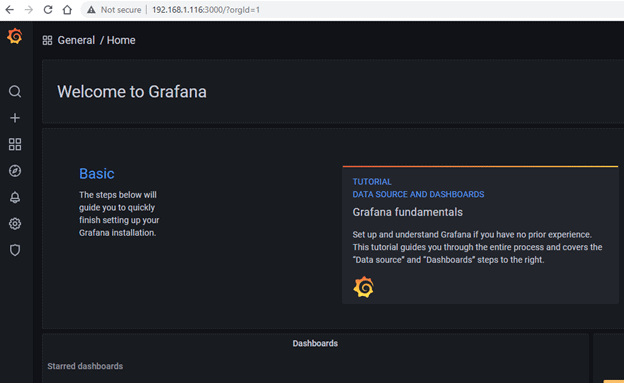
Your open browser the following URL: http://yourIP:3000
To log in for the first time, use the admin:admin username and password combination.
Login the success

The during start Grafana error [fixed it]
Code Error Grafana
huupv@ubuntu:~/docker/compose-files/grafana$ sudo docker ps
CONTAINER ID   IMAGE                    COMMAND                  CREATED          STATUS                         PORTS                                                                                        NAMES
4e1f6f81da09   grafana/grafana:latest   "/run.sh"                27 seconds ago   Restarting (1) 3 seconds ago                                                                                                grafana8
304a31a535c5   telegraf:latest          "/entrypoint.sh tele…"   3 hours ago      Up 2 hours                     0.0.0.0:8092->8092/tcp, 8092/udp, 0.0.0.0:8094->8094/tcp, 8125/udp, 0.0.0.0:8125->8125/tcp   telegraf
5909e05dd5bd   influxdb:latest          "/entrypoint.sh infl…"   3 hours ago      Up 2 hours                     0.0.0.0:8086->8086/tcp                                                                       influxdb2
huupv@ubuntu:~/docker/compose-files/grafana$ sudo docker logs grafana8
GF_PATHS_DATA='/var/lib/grafana' is not writable.
You may have issues with file permissions, more information here: http://docs.grafana.org/installation/docker/#migrate-to-v51-or-later
mkdir: can't create directory '/var/lib/grafana/plugins': Permission denied
GF_PATHS_DATA='/var/lib/grafana' is not writable.
You may have issues with file permissions, more information here: http://docs.grafana.org/installation/docker/#migrate-to-v51-or-later
mkdir: can't create directory '/var/lib/grafana/plugins': Permission denied
GF_PATHS_DATA='/var/lib/grafana' is not writable.
You may have issues with file permissions, more information here: http://docs.grafana.org/installation/docker/#migrate-to-v51-or-later
mkdir: can't create directory '/var/lib/grafana/plugins': Permission denied
GF_PATHS_DATA='/var/lib/grafana' is not writable.
You may have issues with file permissions, more information here: http://docs.grafana.org/installation/docker/#migrate-to-v51-or-later
mkdir: can't create directory '/var/lib/grafana/plugins': Permission denied
GF_PATHS_DATA='/var/lib/grafana' is not writable.
You may have issues with file permissions, more information here: http://docs.grafana.org/installation/docker/#migrate-to-v51-or-later
mkdir: can't create directory '/var/lib/grafana/plugins': Permission denied
GF_PATHS_DATA='/var/lib/grafana' is not writable.
You may have issues with file permissions, more information here: http://docs.grafana.org/installation/docker/#migrate-to-v51-or-later
mkdir: can't create directory '/var/lib/grafana/plugins': Permission denied
GF_PATHS_DATA='/var/lib/grafana' is not writable.
You may have issues with file permissions, more information here: http://docs.grafana.org/installation/docker/#migrate-to-v51-or-later
mkdir: can't create directory '/var/lib/grafana/plugins': Permission denied
GF_PATHS_DATA='/var/lib/grafana' is not writable.
You may have issues with file permissions, more information here: http://docs.grafana.org/installation/docker/#migrate-to-v51-or-later
mkdir: can't create directory '/var/lib/grafana/plugins': Permission denied
GF_PATHS_DATA='/var/lib/grafana' is not writable.
You may have issues with file permissions, more information here: http://docs.grafana.org/installation/docker/#migrate-to-v51-or-later
mkdir: can't create directory '/var/lib/grafana/plugins': Permission denied
Fixed it
huupv@ubuntu:~/docker/compose-files/grafana$ id -u
1001

# user: "1000" # needs to be `id -u` // alternatively chown the grafana/data dir to 472:472


huupv@ubuntu:~/docker/compose-files/grafana$ sudo chown 472:472 /home/huupv/docker/grafana/data
Result, Docker compose run Grafana 8.
huupv@ubuntu:~/docker/compose-files/grafana$ sudo docker ps
CONTAINER ID   IMAGE                    COMMAND                  CREATED         STATUS                          PORTS                                                                                        NAMES
4e1f6f81da09   grafana/grafana:latest   "/run.sh"                5 minutes ago   Restarting (1) 50 seconds ago                                                                                                grafana8
304a31a535c5   telegraf:latest          "/entrypoint.sh tele…"   3 hours ago     Up 2 hours                      0.0.0.0:8092->8092/tcp, 8092/udp, 0.0.0.0:8094->8094/tcp, 8125/udp, 0.0.0.0:8125->8125/tcp   telegraf
5909e05dd5bd   influxdb:latest          "/entrypoint.sh infl…"   3 hours ago     Up 2 hours                      0.0.0.0:8086->8086/tcp                                                                       influxdb2
huupv@ubuntu:~/docker/compose-files/grafana$ sudo docker restart grafana8
grafana8

huupv@ubuntu:~/docker/compose-files/grafana$ sudo chown 472:472 /home/huupv/docker/grafana/data
huupv@ubuntu:~/docker/compose-files/grafana$ ls -ld  /home/huupv/docker/grafana/data
drwxrwxr-x 2 472 472 4096 Aug  8 21:23 /home/huupv/docker/grafana/data

huupv@ubuntu:~$ sudo docker ps
CONTAINER ID   IMAGE                    COMMAND                  CREATED       STATUS       PORTS                                                                                        NAMES
c4d40e897c36   grafana/grafana:latest   "/run.sh"                2 hours ago   Up 2 hours   0.0.0.0:3000->3000/tcp                                                                       grafana8
304a31a535c5   telegraf:latest          "/entrypoint.sh tele…"   5 hours ago   Up 4 hours   0.0.0.0:8092->8092/tcp, 8092/udp, 0.0.0.0:8094->8094/tcp, 8125/udp, 0.0.0.0:8125->8125/tcp   telegraf
5909e05dd5bd   influxdb:latest          "/entrypoint.sh infl…"   5 hours ago   Up 4 hours   0.0.0.0:8086->8086/tcp                                                                       influxdb2
huupv@ubuntu:~$
Conclusion
Using Docker Compose, you’ve successfully launched Grafana 8. This tutorial aims to be a helpful resource for your monitoring setup. Thank you for choosing DevopsRoles for guidance. We appreciate your engagement and are here to support your continued learning in Docker and software deployment.