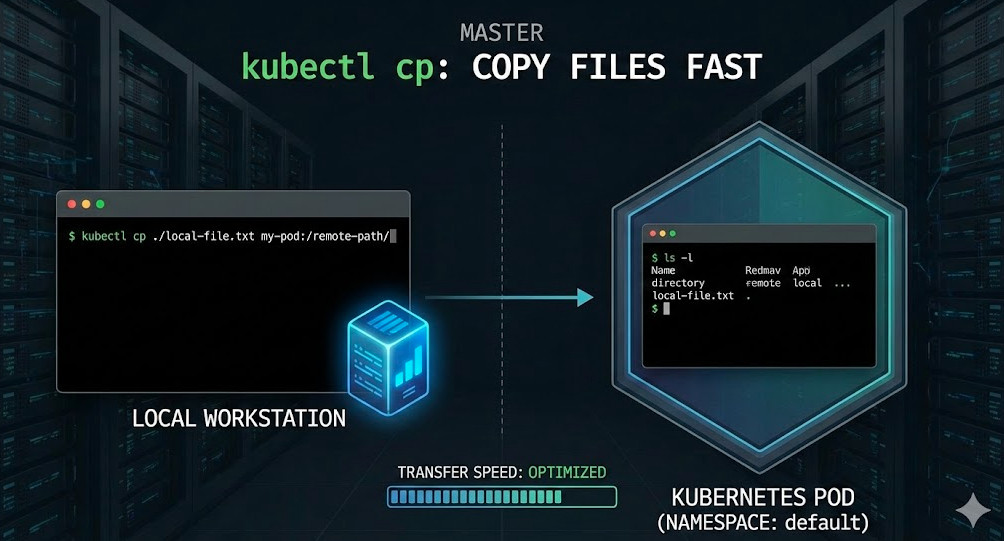
Category Archives: Kubernetes

Learn Kubernetes with DevOpsRoles.com. Access comprehensive guides and tutorials to orchestrate containerized applications and streamline your DevOps processes with Kubernetes.

OWASP Top 10 Kubernetes: Securing Your Kubernetes Environment

Introduction

Kubernetes has become the de facto standard for container orchestration, allowing developers and IT teams to efficiently deploy and manage applications in cloud-native environments. However, as Kubernetes environments grow in complexity, they also present new security challenges. The OWASP Top 10 Kubernetes is a framework designed to highlight the most common security vulnerabilities specific to Kubernetes deployments.

In this article, we’ll explore each of the OWASP Top 10 Kubernetes risks, discuss how they can impact your environment, and provide best practices for mitigating them. Whether you’re new to Kubernetes or an experienced professional, understanding these risks and how to address them will strengthen your security posture and protect your applications.

The OWASP Top 10 Kubernetes: A Brief Overview

The OWASP (Open Web Application Security Project) Top 10 is a widely recognized list that identifies the most critical security risks to web applications and cloud-native systems. For Kubernetes, the list has been adapted to highlight threats specific to containerized environments. These risks are categorized into common attack vectors, misconfigurations, and vulnerabilities that organizations should be aware of when working with Kubernetes.

The OWASP Top 10 Kubernetes is designed to guide teams in implementing robust security measures that protect the integrity, availability, and confidentiality of Kubernetes clusters and workloads.

The OWASP Top 10 Kubernetes Risks

Let’s dive into each of the OWASP Top 10 Kubernetes risks, with a focus on understanding the potential threats and actionable strategies to mitigate them.

1. Insecure Workload Configuration

Understanding the Risk

Workload configuration in Kubernetes refers to the settings and policies applied to applications running within containers. Misconfigured workloads can expose containers to attacks, allowing unauthorized users to access resources or escalate privileges.

Mitigation Strategies

  • Use Role-Based Access Control (RBAC): Limit access to resources by assigning roles and permissions based on the principle of least privilege.
  • Set Resource Limits: Define CPU and memory limits for containers to prevent resource exhaustion.
  • Use Network Policies: Enforce network communication rules between containers to limit exposure to other services.

2. Excessive Permissions

Understanding the Risk

In Kubernetes, permissions are granted to users, services, and containers through RBAC, Service Accounts, and other mechanisms. However, over-permissioning can give attackers the ability to execute malicious actions if they compromise a resource with excessive access rights.

Mitigation Strategies

  • Principle of Least Privilege (PoLP): Grant the minimal necessary permissions to all users and workloads.
  • Audit Access Control Policies: Regularly review and audit RBAC policies and Service Account roles.
  • Use Auditing Tools: Tools like Kubernetes Audit Logs can help track who is accessing what, making it easier to spot excessive permissions.

3. Improper Secrets Management

Understanding the Risk

Kubernetes allows storing sensitive data, such as passwords and API keys, in the form of secrets. Improper handling of these secrets can lead to unauthorized access to critical infrastructure and data.

Mitigation Strategies

  • Encrypt Secrets: Ensure secrets are encrypted both at rest and in transit.
  • Use External Secrets Management: Integrate with tools like HashiCorp Vault or AWS Secrets Manager to securely store and manage secrets outside of Kubernetes.
  • Limit Access to Secrets: Restrict access to secrets based on user roles and ensure they are only available to the applications that need them.

4. Vulnerabilities in the Container Image

Understanding the Risk

Containers are built from images, and these images may contain security vulnerabilities if they are not regularly updated or come from untrusted sources. Attackers can exploit these vulnerabilities to gain access to your system.

Mitigation Strategies

  • Use Trusted Images: Only pull images from reputable sources and official repositories like Docker Hub or GitHub.
  • Regularly Scan Images: Use tools like Clair, Trivy, or Anchore to scan container images for known vulnerabilities.
  • Implement Image Signing: Sign images to ensure their integrity and authenticity before deploying them.

5. Insufficient Logging and Monitoring

Understanding the Risk

Without proper logging and monitoring, malicious activity within a Kubernetes cluster may go undetected. Security breaches and performance issues can escalate without visibility into system behavior.

Mitigation Strategies

  • Enable Audit Logs: Ensure Kubernetes audit logging is enabled to record every API request.
  • Centralized Logging: Use logging solutions like ELK Stack (Elasticsearch, Logstash, Kibana) or Splunk for centralized logging.
  • Integrate Monitoring Tools: Tools like Prometheus and Grafana can help with real-time monitoring and alerting on unusual activity.

6. Insecure Network Policies

Understanding the Risk

Kubernetes network policies define the rules governing traffic between pods and services. Without proper network segmentation, workloads may be exposed to potential attacks or unauthorized access.

Mitigation Strategies

  • Implement Network Segmentation: Use Kubernetes network policies to limit traffic to only necessary services.
  • Encrypt Traffic: Use mutual TLS (Transport Layer Security) to encrypt communication between services.
  • Implement DNS Policies: Enforce DNS-based security to block access to malicious external domains.

7. Lack of Pod Security Standards

Understanding the Risk

Kubernetes pods are the smallest deployable units, but insecure pod configurations can open the door for privilege escalation or container escape attacks.

Mitigation Strategies

  • Pod Security Policies: Use PodSecurityPolicy to define the security context for pods, enforcing secure settings like running containers with non-root users.
  • Use Security Contexts: Ensure pods use restricted security contexts to minimize privilege escalation risks.
  • Limit Host Access: Restrict pods’ access to the host system and its kernel.

8. Insecure API Server Configuration

Understanding the Risk

The Kubernetes API server is the primary entry point for interacting with a cluster. Misconfigurations or insufficient access controls can expose your entire Kubernetes environment to attackers.

Mitigation Strategies

  • Secure API Server: Ensure the API server is configured to only accept secure connections and that authentication mechanisms (e.g., RBAC, OIDC) are properly implemented.
  • Limit API Server Access: Restrict access to the API server using firewalls or other access control measures.
  • Use API Gateway: Use an API gateway for additional layer of security and monitoring for all inbound and outbound API traffic.

9. Exposed etcd

Understanding the Risk

etcd is the key-value store that holds critical Kubernetes configuration data. If etcd is not properly secured, it can become a target for attackers to gain control over the cluster’s configuration.

Mitigation Strategies

  • Encrypt etcd Data: Encrypt etcd data both at rest and in transit to protect sensitive information.
  • Limit Access to etcd: Restrict access to etcd only to trusted users and Kubernetes components.
  • Backup etcd Regularly: Ensure that etcd backups are performed regularly and stored securely.

10. Denial of Service (DoS) Vulnerabilities

Understanding the Risk

Kubernetes workloads can be vulnerable to denial of service (DoS) attacks, which can overwhelm resources, making services unavailable. These attacks may target Kubernetes API servers, workers, or network components.

Mitigation Strategies

  • Rate Limiting: Implement rate limiting for API requests to prevent DoS attacks on the Kubernetes API server.
  • Resource Quotas: Use Kubernetes resource quotas to prevent resource exhaustion by limiting the number of resources a user or pod can consume.
  • Use Ingress Controllers: Secure Kubernetes ingress controllers to prevent malicious external traffic from affecting your services.

Example: Applying OWASP Top 10 Kubernetes Best Practices

Let’s look at a practical example of securing a Kubernetes cluster by applying the OWASP Top 10 Kubernetes best practices.

  1. Configure Network Policies: To prevent unauthorized access between pods, create network policies that allow only certain pods to communicate with each other.
  2. Use Pod Security Policies: Enforce non-root user execution within pods to prevent privilege escalation.
  3. Enable API Server Auditing: Enable and configure API server auditing to keep track of all requests made to the Kubernetes API.

By implementing these practices, you ensure a more secure Kubernetes environment, reducing the likelihood of security breaches.

FAQ: OWASP Top 10 Kubernetes

1. What is the OWASP Top 10 Kubernetes?

The OWASP Top 10 Kubernetes is a list of the most critical security risks associated with Kubernetes environments. It provides guidance on how to secure Kubernetes clusters and workloads.

2. How can I secure my Kubernetes workloads?

You can secure Kubernetes workloads by using RBAC for access control, securing secrets management, configuring network policies, and regularly scanning container images for vulnerabilities.

3. What is the principle of least privilege (PoLP)?

PoLP is the practice of granting only the minimal permissions necessary for a user or service to perform its tasks, reducing the attack surface and mitigating security risks.

Conclusion

Securing your Kubernetes environment is a multi-faceted process that requires vigilance, best practices, and ongoing attention to detail. By understanding and addressing the OWASP Top 10 Kubernetes risks, you can significantly reduce the chances of a security breach in your Kubernetes deployment. Implementing robust security policies, regularly auditing configurations, and adopting a proactive approach to security will help ensure that your Kubernetes clusters remain secure, stable, and resilient.

For more detailed guidance, consider exploring official Kubernetes documentation, and security tools, and following the latest Kubernetes security updates.Thank you for reading the DevopsRoles page!

External Resources:

Understanding How K8s CPU Requests and Limits Actually Work

Introduction

Managing CPU resources in Kubernetes (K8s) is critical for efficient application performance and cost management. Kubernetes allows users to set CPU requests and limits for each container, ensuring that resources are allocated precisely as needed. But what do these terms mean, and how do they work in practice? This article provides a comprehensive guide to understanding K8s CPU requests and limits, their role in containerized environments, and how to configure them effectively.

Whether you’re new to Kubernetes or looking to refine your resource allocation strategy, understanding CPU requests and limits is vital for building resilient, scalable applications.

What Are K8s CPU Requests and Limits?

K8s CPU Requests

A CPU request in Kubernetes specifies the minimum amount of CPU that a container is guaranteed to receive when it runs. Think of it as a reserved amount of CPU that Kubernetes will allocate to ensure the container performs adequately. CPU requests are particularly valuable in shared cluster environments where multiple applications may compete for resources.

Key Points About CPU Requests

  • CPU requests determine the minimum CPU available to a container.
  • The Kubernetes scheduler uses requests to decide on pod placement.
  • CPU requests are measured in cores (e.g., 0.5 means half a CPU core).

K8s CPU Limits

CPU limits specify the maximum amount of CPU a container can consume. This prevents a container from monopolizing resources, ensuring other workloads have fair access to the CPU. When a container reaches its CPU limit, Kubernetes throttles it, reducing performance but maintaining system stability.

Key Points About CPU Limits

  • CPU limits cap the maximum CPU usage for a container.
  • Setting limits ensures fair resource distribution across containers.
  • Exceeding the limit results in throttling, not termination.

Importance of CPU Requests and Limits in Kubernetes

Configuring CPU requests and limits correctly is essential for the following reasons:

  1. Efficient Resource Utilization: Optimizes CPU usage and prevents resource wastage.
  2. Improved Application Stability: Ensures critical applications get the resources they need.
  3. Enhanced Performance Management: Prevents performance issues from overconsumption or under-provisioning.
  4. Cost Management: Reduces over-provisioning, lowering operational costs in cloud environments.

How to Set CPU Requests and Limits in Kubernetes

Kubernetes defines CPU requests and limits in the container specification within a pod manifest file. Below is an example YAML configuration demonstrating how to set CPU requests and limits for a container.

apiVersion: v1
kind: Pod
metadata:
  name: cpu-demo
spec:
  containers:
  - name: cpu-demo-ctr
    image: nginx
    resources:
      requests:
        cpu: "0.5"    # Reserve 0.5 CPU core for this container
      limits:
        cpu: "1"      # Set the maximum CPU usage to 1 core

Explanation of the YAML File

  • requests.cpu: Guarantees the container 0.5 CPU cores.
  • limits.cpu: Sets the CPU cap at 1 core, throttling any usage above this limit.

Examples of Using K8s CPU Requests and Limits

Basic Scenario: Setting Requests Only

In some cases, it may be practical to set only CPU requests without limits. This guarantees a minimum CPU, while the container can consume more if available. This approach suits non-critical applications where some variability in resource consumption is tolerable.

resources:
  requests:
    cpu: "0.3"

Intermediate Scenario: Setting Both Requests and Limits

For applications with predictable CPU demands, setting both requests and limits ensures consistent performance without overloading the node.

resources:
  requests:
    cpu: "0.4"
  limits:
    cpu: "0.8"

Advanced Scenario: Adjusting CPU Limits Dynamically

In complex applications, CPU limits may need to be adjusted based on varying workloads. Kubernetes provides autoscaling features and custom resource configurations to scale CPU requests and limits dynamically, adapting to workload changes.

apiVersion: autoscaling/v2beta2
kind: HorizontalPodAutoscaler
metadata:
  name: hpa-example
spec:
  scaleTargetRef:
    apiVersion: apps/v1
    kind: Deployment
    name: my-deployment
  minReplicas: 1
  maxReplicas: 10
  metrics:
  - type: Resource
    resource:
      name: cpu
      target:
        type: Utilization
        averageUtilization: 80

Best Practices for Setting CPU Requests and Limits

  1. Understand Application Resource Needs: Analyze application workloads to set appropriate CPU requests and limits.
  2. Use Horizontal Pod Autoscaling (HPA): Set up autoscaling based on CPU usage for dynamically scaling applications.
  3. Monitor and Adjust: Regularly review CPU utilization and adjust requests and limits as needed.
  4. Avoid Setting Limits Too Low: Setting limits too low can lead to throttling, degrading application performance.

Frequently Asked Questions

What happens if I don’t set CPU requests and limits?

Kubernetes assigns default values when CPU requests and limits are not specified. However, this can lead to resource contention issues and reduced application performance in high-demand scenarios.

What is the difference between a CPU request and a CPU limit in Kubernetes?

A CPU request guarantees a minimum amount of CPU, while a CPU limit caps the maximum CPU usage. Requests affect scheduling, while limits manage resource consumption during runtime.

How does Kubernetes handle CPU overcommitment?

If the total CPU requests exceed available resources, Kubernetes schedules pods based on requests. However, if multiple containers request more than the node can provide, some containers may experience reduced performance due to CPU contention.

Can I change CPU requests and limits for running containers?

Yes, but changing requests and limits typically requires redeploying the pod with the updated configuration. For production environments, apply changes in a controlled manner to avoid disruptions.

Why is my container being throttled even though it has available CPU?

Throttling occurs if the container exceeds its defined CPU limit, even if additional CPU is available. Adjusting the limit or removing it may reduce throttling, but this should be done with caution in shared environments.

Additional Resources

For further reading, consider visiting the following authoritative resources:

  • Kubernetes Documentation on Managing Compute Resources
  • Kubernetes Resource Management Best Practices

Conclusion

Setting CPU requests and limits in Kubernetes is essential for achieving optimal resource allocation and application performance. By correctly configuring CPU resources, you ensure applications have the resources they need while maintaining the overall health of your Kubernetes cluster. Applying these strategies can lead to a balanced, efficient, and cost-effective Kubernetes environment that supports robust application performance under varying loads.

In summary:

  • CPU Requests ensure a baseline level of resources for each container.
  • CPU Limits cap maximum resource usage, preventing resource hogging.
  • Applying best practices and regularly adjusting configurations based on real-world performance data can significantly enhance your Kubernetes management.

Managing CPU requests and limits effectively can help you scale applications with confidence and ensure that critical workloads remain performant even in high-demand environments. Thank you for reading the DevopsRoles page!

CVE-2024-38812: A Comprehensive Guide to the VMware Vulnerability

Introduction

In today’s evolving digital landscape, cybersecurity vulnerabilities can create serious disruptions to both organizations and individuals. One such vulnerability, CVE-2024-38812, targets VMware systems and poses significant risks to businesses reliant on this platform. Understanding CVE-2024-38812, its implications, and mitigation strategies is crucial for IT professionals, network administrators, and security teams.

In this article, we’ll break down the technical aspects of this vulnerability, provide real-world examples, and outline methods to secure your systems effectively.

What is CVE-2024-38812?

CVE-2024-38812 Overview

CVE-2024-38812 is a critical security vulnerability identified in VMware systems, specifically targeting the virtual environment and allowing attackers to exploit weaknesses in the system. This vulnerability could enable unauthorized access, data breaches, or system control.

The vulnerability has been rated 9.8 on the CVSS (Common Vulnerability Scoring System) scale, making it a severe issue that demands immediate attention. Affected products may include VMware ESXi, VMware Workstation, and VMware Fusion.

How Does CVE-2024-38812 Work?

Exploitation Path

CVE-2024-38812 is a remote code execution (RCE) vulnerability. An attacker can exploit this flaw by sending specially crafted requests to the VMware system. Upon successful exploitation, the attacker can gain access to critical areas of the virtualized environment, including the ability to:

• Execute arbitrary code on the host machine.

• Access and exfiltrate sensitive data.

• Escalate privileges and gain root or administrative access.

Affected VMware Products

The following VMware products have been identified as vulnerable:

VMware ESXi versions 7.0.x and 8.0.x

VMware Workstation Pro 16.x

VMware Fusion 12.x

It’s essential to keep up-to-date with VMware’s advisories for the latest patches and product updates.

Why is CVE-2024-38812 Dangerous?

Potential Impacts

The nature of remote code execution makes CVE-2024-38812 particularly dangerous for enterprise environments that rely on VMware’s virtualization technology. Exploiting this vulnerability can result in:

Data breaches: Sensitive corporate or personal data could be compromised.

System downtime: Attackers could cause significant operational disruptions, leading to service downtime or financial loss.

Ransomware attacks: Unauthorized access could facilitate ransomware attacks, where malicious actors lock crucial data behind encryption and demand payment for its release.

How to Mitigate CVE-2024-38812

Patching Your Systems

The most effective way to mitigate the risks associated with CVE-2024-38812 is to apply patches provided by VMware. Regularly updating your VMware products ensures that your system is protected from the latest vulnerabilities.

1. Check for patches: VMware releases security patches and advisories on their website. Ensure you are subscribed to notifications for updates.

2. Test patches: Always test patches in a controlled environment before deploying them in production. This ensures compatibility with your existing systems.

3. Deploy promptly: Once tested, deploy patches across all affected systems to minimize exposure to the vulnerability.

Network Segmentation

Limiting network access to VMware hosts can significantly reduce the attack surface. Segmentation ensures that attackers cannot easily move laterally through your network in case of a successful exploit.

1. Restrict access to the management interface using a VPN or a dedicated management VLAN.

2. Implement firewalls and other network controls to isolate sensitive systems.

Regular Security Audits

Conduct regular security audits and penetration testing to identify any potential vulnerabilities that might have been overlooked. These audits should include:

Vulnerability scanning to detect known vulnerabilities like CVE-2024-38812.

Penetration testing to simulate potential attacks and assess your system’s resilience.

Frequently Asked Questions (FAQ)

What is CVE-2024-38812?

CVE-2024-38812 is a remote code execution vulnerability in VMware systems, allowing attackers to gain unauthorized access and potentially control affected systems.

How can I tell if my VMware system is vulnerable?

VMware provides a list of affected products in their advisory. You can check your system version and compare it to the advisory. Systems running older, unpatched versions of ESXi, Workstation, or Fusion may be vulnerable.

How do I patch my VMware system?

To patch your system, visit VMware’s official support page, download the relevant security patches, and apply them to your system. Ensure you follow best practices, such as testing patches in a non-production environment before deployment.

What are the risks of not patching CVE-2024-38812?

If left unpatched, CVE-2024-38812 could allow attackers to execute code remotely, access sensitive data, disrupt operations, or deploy malware such as ransomware.

Can network segmentation help mitigate the risk?

Yes, network segmentation is an excellent strategy to limit the attack surface by restricting access to critical parts of your infrastructure. Use VPNs and firewalls to isolate sensitive areas.

Real-World Examples of VMware Vulnerabilities

While CVE-2024-38812 is a new vulnerability, past VMware vulnerabilities such as CVE-2021-21985 and CVE-2020-4006 highlight the risks of leaving VMware systems unpatched. In both cases, attackers exploited VMware vulnerabilities to gain unauthorized access and compromise corporate networks.

In 2021, CVE-2021-21985, another remote code execution vulnerability in VMware vCenter, was actively exploited in the wild before patches were applied. Organizations that delayed patching faced data breaches and system disruptions.

These examples underscore the importance of promptly addressing CVE-2024-38812 by applying patches and maintaining good security hygiene.

Best Practices for Securing VMware Environments

1. Regular Patching and Updates

• Regularly apply patches and updates from VMware.

• Automate patch management if possible to minimize delays in securing your infrastructure.

2. Use Multi-Factor Authentication (MFA)

• Implement multi-factor authentication (MFA) to strengthen access controls.

• MFA can prevent attackers from gaining access even if credentials are compromised.

3. Implement Logging and Monitoring

• Enable detailed logging for VMware systems.

• Use monitoring tools to detect suspicious activity, such as unauthorized access attempts or changes in system behavior.

4. Backup Critical Systems

• Regularly back up virtual machines and data to ensure minimal downtime in case of a breach or ransomware attack.

• Ensure backups are stored securely and offline where possible.

External Links

VMware Security Advisories

National Vulnerability Database (NVD) – CVE-2024-38812

VMware Official Patches and Updates

Conclusion

CVE-2024-38812 is a serious vulnerability that can have far-reaching consequences if left unaddressed. As with any security threat, prevention is always better than cure. By patching systems, enforcing best practices like MFA, and conducting regular security audits, organizations can significantly reduce the risk of falling victim to this vulnerability.

Always stay vigilant by keeping your systems up-to-date and monitoring for any unusual activity that could indicate a breach. If CVE-2024-38812 is relevant to your environment, act now to protect your systems and data from potentially devastating attacks.

This article provides a clear understanding of the VMware vulnerability CVE-2024-38812 and emphasizes actionable steps to mitigate risks. Properly managing and securing your VMware environment is crucial for maintaining a secure and resilient infrastructure. Thank you for reading the DevopsRoles page!

Kubernetes Lens: A Deep Guide to the Ultimate Kubernetes IDE

Introduction

Kubernetes has become the go-to solution for container orchestration, but managing multiple clusters, services, and workloads can still be overwhelming, even for seasoned DevOps engineers. Enter Kubernetes Lens – a robust, open-source Integrated Development Environment (IDE) for Kubernetes that simplifies the entire process, offering real-time insights, multi-cluster management, and a user-friendly interface.

Whether you’re new to Kubernetes or an experienced operator, this guide takes a deep dive into Kubernetes Lens. We’ll cover everything from initial setup and configuration to advanced features like Helm support, real-time metrics, and a rich extension ecosystem.

What is Kubernetes Lens?

Kubernetes Lens is a comprehensive, open-source Kubernetes IDE designed to help administrators and developers manage and monitor Kubernetes clusters with ease. It offers a graphical interface that allows users to monitor clusters, troubleshoot issues, view real-time logs, and even manage resources — all from a single platform.

Lens allows users to manage multiple clusters across different environments, making it the perfect solution for those who work in complex, multi-cloud setups or use Kubernetes at scale.

Key Features of Kubernetes Lens

1. Cluster Management

One of the primary strengths of Kubernetes Lens is its ability to manage multiple clusters from a single interface. This feature is essential for users working in multi-cloud environments or managing clusters in different stages of development, such as production, staging, and development environments.

2. Real-Time Metrics

Lens provides real-time statistics and metrics, allowing you to monitor the health and performance of your Kubernetes resources without needing third-party tools. The metrics cover everything from CPU and memory usage to pod performance and node health.

3. Terminal Integration

You can interact with your Kubernetes clusters directly through an integrated terminal in Kubernetes Lens. This terminal allows you to run kubectl commands, shell into pods, and execute scripts without switching between different tools.

4. Log Viewer

Troubleshooting Kubernetes issues often involves looking through pod logs, and Lens makes this simple with its built-in log viewer. You can easily access logs from running or failed pods, filter logs by keyword, and analyze them without needing to access the command line.

5. Helm Charts Management

Helm is the go-to package manager for Kubernetes, and Lens integrates seamlessly with it. You can browse, install, and manage Helm charts directly from the Lens interface, simplifying the process of deploying applications to your clusters.

6. Extensions and Plugins

Lens supports a wide range of extensions, allowing you to customize and extend its functionality. These extensions range from additional monitoring tools to integrations with other cloud-native technologies like Prometheus, Jaeger, and more.

Why Kubernetes Lens?

Kubernetes Lens simplifies the user experience, making it the go-to tool for Kubernetes administrators and developers who want to avoid using multiple command-line tools. Here are some reasons why Kubernetes Lens stands out:

  1. Enhanced Productivity: With Kubernetes Lens, you can visualize your cluster’s resources and configurations, which speeds up debugging, management, and general operations.
  2. Multi-Cluster Management: Whether you’re working with clusters on AWS, Azure, GCP, or on-premises, Lens makes it easy to manage them all from one interface.
  3. Real-Time Insights: Lens provides instant access to real-time statistics, allowing you to make informed decisions regarding scaling, troubleshooting, and resource allocation.
  4. Developer-Friendly: For developers who might not be familiar with Kubernetes internals, Lens offers a simple way to interact with clusters, removing the complexity of using the kubectl command-line tool for every task.

Step-by-Step Guide: Getting Started with Kubernetes Lens

Step 1: Installing Kubernetes Lens

Kubernetes Lens is available on Windows, macOS, and Linux. To install Lens, follow these steps:

  1. Go to the Kubernetes Lens official website.
  2. Download the appropriate version for your operating system.
  3. Follow the installation instructions for your platform (Lens provides a simple installer for all major OSs).
  4. Once installed, open Lens. It will automatically detect your existing Kubernetes configurations (if you have kubectl set up) and display them in the interface.

Step 2: Connecting Kubernetes Clusters

Lens integrates directly with your existing Kubernetes clusters. If you’ve previously set up Kubernetes on your local machine (via Minikube, Kind, or other solutions), or if you have clusters on the cloud, Lens will automatically detect them.

To manually add a cluster:

  1. Click on Add Cluster.
  2. Import your Kubeconfig file (this can be exported from your cloud provider or local setup).
  3. Your cluster will now appear in the Clusters tab.

Step 3: Exploring the Interface

Kubernetes Lens provides a simple, intuitive interface. Here’s a quick overview of the main sections:

  • Cluster Dashboard: Shows an overview of the health and resources of your connected cluster. You can monitor nodes, pods, and services in real-time.
  • Workload Views: This section provides detailed insights into workloads, such as deployments, stateful sets, jobs, and pods.
  • Networking: Manage services, ingresses, and network policies.
  • Storage: View persistent volumes (PV) and persistent volume claims (PVC) usage across your cluster.
  • Configuration: Manage Kubernetes ConfigMaps, Secrets, and other configurations directly from the Lens interface.

Advanced Kubernetes Lens Features

Helm Charts

Helm simplifies application deployment on Kubernetes, and Lens integrates directly with Helm for chart management. You can:

  • Browse Helm repositories and view available charts.
  • Install, upgrade, or rollback Helm charts.
  • View the status of each Helm release directly from the Lens UI.

Multi-Cluster Management

With Kubernetes Lens, you can manage multiple clusters from different environments, including on-premises and cloud-hosted Kubernetes setups. Switching between clusters is as easy as clicking on the desired cluster, allowing you to work across multiple environments without the need for multiple windows or command-line sessions.

Extensions and Plugins

Lens offers an extensive library of extensions that allow you to add new capabilities, such as:

  • Prometheus for advanced monitoring and alerting.
  • Jaeger for distributed tracing.
  • GitOps tools for continuous delivery.

You can find and install these extensions directly from Lens, or even create your own custom extensions.

Integrated Terminal

One of the standout features of Kubernetes Lens is the integrated terminal. It enables you to:

  • Run kubectl commands directly from the Lens interface.
  • Connect to any pod and open an interactive shell.
  • Run scripts and manage resources without leaving the Lens environment.

Best Practices for Using Kubernetes Lens

Regularly Monitor Cluster Health

Kubernetes Lens provides a dashboard with real-time metrics. Make it a habit to regularly monitor this data to identify potential bottlenecks, resource issues, or misconfigurations. Proactive monitoring helps prevent outages and improves overall cluster performance.

Leverage Helm for Application Management

Helm simplifies complex Kubernetes deployments by managing applications as packages. Kubernetes Lens’ Helm integration allows you to easily install, update, and manage applications across multiple clusters. Make use of Helm to streamline the deployment of microservices and other Kubernetes-based applications.

Use Extensions to Enhance Lens Functionality

Extensions are a powerful feature of Kubernetes Lens. If you’re using additional Kubernetes tools like Prometheus, Jaeger, or ArgoCD, leverage their Lens extensions to enhance your monitoring and management capabilities. Explore the Lens extension hub to discover new tools and integrations that can benefit your specific workflow.

Frequently Asked Questions (FAQs)

1. Is Kubernetes Lens completely free?

Yes, Kubernetes Lens is an open-source project and free to use for both personal and commercial purposes.

2. How does Kubernetes Lens handle multi-cluster management?

Lens allows you to manage multiple clusters from a single interface, making it easy to switch between environments and monitor all your clusters in one place.

3. Does Kubernetes Lens support Helm integration?

Yes, Kubernetes Lens fully supports Helm. You can browse Helm charts, install applications, and manage releases directly from the Lens interface.

4. Can I install extensions in Kubernetes Lens?

Yes, Kubernetes Lens has a rich ecosystem of extensions. You can install these extensions from the Lens Extension Hub or develop custom extensions to meet your needs.

5. Do I need to be a Kubernetes expert to use Kubernetes Lens?

No, Kubernetes Lens simplifies many aspects of Kubernetes management, making it accessible for beginners. However, some basic Kubernetes knowledge will be helpful for advanced features.

Conclusion

Kubernetes Lens is a game-changer for Kubernetes cluster management. Whether you’re just starting with Kubernetes or are a seasoned administrator, Lens offers an intuitive, feature-rich interface that simplifies everything from monitoring workloads to managing Helm charts and extensions. Its ability to manage multiple clusters and provide real-time insights makes it an indispensable tool for anyone working with Kubernetes.

If you’re looking to streamline your Kubernetes operations, Kubernetes Lens should be your go-to IDE. Start using it today to experience its full potential in simplifying your Kubernetes workflows! Thank you for reading the DevopsRoles page!

A Deep Guide to Kubernetes Monitoring Tools: From Basics to Advanced

Introduction

Kubernetes is the backbone of modern containerized applications, handling everything from deployment to scaling with ease. However, with this complexity comes the need for powerful monitoring tools. Monitoring your Kubernetes clusters is critical for ensuring performance, detecting issues early, and optimizing resource usage.

In this blog, we’ll take a deep dive into Kubernetes monitoring tools, exploring both basic and advanced options, so you can find the best fit for your needs-whether you’re just starting with Kubernetes or managing large-scale production environments.

What is Kubernetes Monitoring?

Kubernetes monitoring involves gathering data about your system, including metrics, logs, and traces. This data gives insight into how well your clusters are performing, and helps you identify and solve issues before they affect end users. Monitoring Kubernetes involves tracking:

  • Node metrics: CPU, memory usage, and disk I/O on individual nodes.
  • Pod and container metrics: The health and performance of containers and pods.
  • Kubernetes control plane: Monitoring critical components like the API server and etcd.
  • Network performance: Monitoring throughput and network latency across the cluster.
  • Logs and distributed traces: Logs for troubleshooting and traces to track how requests are processed.

The Best Kubernetes Monitoring Tools

1. Prometheus

Prometheus is an open-source monitoring tool that has become the default choice for Kubernetes monitoring. It pulls in metrics from your clusters, and its powerful PromQL query language allows you to extract meaningful insights from the data.

Why Prometheus?

Prometheus integrates seamlessly with Kubernetes, automatically discovering and collecting metrics from services and containers. It’s flexible and scalable, with a wide ecosystem of exporters and integrations.

  • Key Features: Metrics collection via service discovery, PromQL, and alerting.
  • Pros: Easy to scale, robust community support.
  • Cons: Lacks native log and trace management, requires additional tools for these functionalities.

2. Grafana

Grafana is a visualization tool that pairs perfectly with Prometheus. It allows you to create interactive dashboards, making it easier to visualize complex metrics and share insights with your team.

Why Grafana?

Grafana’s ability to pull data from multiple sources, including Prometheus, InfluxDB, and Elasticsearch, makes it a versatile tool for creating rich, detailed dashboards.

  • Key Features: Custom dashboards, alerting, plugin ecosystem.
  • Pros: Great for data visualization, supports multiple data sources.
  • Cons: Can become resource-intensive with large datasets.

3. Datadog

Datadog is a fully-managed SaaS monitoring tool that provides out-of-the-box Kubernetes monitoring. It combines metrics, logs, and traces into one platform, offering a comprehensive view of your environment.

Why Datadog?

Datadog excels in cloud-native environments, with deep integration across AWS, Azure, and GCP. It automatically collects Kubernetes metrics and provides advanced monitoring capabilities like container and application performance monitoring.

  • Key Features: Kubernetes monitoring, log management, container insights.
  • Pros: Easy setup, integrated platform for metrics, logs, and traces.
  • Cons: Can be costly for large environments.

4. ELK Stack (Elasticsearch, Logstash, Kibana)

The ELK Stack is a popular open-source tool for centralized logging. It collects logs from Kubernetes and allows you to analyze them with Elasticsearch, visualize them with Kibana, and process them with Logstash.

Why ELK Stack?

The ELK Stack is ideal for organizations needing deep log analysis. It provides powerful search and filtering capabilities to find specific events or trends in your Kubernetes logs.

  • Key Features: Centralized logging, log search, and filtering.
  • Pros: Excellent for log aggregation and analysis.
  • Cons: Complex to set up, resource-heavy.

5. Jaeger

Jaeger is a distributed tracing tool designed for monitoring the performance of microservices-based applications in Kubernetes. It’s essential for debugging latency issues and understanding how requests flow through different services.

Why Jaeger?

Jaeger tracks requests across your services, helping you identify bottlenecks and optimize performance in microservices environments.

  • Key Features: Distributed tracing, performance optimization.
  • Pros: Great for debugging complex microservices architectures.
  • Cons: Requires setup and configuration for large-scale environments.

6. Thanos

Thanos builds on top of Prometheus, providing scalability and high availability. It’s perfect for large, distributed Kubernetes environments that require long-term metrics storage.

Why Thanos?

Thanos is a highly scalable solution for Prometheus, offering long-term storage, global querying across clusters, and high availability. It ensures data is always available, even during downtime.

  • Key Features: Global query view, long-term storage, high availability.
  • Pros: Scalable for large production environments.
  • Cons: More complex to set up and manage than Prometheus alone.

7. Cortex

Cortex, like Thanos, is designed to scale Prometheus. However, Cortex adds multi-tenancy support, making it ideal for organizations that need to securely store metrics for multiple users or teams.

Why Cortex?

Cortex allows multiple tenants to securely store and query Prometheus metrics, making it an enterprise-grade solution for large-scale Kubernetes environments.

  • Key Features: Multi-tenancy, horizontal scalability.
  • Pros: Ideal for multi-team environments, scalable.
  • Cons: Complex architecture.

Frequently Asked Questions (FAQs)

What are the best Kubernetes monitoring tools for small clusters?

Prometheus and Grafana are excellent for small Kubernetes clusters due to their open-source nature and minimal configuration needs. They provide powerful monitoring without the cost or complexity of enterprise-grade solutions.

Is logging important in Kubernetes monitoring?

Yes, logs provide critical insights for troubleshooting and debugging issues in Kubernetes. Tools like the ELK Stack and Datadog are commonly used for log management in Kubernetes environments.

Can I use multiple Kubernetes monitoring tools together?

Absolutely. Many teams use a combination of tools. For example, you might use Prometheus for metrics, Grafana for visualization, Jaeger for tracing, and the ELK Stack for logs.

What’s the difference between Prometheus and Thanos?

Prometheus is a standalone monitoring tool, while Thanos extends Prometheus by adding long-term storage, high availability, and the ability to query across multiple clusters.

How do I get started with Kubernetes monitoring?

The easiest way to get started is by deploying Prometheus and Grafana with Helm charts. Helm automates much of the setup and ensures that the monitoring tools are configured correctly.

Conclusion

Effective monitoring is the key to maintaining a healthy, performant Kubernetes cluster. Whether you’re just starting out or managing a large-scale environment, the tools outlined in this guide can help you monitor, optimize, and scale your infrastructure. By using the right tools-like Prometheus, Grafana, and Thanos-you can ensure that your Kubernetes clusters are always performing at their best. Thank you for reading the DevopsRoles page!

How to Fix Failed to Start Kubelet Service Error in Kubernetes

Introduction

Kubernetes has become the go-to platform for container orchestration, providing powerful tools for deploying, managing, and scaling containerized applications. However, like any complex system, it can encounter errors that may disrupt its operation. One common issue is the “Failed to start kubelet service” error, which can prevent your Kubernetes nodes from functioning correctly.

This article will guide you through the process of identifying and resolving the “Failed to start kubelet” error in Kubernetes. Whether you’re a beginner or an advanced user, this step-by-step guide will help you fix the problem and get your Kubernetes cluster back on track.

What Is Kubelet?

Before diving into the troubleshooting steps, it’s essential to understand what the kubelet is and why it’s critical to Kubernetes.

What Does the Kubelet Do?

The kubelet is a vital component of Kubernetes, responsible for running containers on a node. It communicates with the Kubernetes API server, ensuring that the containers specified in PodSpec are running and healthy. The kubelet monitors the state of the containers, reporting back to the control plane. If the kubelet fails to start, the node becomes unresponsive, leading to potential downtime in your applications.

Common Causes of “Failed to Start Kubelet Service” Error

Understanding the root cause of the “Failed to start kubelet service” error is crucial for effectively resolving it. Here are some common reasons why this error might occur:

1. Misconfigured Kubelet Configuration

  • Incorrectly configured kubelet settings in /etc/kubernetes/kubelet.conf or other related files can prevent the service from starting.

2. Missing or Corrupted Certificates

  • The kubelet relies on SSL/TLS certificates to communicate securely with the Kubernetes API server. Missing or corrupted certificates can lead to the service failing to start.

3. Resource Constraints

  • Insufficient CPU, memory, or disk resources on the node can cause the kubelet service to fail. Kubernetes requires specific resources to function correctly, and if those resources are unavailable, the kubelet may not start.

4. System-Level Issues

  • Problems with the underlying operating system, such as missing dependencies, incorrect permissions, or a malfunctioning systemd service, can prevent the kubelet from starting.

5. Network Configuration Issues

  • Misconfigured network settings, such as DNS or firewall rules, can block the kubelet’s communication with the API server, leading to startup failures.

6. Version Incompatibility

  • Mismatched versions of Kubernetes components or dependencies can lead to conflicts that prevent the kubelet from starting.

Troubleshooting the “Failed to Start Kubelet Service” Error

Now that we understand the potential causes, let’s explore the steps to troubleshoot and fix the error.

Step 1: Check the Kubelet Logs

The first step in diagnosing the issue is to check the kubelet logs. The logs often contain detailed information about why the service failed to start.

journalctl -u kubelet -xe

Look for any error messages or warnings that can provide clues about the root cause. Common issues might include configuration errors, missing files, or failed dependencies.

Step 2: Verify Kubelet Configuration

Next, check the kubelet configuration files, typically located at /etc/kubernetes/kubelet.conf. Ensure that all settings are correctly configured and aligned with your Kubernetes cluster’s requirements.

Key Configuration Files to Review:

  • /etc/kubernetes/kubelet.conf
  • /var/lib/kubelet/config.yaml
  • /etc/systemd/system/kubelet.service.d/10-kubeadm.conf

Common misconfigurations include incorrect paths to certificates, misconfigured flags, or incorrect node labels.

Step 3: Check Certificates

Verify that the kubelet’s certificates are present and valid. The certificates are usually located in /var/lib/kubelet/pki/. If the certificates are missing or expired, the kubelet service will fail to start.

To check the certificates:

ls -l /var/lib/kubelet/pki/

If you find issues with the certificates, you may need to regenerate them or restore them from a backup.

Step 4: Ensure Adequate Resources

Ensure that the node has sufficient resources to run the kubelet. You can check the available CPU, memory, and disk space using the following commands:

free -h    # Check memory usage
df -h # Check disk space

If resources are low, consider upgrading the node’s hardware or freeing up resources by stopping unnecessary services.

Step 5: Review Systemd Configuration

The kubelet service is managed by systemd on most Linux distributions. Check the status of the systemd service and ensure it is correctly configured:

systemctl status kubelet

If the service is not running, try restarting it:

systemctl restart kubelet

Additionally, check for any issues in the systemd service file that might prevent the kubelet from starting.

Step 6: Inspect Network Configuration

Ensure that the node’s network configuration allows the kubelet to communicate with the Kubernetes API server. Common issues include misconfigured DNS settings, blocked ports, or firewall rules that prevent communication.

Check the network configuration:

ip a         # Check network interfaces
iptables -L # Check firewall rules

Correct any issues that might be preventing network communication.

Step 7: Address Version Compatibility

Ensure that all Kubernetes components, including the kubelet, API server, and other dependencies, are compatible. Mismatched versions can cause the kubelet to fail to start. Verify the version of the kubelet:

kubelet --version

If necessary, upgrade or downgrade the kubelet to match the rest of your Kubernetes cluster.

Frequently Asked Questions (FAQs)

1. What should I do if the kubelet logs show a certificate error?

  • If you encounter a certificate error, verify that the certificates are present, valid, and correctly configured. If needed, regenerate the certificates or restore them from a backup.

2. How can I prevent the kubelet service from failing in the future?

  • Regularly monitor system resources, keep your Kubernetes components up to date, and ensure that all configurations are correct. Additionally, implement a robust backup and recovery plan for critical files like certificates.

3. Can a misconfigured DNS cause the kubelet to fail to start?

  • Yes, incorrect DNS settings can prevent the kubelet from communicating with the API server, leading to a startup failure.

4. How do I check if there are sufficient resources for the kubelet?

  • Use commands like free -h for memory and df -h for disk space to verify that the node has adequate resources to run the kubelet service.

5. What is the role of systemd in managing the kubelet service?

  • Systemd is responsible for managing the kubelet service on most Linux distributions. It ensures that the kubelet starts automatically and remains running. If systemd is misconfigured, the kubelet may fail to start.

Conclusion

The Failed to start kubelet service error in Kubernetes can be caused by various issues, ranging from configuration problems to resource constraints. By following the steps outlined in this guide, you can diagnose and resolve the error, ensuring that your Kubernetes nodes are running smoothly.

Regular monitoring, correct configuration, and a proactive approach to resource management are key to preventing this error from occurring in the future. If you continue to encounter issues, consider reaching out to the Kubernetes community for additional support.

By addressing the root causes and following best practices, you’ll minimize downtime and keep your Kubernetes cluster operating efficiently. Thank you for reading the DevopsRoles page!

Fix ImagePullBackOff Error in Kubernetes: A Comprehensive Guide

Introduction

The ImagePullBackOff error in Kubernetes is one of the most common issues developers encounter when deploying applications. This error occurs when Kubernetes is unable to pull the required container image from a container registry. While this issue can be frustrating, understanding its root causes and knowing how to troubleshoot it can save you considerable time and effort.

In this guide, we will delve into the basics of Kubernetes image pulling, explore the common reasons behind the ImagePullBackOff error, and provide step-by-step instructions to resolve it. Whether you are new to Kubernetes or have some experience, this guide will help you effectively fix the ImagePullBackOff error.

What is the ImagePullBackOff Error in Kubernetes?

Understanding Kubernetes Image Pull Process

Before diving into the error itself, it’s essential to understand how Kubernetes pulls images. When you deploy a pod in Kubernetes, the kubelet on the node where the pod is scheduled tries to pull the specified container image from a container registry. This process involves several steps, including image resolution, authentication, and downloading the image layers. If any of these steps fail, Kubernetes will throw an ImagePullBackOff error.

What Does ImagePullBackOff Mean?

The term ImagePullBackOff signifies that Kubernetes attempted to pull an image and failed, so it is backing off from retrying the operation. The system will eventually retry, but with a backoff strategy, meaning the retry interval will increase over time.

Common Causes of ImagePullBackOff Error

Several factors can contribute to the ImagePullBackOff error in Kubernetes. Understanding these causes will help you identify and fix the problem more efficiently.

1. Incorrect Image Name or Tag

One of the most common reasons for the ImagePullBackOff error is specifying an incorrect image name or tag in your Kubernetes deployment manifest.

2. Authentication Issues

If your image is stored in a private registry, Kubernetes requires proper credentials to access it. A misconfiguration in the imagePullSecrets or missing credentials can lead to the ImagePullBackOff error.

3. Network Issues

Network connectivity problems between the Kubernetes node and the container registry can also cause image pull failures. This issue could be due to DNS misconfiguration, firewall rules, or general network instability.

4. Image Does Not Exist

Sometimes, the specified image simply does not exist in the registry. This issue might be due to an outdated image tag or a typo in the image name.

5. Registry Rate Limits

Container registries often impose rate limits to control the number of requests they handle. If your Kubernetes cluster is pulling images too frequently, you may hit these limits, resulting in ImagePullBackOff errors.

How to Fix ImagePullBackOff Error in Kubernetes

Now that we have identified the common causes, let’s explore how to fix the ImagePullBackOff error in Kubernetes. The following steps will guide you through troubleshooting and resolving the issue.

Step 1: Check the Image Name and Tag

Ensure the Correct Image Name and Tag

First, verify that the image name and tag in your deployment manifest are correct. A small typo can lead to Kubernetes failing to pull the image. Here’s how you can check:

apiVersion: apps/v1
kind: Deployment
metadata:
name: my-app
spec:
replicas: 3
template:
spec:
containers:
- name: my-container
image: myregistry/my-app:v1.0.0

Ensure that the image field points to the correct image in the registry.

Validate the Image Existence in the Registry

Use tools like docker pull to manually pull the image from the registry to ensure it exists:

docker pull myregistry/my-app:v1.0.0

Step 2: Verify ImagePullSecrets for Private Registries

Check the ImagePullSecrets Configuration

If your image is stored in a private registry, you need to configure Kubernetes to use the correct imagePullSecrets. Here’s an example of how to configure it:

apiVersion: v1
kind: Secret
metadata:
name: myregistrykey
data:
.dockerconfigjson: <base64-encoded-docker-config>
type: kubernetes.io/dockerconfigjson

Ensure that your deployment references this secret:

apiVersion: apps/v1
kind: Deployment
metadata:
name: my-app
spec:
template:
spec:
containers:
- name: my-container
image: myregistry/my-app:v1.0.0
imagePullSecrets:
- name: myregistrykey

Step 3: Diagnose Network Connectivity Issues

Check Node Connectivity

Ensure that your Kubernetes nodes can reach the container registry. You can test connectivity by running a simple curl command:

curl -v https://myregistry/v2/

If this command fails, you’ll need to troubleshoot your network settings.

Verify DNS Configuration

DNS issues can also cause ImagePullBackOff errors. Check the DNS configuration of your Kubernetes nodes to ensure they can resolve the registry’s domain name.

Step 4: Handle Registry Rate Limits

Monitor and Optimize Image Pulls

If your registry is imposing rate limits, you may need to optimize how your Kubernetes cluster pulls images. Consider using a pull policy that reduces the frequency of pulls:

imagePullPolicy: IfNotPresent

This policy tells Kubernetes to pull the image only if it is not already present on the node, which can help avoid hitting rate limits.

Use an Image Cache

Another strategy is to set up an image cache within your cluster. This setup can reduce the number of requests to the external registry and prevent rate limit issues.

Step 5: Inspect Kubernetes Events and Logs

Check Pod Events

Kubernetes events can provide valuable insights into why an image pull is failing. Use the following command to view events related to a specific pod:

kubectl describe pod <pod-name>

Look for messages that indicate why the image pull failed.

Inspect Kubelet Logs

If you need more detailed information, inspect the kubelet logs on the node where the pod is scheduled:

journalctl -u kubelet

Look for any errors or warnings related to image pulling.

Advanced Troubleshooting Techniques

If the above steps don’t resolve the issue, consider the following advanced techniques.

Debugging with Init Containers

You can use an init container to debug image pull issues. Init containers run before the main application containers and can be used to test image pulls:

initContainers:
- name: init-debug
image: busybox
command: ['sh', '-c', 'docker pull myregistry/my-app:v1.0.0']

Using a Private Registry Mirror

For environments with strict rate limits or frequent image pulls, setting up a private registry mirror can be a robust solution. This mirror acts as a cache, reducing the load on the external registry.

FAQs

What should I do if I encounter an ImagePullBackOff error?

Start by checking the image name and tag in your deployment manifest. Ensure that Kubernetes has access to the registry, and verify network connectivity. If the image is in a private registry, confirm that your imagePullSecrets are correctly configured.

How can I prevent ImagePullBackOff errors in the future?

Implementing best practices such as using correct image tags, setting up image caches, and monitoring network connectivity can help prevent ImagePullBackOff errors. Regularly auditing your Kubernetes configurations is also essential.

Can ImagePullBackOff errors affect my application’s performance?

Yes, if Kubernetes is unable to pull the required images, your pods will not start, leading to downtime for your application. It’s crucial to address these errors promptly.

Conclusion

The ImagePullBackOff error in Kubernetes, while common, can be effectively managed with the right approach. By understanding the underlying causes and following the troubleshooting steps outlined in this guide, you can quickly resolve these errors and ensure the smooth deployment of your applications.

Remember, proactive monitoring and best practices are key to minimizing the occurrence of ImagePullBackOff errors. Whether you’re dealing with simple misconfigurations or more complex network issues, this guide provides the knowledge and tools you need to fix ImagePullBackOff errors in Kubernetes confidently. Thank you for reading the DevopsRoles page!

How to Fix CrashLoopBackOff Error in Kubernetes Pods

Introduction

The CrashLoopBackOff error is one of the most common issues you might encounter when working with Kubernetes. It occurs when a pod in your Kubernetes cluster repeatedly crashes after being started. Understanding and resolving this error is crucial for maintaining a healthy and stable Kubernetes environment.

In this comprehensive guide, we’ll walk you through the steps to troubleshoot and fix the CrashLoopBackOff error in Kubernetes pods. We’ll start with the basics and move on to more advanced techniques, ensuring you have all the tools you need to tackle this issue head-on.

What is a CrashLoopBackOff Error?

Understanding the Error

The CrashLoopBackOff error occurs when a Kubernetes pod fails to start successfully and repeatedly crashes. The “BackOff” part of the error indicates that Kubernetes is delaying the restart attempts of the pod because of the repeated failures.

Why Does it Happen?

There are several reasons why a pod might enter a CrashLoopBackOff state, including:

  • Incorrect Configuration: Misconfigured containers or incorrect command syntax can prevent a pod from starting.
  • Missing Dependencies: If a container relies on external services or resources that are not available, it may fail to start.
  • Resource Constraints: Insufficient CPU or memory resources can cause a container to crash.
  • Application Bugs: Internal errors in the application code running inside the container can lead to crashes.

How to Fix CrashLoopBackOff Error in Kubernetes Pods

1. Check the Pod Logs

The first step in diagnosing a CrashLoopBackOff error is to check the logs of the affected pod. The logs can provide insights into why the pod is crashing.

kubectl logs <pod_name>

If the pod has multiple containers, you can specify the container name:

kubectl logs <pod_name> -c <container_name>

Common Log Messages and Their Meanings

  • “Error: ImagePullBackOff”: The image specified in your pod is not available or cannot be pulled from the registry.
  • “OOMKilled”: The container was terminated because it exceeded the memory limits.
  • “CrashLoopBackOff”: Indicates repeated crashes, often accompanied by additional log details that can point to the root cause.

2. Inspect the Pod’s Configuration

Misconfigurations in the pod definition are a common cause of CrashLoopBackOff errors. Review your pod’s YAML file for issues such as incorrect environment variables, missing configurations, or incorrect command syntax.

Example YAML Snippet

apiVersion: v1
kind: Pod
metadata:
name: my-pod
spec:
containers:
- name: my-container
image: my-image:latest
command: ["my-command"]
env:
- name: ENV_VAR
value: "value"

Check for typos, incorrect paths, or missing environment variables.

3. Verify Resource Limits

If your pod is crashing due to resource constraints, it’s essential to verify and adjust the resource limits set in your pod configuration.

resources:
limits:
memory: "512Mi"
cpu: "500m"
requests:
memory: "256Mi"
cpu: "250m"

Increase the resource limits if necessary, but be mindful of the overall cluster capacity.

4. Check for Dependency Issues

Pods that depend on other services or resources might fail if those dependencies are not available. Use the following checks:

  • Service Availability: Ensure that the services or endpoints your pod relies on are up and running.
  • Network Policies: Verify that network policies or firewall rules are not blocking access to required resources.

5. Examine the Health Probes

Kubernetes uses liveness and readiness probes to monitor the health of containers. Misconfigured probes can cause Kubernetes to restart containers unnecessarily.

Example Probe Configuration

livenessProbe:
httpGet:
path: /healthz
port: 8080
initialDelaySeconds: 3
periodSeconds: 3

readinessProbe:
httpGet:
path: /ready
port: 8080
initialDelaySeconds: 3
periodSeconds: 3

Ensure that the probes are correctly configured and match the application’s behavior.

6. Review Application Code

If none of the above steps resolve the issue, the problem might lie within the application code itself. Review the application logs and error messages, and consider the following:

  • Unhandled Exceptions: Look for unhandled exceptions or errors that could cause the application to crash.
  • Memory Leaks: Memory leaks can cause the container to exceed memory limits and crash.
  • Startup Scripts: Ensure that any startup scripts or commands are correctly implemented and do not contain errors.

7. Check Kubernetes Events

Kubernetes events can provide additional context about what is happening with your pod. Use the following command to check the events:

kubectl describe pod <pod_name>

Look for any warnings or errors in the events section that might explain the CrashLoopBackOff state.

8. Rolling Back to a Previous Version

If a recent change caused the CrashLoopBackOff error, consider rolling back to a previous stable version of the pod or deployment.

kubectl rollout undo deployment/<deployment_name>

This command will roll back the deployment to the previous version, which might resolve the issue if it was introduced by a recent change.

9. Use a Debug Container

If you’re unable to determine the cause of the error, you can deploy a debug container in the same pod to investigate further.

apiVersion: v1
kind: Pod
metadata:
name: debug-pod
spec:
containers:
- name: debug-container
image: busybox
command: ['sh', '-c', 'sleep infinity']

This allows you to run debugging commands and interact with the environment as if you were inside the crashing container.

Common FAQs

Q1: How can I prevent a CrashLoopBackOff error from happening?

  • Regularly monitor pod logs and resource usage.
  • Implement robust error handling in your application code.
  • Use readiness and liveness probes to manage container health.

Q2: What should I do if the pod logs do not provide enough information?

  • Check Kubernetes events for additional details.
  • Deploy a debug container to investigate further.
  • Consider increasing logging verbosity for more detailed logs.

Q3: Can a CrashLoopBackOff error be caused by external dependencies?

Yes, if your pod relies on external services or resources that are unavailable, it can cause the pod to enter a CrashLoopBackOff state.

Conclusion

The CrashLoopBackOff error in Kubernetes can be challenging to diagnose, but by following the steps outlined in this guide, you can systematically troubleshoot and resolve the issue. From checking pod logs and configurations to verifying resource limits and reviewing application code, each step brings you closer to a solution.

Remember, maintaining a stable and healthy Kubernetes environment requires regular monitoring, proper configuration, and a good understanding of the underlying causes of common errors like CrashLoopBackOff. With these best practices, you can minimize downtime and keep your applications running smoothly.

By following this guide, you’ll be well-equipped to handle CrashLoopBackOff errors and ensure the reliability of your Kubernetes deployments. Thank you for reading the DevopsRoles page!

How to Resolve Kubernetes Node Not Ready Issue A Comprehensive Guide

Introduction

Kubernetes is a powerful orchestration tool that automates the deployment, scaling, and management of containerized applications. However, one of the most common issues faced by Kubernetes administrators is the “Node Not Ready” error. When a node in your Kubernetes cluster becomes unresponsive or displays a “Node Not Ready” status, it can lead to application downtime and operational inefficiencies.

In this guide, we will explore the causes behind the “Node Not Ready” issue, provide a detailed step-by-step troubleshooting process, and offer best practices to prevent this problem from recurring. Whether you’re a beginner or an experienced Kubernetes administrator, this article will equip you with the knowledge to tackle this issue effectively.

What Does Node Not Ready in Kubernetes Mean?

When a Kubernetes node is marked as “Not Ready,” it means that the node is not functioning correctly and cannot run any pods. This status indicates that the node is not meeting the requirements set by the Kubernetes control plane for running workloads. As a result, the cluster scheduler will avoid placing new pods on that node until the issue is resolved.

The “Node Not Ready” status can be caused by several factors, including:

  1. Network Connectivity Issues: The node may have lost connectivity to the Kubernetes API server.
  2. Resource Exhaustion: The node may be running out of essential resources like CPU, memory, or disk space.
  3. Node Component Failures: Core components like kubelet, docker, or the container runtime may have failed.
  4. Misconfiguration: Incorrect configuration settings can cause nodes to fail to join the cluster or report their status incorrectly.

Troubleshooting the Kubernetes Node Not Ready Issue

Resolving the “Node Not Ready” issue requires a systematic approach to identify and address the root cause. Below are the steps you should follow:

1. Check Node Status and Events

The first step is to gather information about the affected node. Use the following commands to check the node’s status and view recent events:

kubectl get nodes
kubectl describe node <node-name>

The kubectl get nodes command will list all the nodes in your cluster along with their status. The kubectl describe node <node-name> command will provide detailed information about the specific node, including recent events that might indicate why the node is marked as “Not Ready.”

2. Verify Network Connectivity

Network issues are a common cause of the “Node Not Ready” status. Ensure that the node has proper connectivity to the Kubernetes API server and other nodes in the cluster.

Steps to Verify Network Connectivity:

  • Ping the API Server: Check if the node can reach the Kubernetes API server by using the ping command.
  • Check DNS Resolution: Ensure that the node can resolve DNS names correctly.
  • Review Network Policies: Examine any network policies that might be blocking communication between nodes.

3. Inspect Resource Utilization

Resource exhaustion can lead to nodes being marked as “Not Ready.” Use the following commands to check the node’s resource usage:

kubectl top node <node-name>

This command will display the node’s CPU and memory usage. If the node is running low on resources, consider scaling up the cluster or redistributing workloads to other nodes.

Subsection: Analyzing Disk Space

Disk space issues are another common reason for nodes becoming “Not Ready.” Check the available disk space on the node:

df -h

If the disk is full, you may need to clean up unnecessary files or expand the disk.

4. Review Node Components

The core components of a Kubernetes node, such as kubelet, docker, and the container runtime, must be running correctly for the node to be considered “Ready.” Check the status of these components:

systemctl status kubelet
systemctl status docker

If any of these services are not running, try restarting them:

sudo systemctl restart kubelet
sudo systemctl restart docker

Additionally, check the logs for any errors:

journalctl -u kubelet
journalctl -u docker

5. Validate Node Configuration

Misconfigurations can prevent nodes from functioning correctly. Verify the node’s configuration files, such as /etc/kubernetes/kubelet.conf and /var/lib/kubelet/config.yaml. Ensure that the node is correctly configured to join the cluster and communicate with the API server.

Subsection: Checking Node Labels and Taints

Node labels and taints control pod placement. Ensure that the node’s labels and taints are configured correctly:

kubectl get nodes --show-labels
kubectl describe node <node-name> | grep Taints

If the node has incorrect labels or taints, you may need to update them using kubectl label or kubectl taint commands.

6. Investigate Cluster-Wide Issues

In some cases, the “Node Not Ready” issue might be caused by cluster-wide problems, such as issues with the control plane or network overlay. Check the health of your control plane components:

kubectl get componentstatuses

If any of the control plane components are unhealthy, investigate further by checking their logs and configurations.

7. Reboot the Node

As a last resort, you can try rebooting the node. This can sometimes resolve transient issues that are difficult to diagnose. However, be cautious when rebooting a node, especially in a production environment.

Best Practices to Prevent “Node Not Ready” Issues

Preventing the “Node Not Ready” issue requires proactive monitoring and management of your Kubernetes cluster. Here are some best practices to help you avoid this problem:

1. Regular Monitoring and Alerts

Set up monitoring tools like Prometheus and Grafana to keep an eye on your cluster’s health. Configure alerts to notify you of any potential issues before they escalate.

2. Resource Management

Implement resource quotas and limits to ensure that no single workload can exhaust the resources of a node. This helps maintain cluster stability.

3. Node Auto-Scaling

Use Kubernetes’ Cluster Autoscaler to automatically scale your cluster based on resource demands. This ensures that you always have enough capacity to handle your workloads.

4. Scheduled Maintenance

Regularly perform maintenance tasks, such as cleaning up old logs and rotating certificates, to keep your nodes running smoothly.

5. Network Redundancy

Implement network redundancy and failover mechanisms to ensure that your nodes can always communicate with the Kubernetes control plane.

Frequently Asked Questions (FAQs)

What should I do if a Kubernetes node remains “Not Ready” after troubleshooting?

If a node remains “Not Ready” after following the troubleshooting steps, you may need to consider removing the node from the cluster and rejoining it. This can help resolve issues related to corrupted configuration files or persistent resource exhaustion.

Can the “Node Not Ready” issue cause downtime for my applications?

Yes, if a node becomes “Not Ready” and was running critical workloads, those applications might experience downtime until they are rescheduled on a different node. Ensuring high availability and redundancy in your cluster can mitigate this risk.

How can I check the logs of a node that is marked as “Not Ready”?

You can use the journalctl command to view the logs of the kubelet and docker services on the node. Additionally, you can use the kubectl describe node <node-name> command to check recent events and logs associated with the node.

Conclusion

The “Node Not Ready” issue in Kubernetes is a common problem that can disrupt your cluster’s operations. By following the steps outlined in this guide, you can effectively diagnose and resolve the underlying causes of this issue. Remember to implement best practices, such as regular monitoring and resource management, to prevent this problem from occurring in the future.

By mastering these troubleshooting techniques, you’ll be better equipped to maintain a healthy and reliable Kubernetes environment. If you encounter persistent issues, consider seeking support from the Kubernetes community or professional services to ensure your cluster remains robust and resilient.

This guide has provided you with a comprehensive approach to resolving the Node Not Ready issue in Kubernetes. By following these best practices, you’ll minimize downtime, ensure smooth operations, and maintain the reliability of your containerized applications. Thank you for reading the DevopsRoles page!

Fix Pods Stuck in Pending State in Kubernetes

Introduction

In Kubernetes, a common issue that administrators encounter is when Pods Stuck in Pending State error. This state indicates that the pod cannot be scheduled onto a node, often due to resource constraints or misconfigurations. Resolving this issue is crucial for maintaining the availability and performance of your applications.

In this guide, we’ll explore the reasons why pods might be stuck in the Pending state and provide step-by-step instructions on how to fix this issue. We’ll cover both basic troubleshooting steps and more advanced configurations.

Understanding the Pending State in Kubernetes

What is the Pending State?

In Kubernetes, a pod remains in the Pending state until it is successfully scheduled on a node. The scheduling process involves finding a suitable node that meets the pod’s resource requirements and constraints. If no suitable node is available, the pod remains in the Pending state.

Common Causes of Pods Stuck in Pending State in Kubernetes

  1. Insufficient Resources: The most common cause of pods being stuck in Pending is a lack of resources (CPU, memory, etc.) on the available nodes.
  2. Node Selectors and Taints: If a pod has specific node selectors or the nodes have taints that prevent the pod from being scheduled, it will remain in Pending.
  3. Persistent Volume Claims (PVCs): If a pod requires a PVC and the storage class is not available, the pod may be stuck in Pending.
  4. Pod Quotas: Resource quotas at the namespace level may prevent new pods from being scheduled.

Basic Troubleshooting Steps

1. Check Resource Availability

First, verify if there are sufficient resources available on the nodes for the pod.

kubectl describe pod <pod-name> -n <namespace>

Look for the Events section at the bottom of the output. If you see messages like “Insufficient CPU” or “Insufficient memory,” this indicates that there are not enough resources available.

2. Inspect Node Selectors and Taints

Review the pod’s specifications to ensure that node selectors or tolerations are configured correctly.

kubectl describe pod <pod-name> -n <namespace> | grep -i "nodeSelector\|tolerations"

Check the nodes to see if they match the pod’s node selector or if there are any taints that might prevent scheduling.

kubectl describe node <node-name> | grep -i "taints"

3. Verify Persistent Volume Claims

If your pod is using a Persistent Volume Claim (PVC), ensure that the PVC is correctly bound and that the storage class is available.

kubectl get pvc -n <namespace>
kubectl describe pvc <pvc-name> -n <namespace>

If the PVC status is Pending, the pod will not be scheduled.

4. Check Resource Quotas

Ensure that your namespace has not exceeded its resource quotas, which could prevent new pods from being scheduled.

kubectl describe quota -n <namespace>

Advanced Troubleshooting

1. Resource Requests and Limits

Ensure that the pod’s resource requests and limits are realistic. Over-provisioning resources can lead to pods being stuck in Pending because Kubernetes cannot find a node that meets the excessive requirements.

resources:
  requests:
    memory: "64Mi"
    cpu: "250m"
  limits:
    memory: "128Mi"
    cpu: "500m"

2. Cluster Autoscaler

If your cluster frequently experiences resource shortages, consider enabling the Cluster Autoscaler. This tool automatically adds nodes to your cluster when resources are insufficient to meet pod scheduling demands.

kubectl get deployment -n kube-system cluster-autoscaler

3. Preemption and Priorities

Kubernetes allows configuring priorities for pods. If your important pods are stuck in Pending, consider using preemption to evict lower-priority pods and free up resources.

priorityClassName: high-priority

4. Custom Scheduling Constraints

For complex scenarios, you might need to define custom scheduling constraints using affinity and anti-affinity rules.

affinity:
  nodeAffinity:
    requiredDuringSchedulingIgnoredDuringExecution:
      nodeSelectorTerms:
      - matchExpressions:
        - key: kubernetes.io/e2e-az-name
          operator: In
          values:
          - e2e-az1

Frequently Asked Questions

1. How do I know if my pod is stuck due to resource constraints?

Use the kubectl describe pod <pod-name> command to check the Events section. Look for messages indicating “Insufficient CPU” or “Insufficient memory.”

2. Can I manually assign a pod to a node?

Yes, you can use nodeName in your pod spec to manually assign a pod to a specific node, though this is generally not recommended as it bypasses Kubernetes’ scheduling logic.

3. What is a PVC and how does it affect pod scheduling?

A PVC is a request for storage by a pod. If the requested storage is not available, the pod will remain in Pending until the storage is allocated.

4. What happens if a node fails after a pod is scheduled?

Kubernetes will automatically attempt to reschedule the pod on a different node if the original node becomes unavailable.

Conclusion

Dealing with pods stuck in the Pending state is a common challenge in Kubernetes. By following the steps outlined in this guide, you can effectively troubleshoot and resolve the underlying issues, ensuring that your pods are scheduled and your applications run smoothly. Whether you’re facing resource shortages, misconfigurations, or advanced scheduling constraints, the solutions provided here will help you get your Kubernetes cluster back on track.

Remember, maintaining a healthy Kubernetes environment requires ongoing monitoring and adjustments as your workloads and infrastructure evolve. Stay proactive, and you’ll minimize the chances of encountering pods stuck in the Pending state.

This guide should serve as a comprehensive resource for fixing pods stuck in the Pending state in Kubernetes, addressing both common and advanced scenarios. The aim is to provide actionable insights that help Kubernetes administrators ensure smooth pod scheduling and overall cluster health. Thank you for reading the DevopsRoles page!