Introduction: Let me tell you a secret: building a reliable CI/CD Pipeline saved my sanity.
I still remember the absolute nightmare of manual deployments. It was a cold Friday night back in 2014.
The server crashed. Hard. We spent 12 agonizing hours rolling back broken code while management breathed down our necks.
That is exactly when I swore I would never deploy manually again. Automation became my utter obsession.
If you are still FTP-ing files or running bash scripts by hand, you are living in the stone age. It is time to evolve.
Why Every DevOps Engineer Needs a Solid CI/CD Pipeline
A properly configured CI/CD Pipeline is not just a luxury. It is a fundamental requirement for survival.
Think about the speed at which the market moves today. Your competitors are deploying features daily, sometimes hourly.
If your release cycle takes weeks, you are already dead in the water. Continuous Integration and Continuous Deployment fix this.
You push code. It gets tested automatically. It gets built automatically. It deploys itself. Magic.
But it’s not actually magic. It is just good engineering, relying on three titans of the industry: Docker, Jenkins, and Kubernetes.
If you want to read another fantastic perspective on this, check out this great breakdown on how DevOps engineers build these systems.
The Core Components of Your CI/CD Pipeline
Before we look at the code, you need to understand the architecture. Don’t just copy-paste; understand the why.
Our stack is simple but ruthlessly effective. We use Docker to package the app, Jenkins to automate the flow, and Kubernetes to run it.
This creates an immutable infrastructure. It runs exactly the same way on your laptop as it does in production.
No more “it works on my machine” excuses. Those days are over.
Let’s break down the phases of a modern CI/CD Pipeline.
Phase 1: Containerizing with Docker
Docker is step one. You cannot orchestrate what you haven’t isolated. Containers solve the dependency matrix from hell.
Instead of installing Node.js, Python, or Java directly on your server, you bundle the runtime with your code.
This is done using a Dockerfile. It’s simply a recipe for your application’s environment.
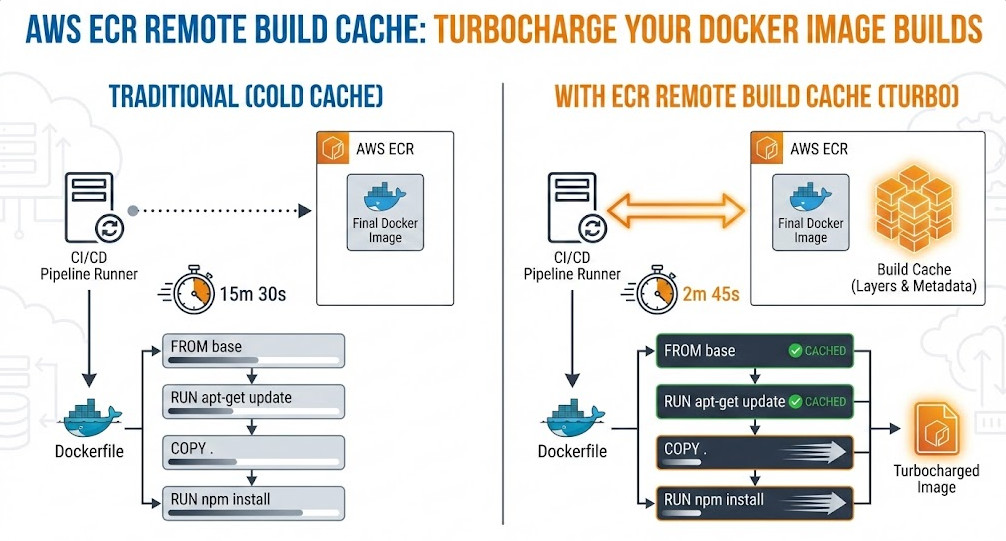
I always recommend multi-stage builds. They keep your images tiny and secure.
For more deep-dive strategies, check out our guide on [Internal Link: Advanced Docker Swarm Strategies].
Phase 2: Automating the CI/CD Pipeline with Jenkins
Jenkins is the grumpy old workhorse of the DevOps world. It isn’t pretty, but it gets the job done.
It acts as the traffic cop for your CI/CD Pipeline. It listens for GitHub webhooks and triggers the build.
We define our entire process in a Jenkinsfile. This is called Pipeline-as-Code.
Keeping your build logic in version control is non-negotiable. If your Jenkins server dies, you just spin up a new one and point it at your repo.
I highly suggest reading the official Jenkins Pipeline documentation to master the syntax.
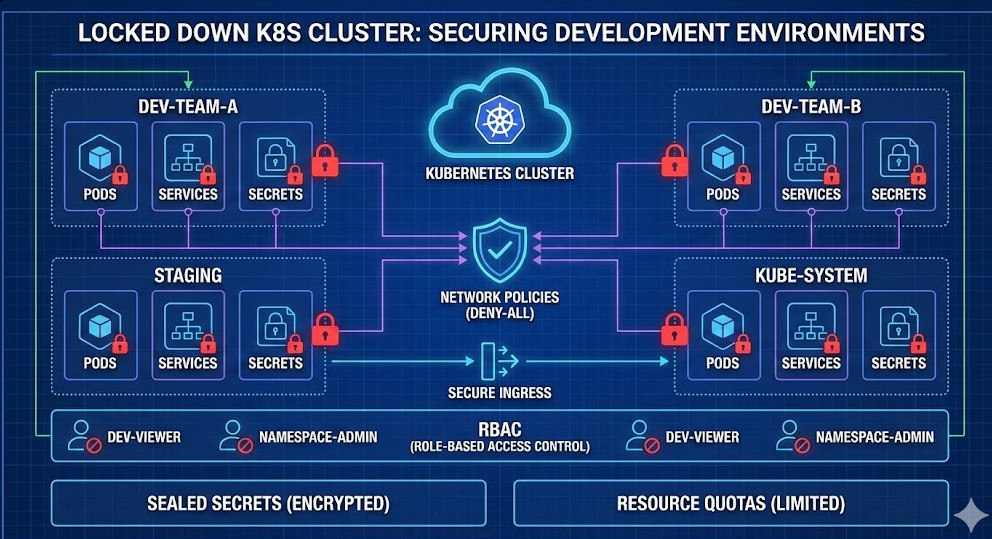
Phase 3: Orchestrating Deployments with Kubernetes
So, you have a Docker image, and Jenkins built it. Now where does it go? Enter Kubernetes (K8s).
Kubernetes is the captain of the ship. It takes your containers and ensures they are always running, no matter what.
If a node crashes, K8s restarts your pods on a healthy node. It handles load balancing, scaling, and self-healing.
It is insanely powerful, but it has a steep learning curve. Don’t let it intimidate you.
We manage K8s resources using YAML files. Yes, YAML engineering is a real job.
Writing the Code for Your CI/CD Pipeline
Enough theory. Let’s get our hands dirty. Here is exactly how I structure a standard Node.js microservice deployment.
First, we need our Dockerfile. Notice how clean and optimized this is.
# Use an alpine image for a tiny footprint
FROM node:18-alpine AS builder

WORKDIR /app

# Install dependencies first for layer caching
COPY package*.json ./
RUN npm ci

# Copy the rest of the code
COPY . .

# Build the project
RUN npm run build

# Stage 2: Production environment
FROM node:18-alpine

WORKDIR /app
COPY --from=builder /app/dist ./dist
COPY --from=builder /app/node_modules ./node_modules

EXPOSE 3000
CMD ["node", "dist/index.js"]
This multi-stage build drops my image size from 1GB to about 150MB. Speed matters in a CI/CD Pipeline.
Next up is the Jenkinsfile. This tells Jenkins exactly what to do when a developer pushes code to the main branch.
pipeline {
    agent any

    environment {
        DOCKER_IMAGE = "myrepo/myapp:${env.BUILD_ID}"
        DOCKER_CREDS = credentials('docker-hub-credentials')
    }

    stages {
        stage('Checkout') {
            steps {
                checkout scm
            }
        }

        stage('Build Image') {
            steps {
                sh "docker build -t ${DOCKER_IMAGE} ."
            }
        }

        stage('Push Image') {
            steps {
                sh "echo ${DOCKER_CREDS_PSW} | docker login -u ${DOCKER_CREDS_USR} --password-stdin"
                sh "docker push ${DOCKER_IMAGE}"
            }
        }

        stage('Deploy to K8s') {
            steps {
                sh "sed -i 's|IMAGE_TAG|${DOCKER_IMAGE}|g' k8s/deployment.yaml"
                sh "kubectl apply -f k8s/deployment.yaml"
            }
        }
    }
}
Look at that ‘Deploy to K8s’ stage. We use sed to dynamically inject the new Docker image tag into our Kubernetes manifests.
It is a quick, dirty, and incredibly reliable trick I’ve used for years.
Finally, we need our Kubernetes configuration. This deployment.yaml file tells K8s how to run our new image.
apiVersion: apps/v1
kind: Deployment
metadata:
  name: myapp-deployment
  labels:
    app: myapp
spec:
  replicas: 3
  selector:
    matchLabels:
      app: myapp
  template:
    metadata:
      labels:
        app: myapp
    spec:
      containers:
      - name: myapp-container
        image: IMAGE_TAG # This gets replaced by Jenkins!
        ports:
        - containerPort: 3000
        resources:
          requests:
            memory: "128Mi"
            cpu: "250m"
          limits:
            memory: "256Mi"
            cpu: "500m"
I always include resource limits. Always. If you don’t, a memory leak in one pod will crash your entire Kubernetes node.
I learned that the hard way during a Black Friday traffic spike. Never again.
Common Pitfalls in CI/CD Pipeline Implementation
Building a CI/CD Pipeline isn’t all sunshine and rainbows. Things will break.
The most common mistake I see juniors make is ignoring security. Never hardcode passwords in your Jenkinsfile.
Use Jenkins Credentials binding or a secrets manager like HashiCorp Vault.
Another major issue is brittle tests. If your integration tests fail randomly due to network timeouts, developers will stop trusting the pipeline.
They will start bypassing it. Once they do that, your pipeline is completely useless.
Make your tests fast. Make them deterministic. If a test is flaky, delete it or fix it immediately.
You can read more about Kubernetes security contexts in the official K8s documentation.


FAQ Section
- What is the main benefit of a CI/CD Pipeline?
Speed and reliability. It removes human error from deployments and allows teams to ship features to production multiple times a day safely. - Do I really need Kubernetes?
Not always. If you are running a simple blog, a single VPS is fine. K8s is for scalable, highly available microservices architectures. Don’t overengineer if you don’t have to. - Is Jenkins outdated?
It’s old, but it’s not outdated. While tools like GitHub Actions and GitLab CI are trendier, Jenkins still runs a massive percentage of enterprise infrastructure due to its endless plugin ecosystem. - How do I handle database migrations in a CI/CD Pipeline?
This is tricky. Usually, we run a separate step in Jenkins using tools like Flyway or Liquibase before deploying the new application code. Backward compatibility is strictly required.
Conclusion: Setting up your first CI/CD Pipeline takes time, frustration, and a lot of reading logs. But once it clicks, it changes your engineering culture forever. You go from fearing deployments to celebrating them. Stop clicking buttons. Start writing pipelines. Thank you for reading the DevopsRoles page!