In this tutorial, we will build lambda with a custom docker image.
Prerequisites
Before starting, you should have the following prerequisites configured
An AWS account
AWS CLI on your computer
Walkthrough
Create a Python virtual environment
Create a Python app
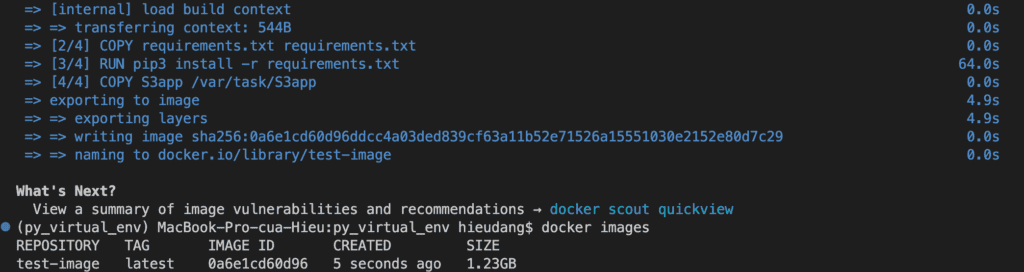
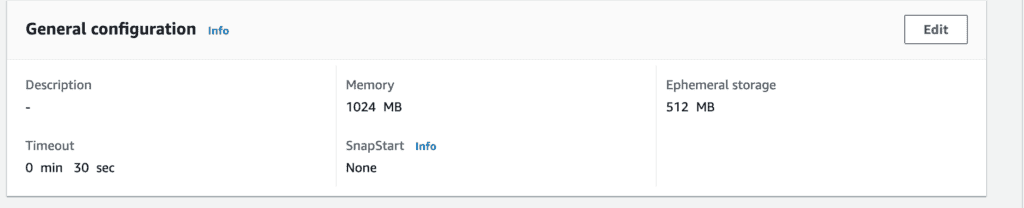
Create a lambda with a custom docker image of ECR
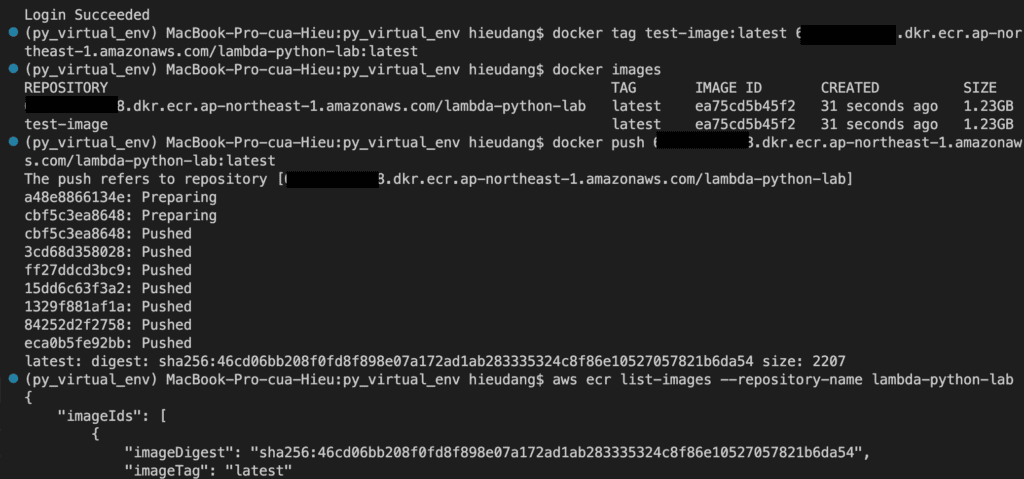
Create ECR repositories and push an image
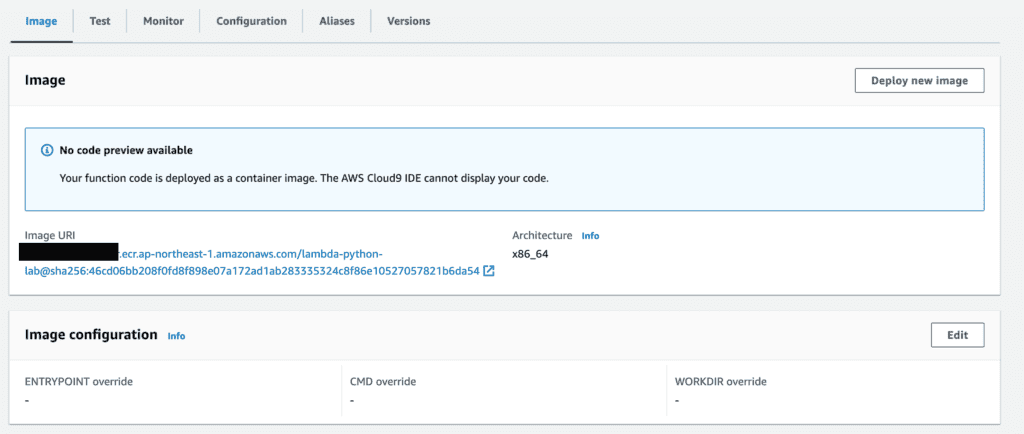
Create a lamba from the ECR image
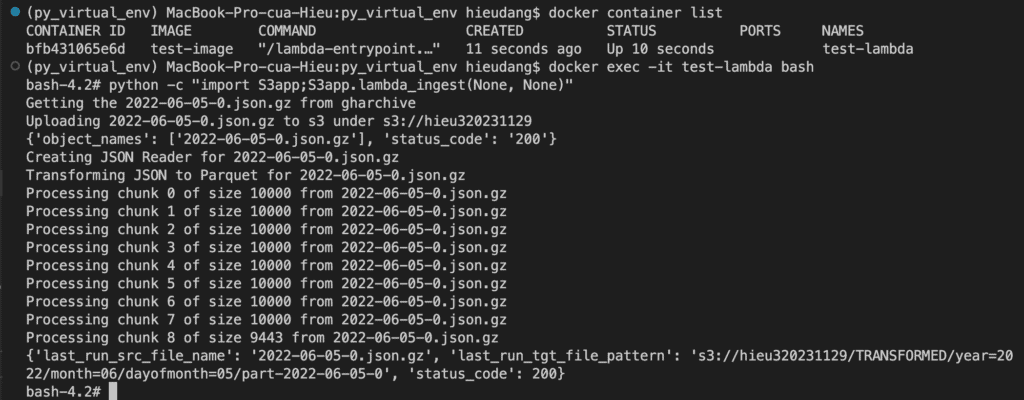
Test lambda function on local
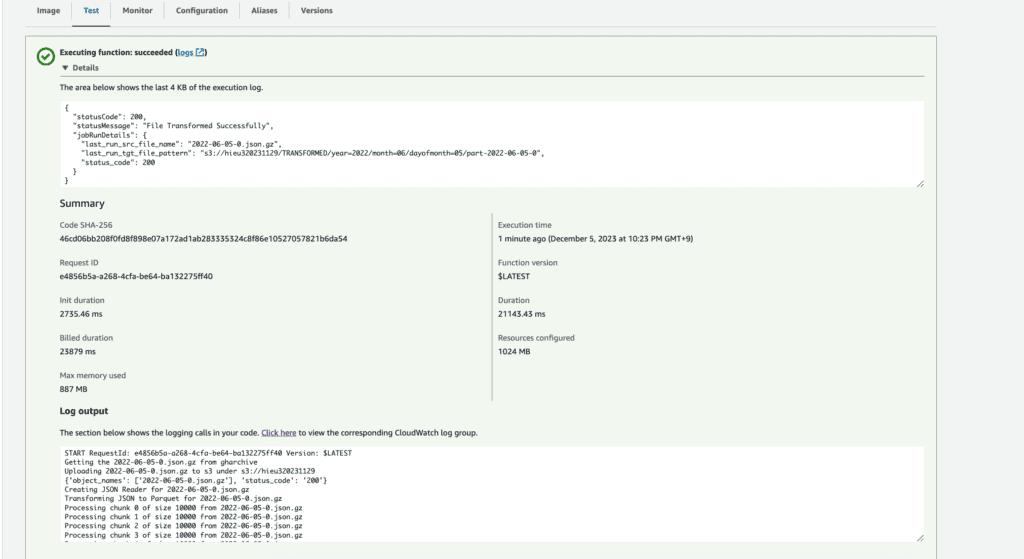
Test lambda function on AWS
Create a Python virtual environment
Create a Python virtual environment with the name py_virtual_env
python3 -m venv py_virtual_env
Create a Python app
This Python source code will pull a JSON file from https://data.gharchive.org and put it into the S3 bucket. Then, transform the uploaded file to parquet format.
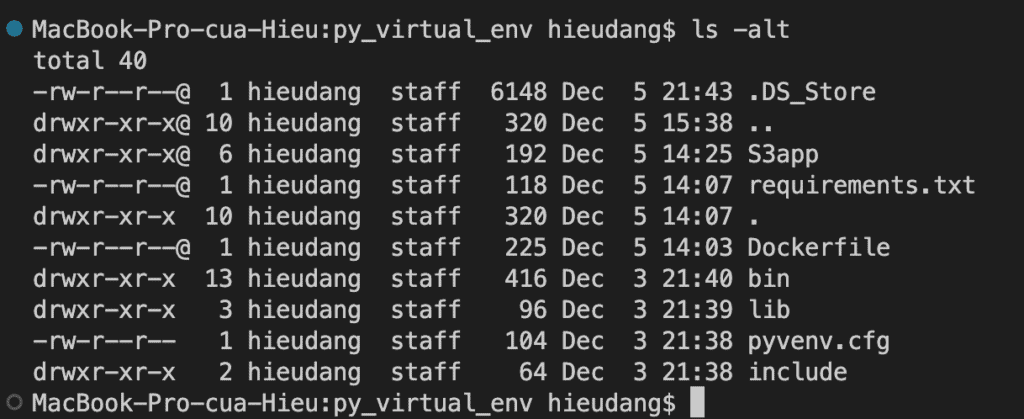
Download the source code from here and put it into the py_virtual_env folder.
These steps provide an example of creating a lambda function and running it on docker, then, we put the docker image in the ECR repository, and create a lambda function from the ECR repository. The specific configuration details may vary depending on your environment and setup. It’s recommended to consult the relevant documentation from AWS for detailed instructions on setting up. I hope will this be helpful. Thank you for reading the DevopsRoles page!
In this tutorial, you will create an Amazon DocumentDB cluster. Operations on the cluster using CLI commands using CLI commands. For more information about Amazon DocumentDB, see Amazon DocumentDB Developer Guide.
Prerequisites
Before starting, you should have the following prerequisites configured
An AWS account
AWS CLI on your computer
Amazon DocumentDB tutorial
Create an Amazon DocumentDB cluster using AWS CLI
Adding an Amazon DocumentDB instance to a cluster using AWS CLI
Describing Clusters and Instances using AWS CLI
Install the mongo shell on MacOS
Connecting to Amazon DocumentDB
Performing Amazon DocumentDB CRUD operations using Mongo Shell
Performing Amazon DocumentDB CRUD operations using python
Adding a Replica to an Amazon DocumentDB Cluster using AWS CLI
Amazon DocumentDB High Availability Failover using AWS CLI
Creating an Amazon DocumentDB global cluster using AWS CLI
Delete an Instance from a Cluster using AWS CLI
Delete an Amazon DocumentDB global cluster using AWS CLI
Removing Global Clusters using AWS CLI
Create an Amazon DocumentDB cluster using AWS CLI
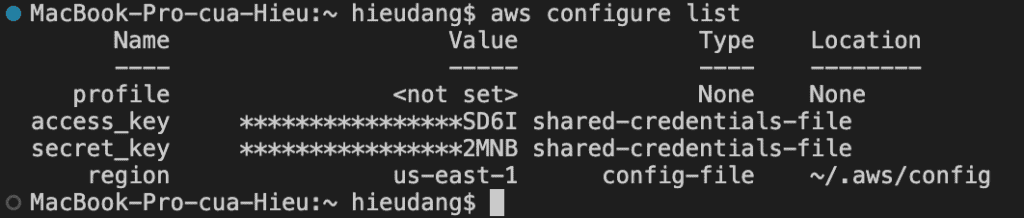
Before you begin, If you have not installed the AWS CLI, see Setting up the Amazon Redshift CLI. This tutorial uses the us-east-1 region.
Now we’re ready to launch a Amazon DocumentDB cluster by using the AWS CLI.
An Amazon DocumentDB cluster consists of instances and a cluster volume that represents the data for the cluster. The cluster volume is replicated six ways across three Availability Zones as a single, virtual volume. The cluster contains a primary instance and, optionally, up to 15 replica instances.
The following sections show how to create an Amazon DocumentDB cluster using the AWS CLI. You can then add additional replica instances for that cluster.
When you use the console to create your Amazon DocumentDB cluster, a primary instance is automatically created for you at the same time.
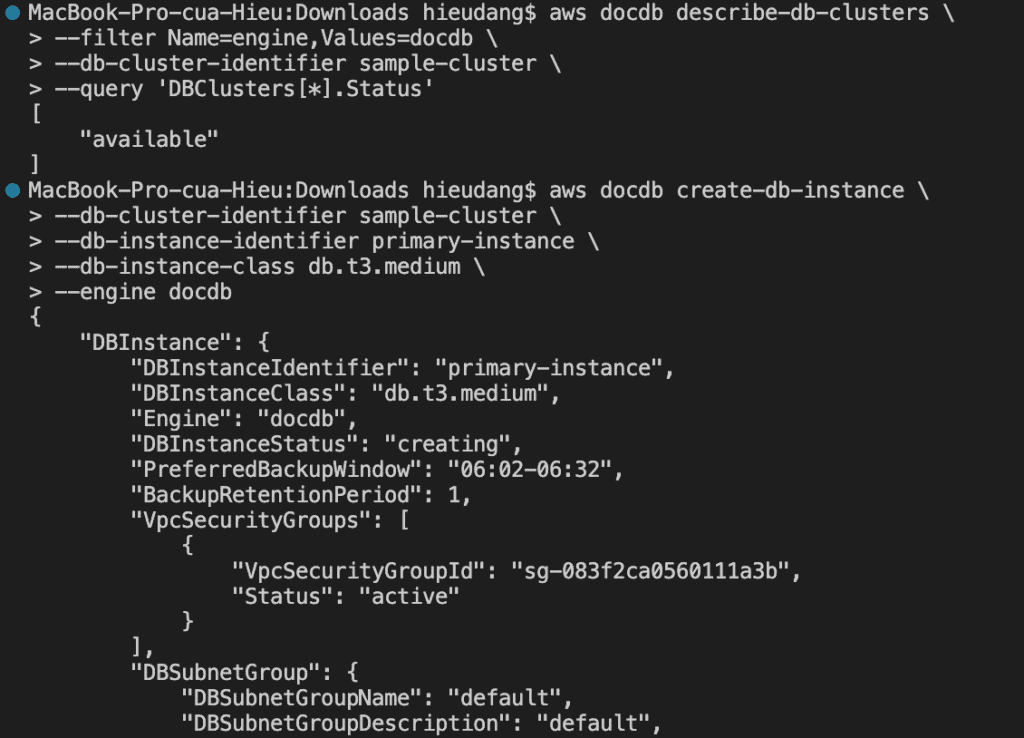
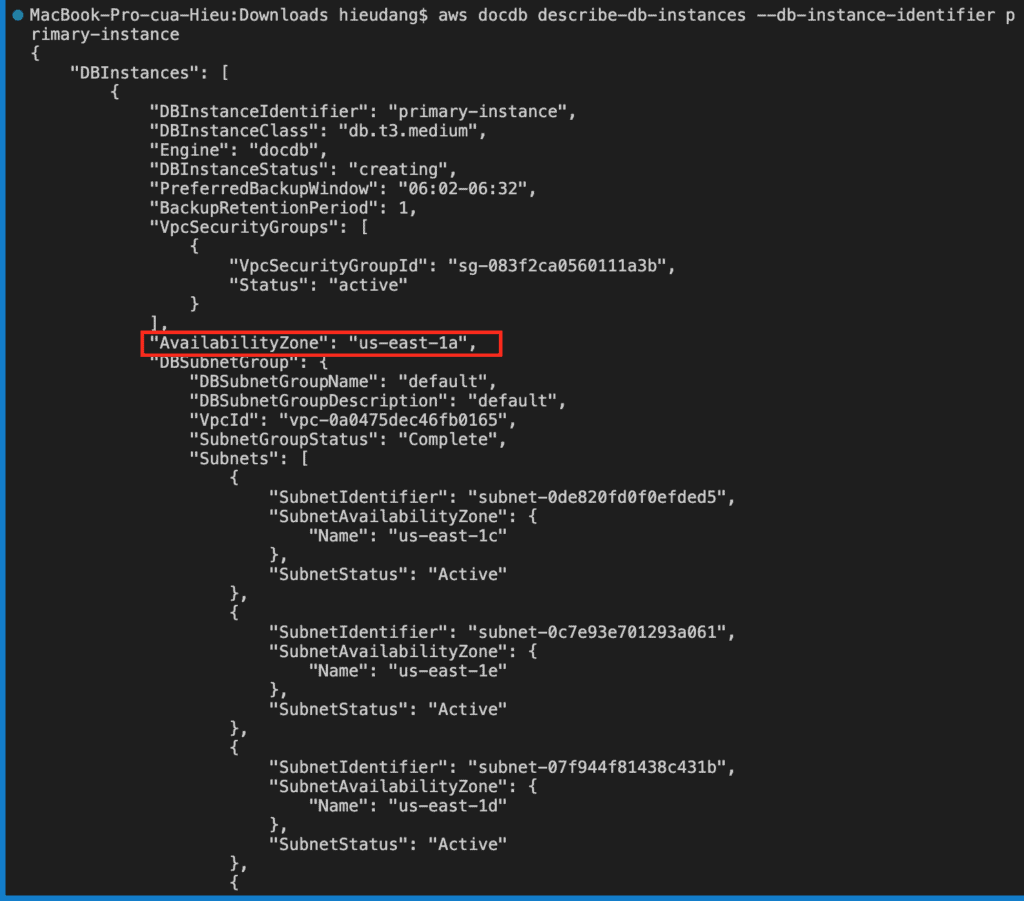
When you use the AWS CLI to create your Amazon DocumentDB cluster, after the cluster’s status is available, you must then create the primary instance for that cluster.
The following procedures describe how to use the AWS CLI to launch an Amazon DocumentDB cluster and create an Amazon DocumentDB replica.
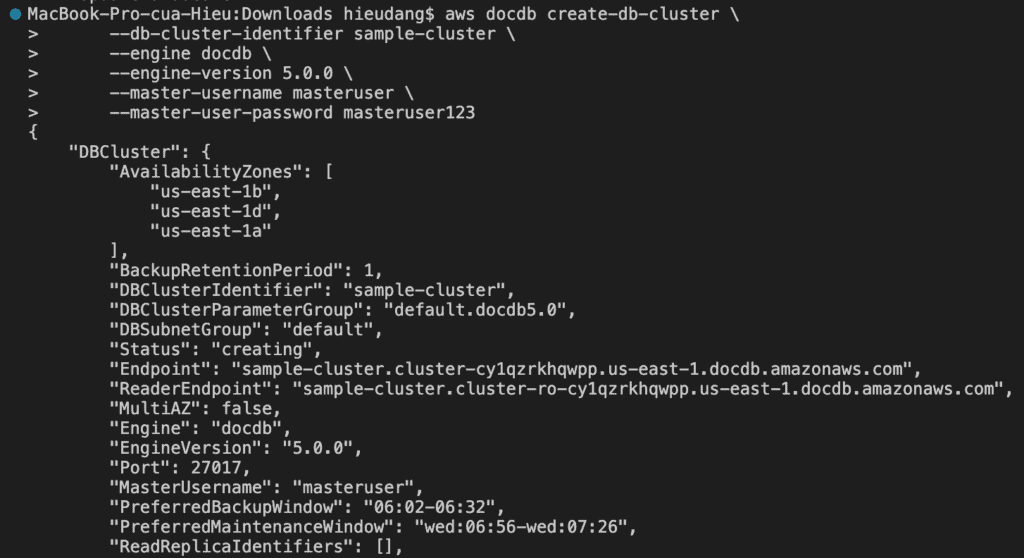
To create an Amazon DocumentDB cluster, call the create-db-cluster AWS CLI.
The db-subnet-group-name or vpc-security-group-id parameter is not specified, Amazon DocumentDB will use the default subnet group and Amazon VPC security group for the given region.
This command returns the following result.
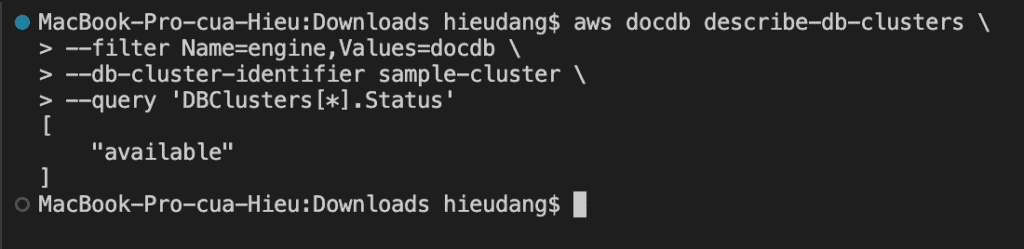
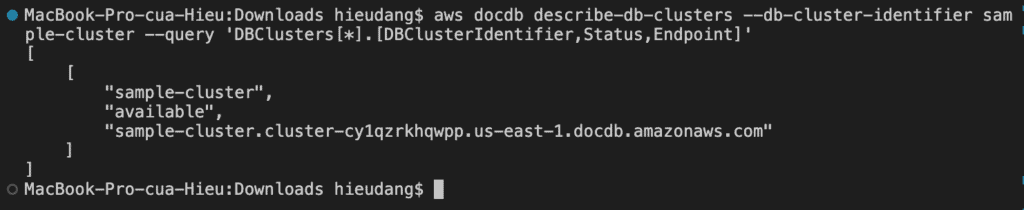
It takes several minutes to create the cluster. You can use the following AWS CLI to monitor the status of your cluster.
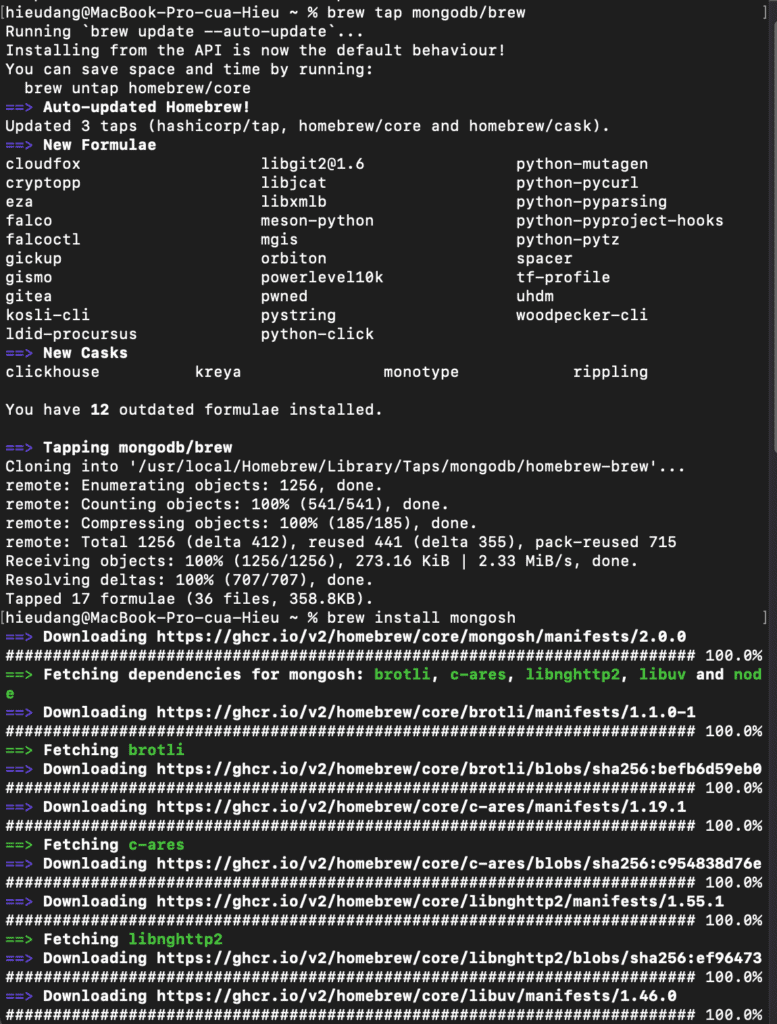
Install the mongo shell with the following command:
brew tap mongodb/brew
brew install mongosh
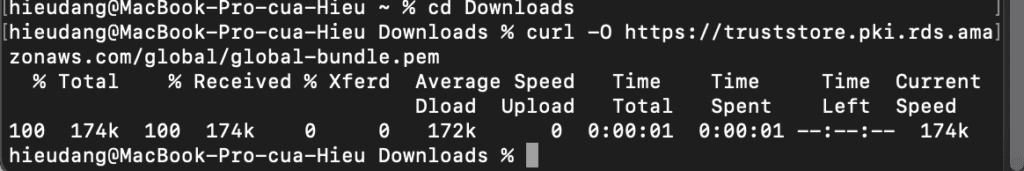
To encrypt data in transit, download the public key for Amazon DocumentDB. The following command downloads a file named global-bundle.pem:
cd Downloads
curl -O https://truststore.pki.rds.amazonaws.com/global/global-bundle.pem
You must explicitly grant inbound access to your client in order to connect to the cluster. When you created a cluster in the previous step, because you did not specify a security group, you associated the default cluster security group with the cluster.
The default cluster security group contains no rules to authorize any inbound traffic to the cluster. To access the new cluster, you must add rules for inbound traffic, which are called ingress rules, to the cluster security group. If you are accessing your cluster from the Internet, you will need to authorize a Classless Inter-Domain Routing IP (CIDR/IP) address range.
Run the following command to enable your computer to connect to your Redshift cluster. Then login into your cluster using mongo shell.
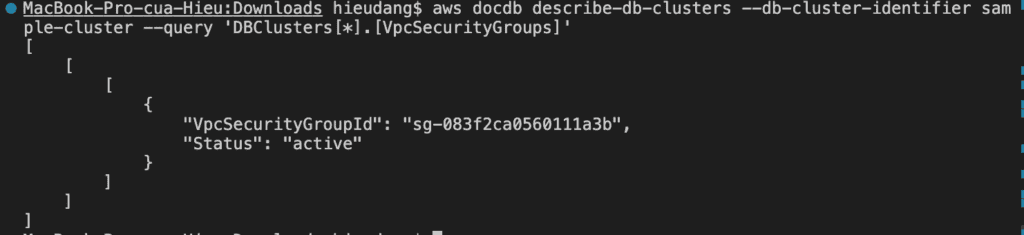
#get VpcSecurityGroupId
aws docdb describe-clusters --cluster-identifier sample-cluster --query 'DBClusters[*].[VpcSecurityGroups]'
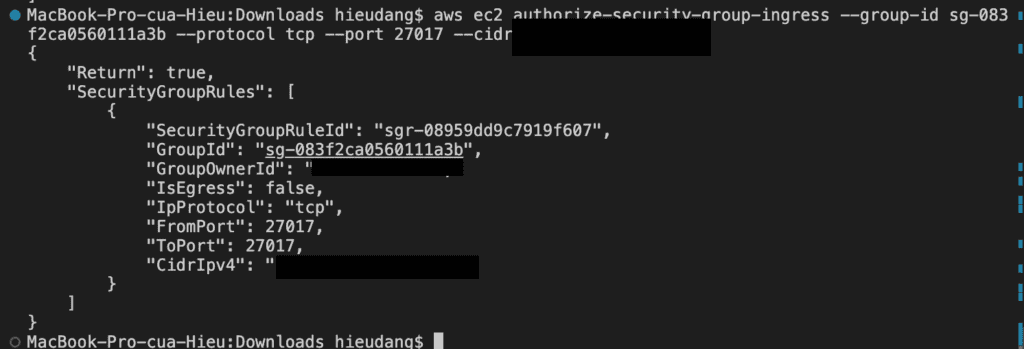
#allow connect to DocumentDB cluster from my computer
aws ec2 authorize-security-group-ingress --group-id sg-083f2ca0560111a3b --protocol tcp --port 27017 --cidr 111.111.111.111/32
This command returns the following result.
Connecting to Amazon DocumentDB
Run the following command to connect the Amazon DocumentDB cluster
Use the below command to view the available databases in the your Amazon DocumentDB cluster
show dbs
Performing Amazon DocumentDB CRUD operations using Mongo Shell
MongoDB database concepts:
A record in MongoDB is a document, which is a data structure composed of field and value pairs, similar to JSON objects. The value of a field can include other documents, arrays, and arrays of documents. A document is roughly equivalent to a row in a relational database table.
A collection in MongoDB is a group of documents, and is roughly equivalent to a relational database table.
A database in MongoDB is a group of collections, and is similar to a relational database with a group of related tables.
To show current database name
db
To create a database in Amazon DocumentDB, execute the use command, specifying a database name. Create a new database called docdbdemo.
use docdbdemo
When you create a new database in Amazon DocumentDB, there are no collections created for you. You can see this on your cluster by running the following command.
show collections
Creating Documents
You will now insert a document to a new collection called products in your docdbdemo database using the below query.
db.products.insert({
  "name":"java cookbook",
  "sku":"222222",
  "description":"Problems and Solutions for Java Developers",
  "price":200
})
You should see output that looks like this
You can insert multiple documents in a single batch to bulk load products. Use the insertMany command below.
db.products.insertMany([
{
  "name":"Python3 boto",
  "sku":"222223",
  "description":"basic boto3 and python for everyone",
  "price":100
},
{
  "name":"C# Programmer's Handbook",
  "sku":"222224",
  "description":"complete coverage of features of C#",
  "price":100
}
])
Reading Documents
Use the below query to read data inserted to Amazon DocumentDB. The find command takes a filter criteria and returns the document matching the criteria. The pretty command is appended to display the results in an easy-to-read format.
db.products.find({"sku":"222223"}).pretty()
The matched document is returned as the output of the above query.
Use the find() command to return all the documents in the profiles collection. Input the following:
db.products.find().pretty()
Updating Documents
You will now update a document to add reviews using the $set operator with the update command. Reviews is a new array containing review and rating fields.
Amazon DocumentDB High Availability Failover using AWS CLI
A failover for a cluster promotes one of the Amazon DocumentDB replicas (read-only instances) in the cluster to be the primary instance (the cluster writer).When the primary instance fails, Amazon DocumentDB automatically fails over to an Amazon DocumentDB replica
The following operation forces a failover of the sample-cluster cluster.
Creating an Amazon DocumentDB global cluster using AWS CLI
To create an Amazon DocumentDB regional cluster, call the create-db-clusterAWS CLI. The following AWS CLI command creates an Amazon DocumentDB cluster named global-cluster-id
To delete a global cluster, run the delete-global-cluster CLI command with the name of the AWS Region and the global cluster identifier, as shown in the following example.
These steps provide an example to manage Amazon DocumentDB cluster. The specific configuration details may vary depending on your environment and setup. It’s recommended to consult the relevant documentation from AWS for detailed instructions on setting up. I hope will this your helpful. Thank you for reading the DevopsRoles page!
In this tutorial, we will create an AWS Lambda function with requests module. Then create a .zip deployment package containing the dependencies.
Prerequisites
Before starting, you should have the following prerequisites configured
An AWS account
AWS CLI on your computer
Walkthrough
Create the deployment package
Create AWS Lambda function with requests module
Create the deployment package
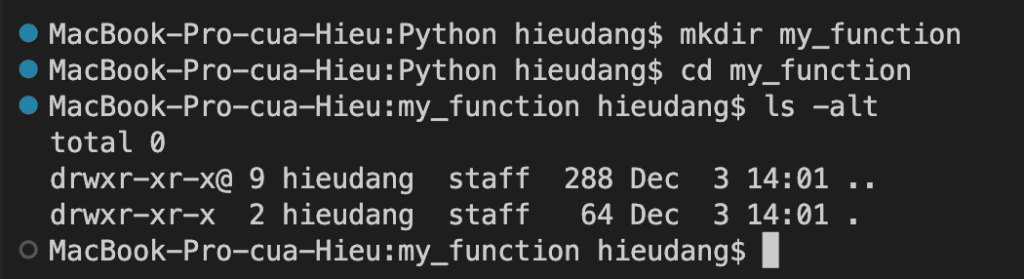
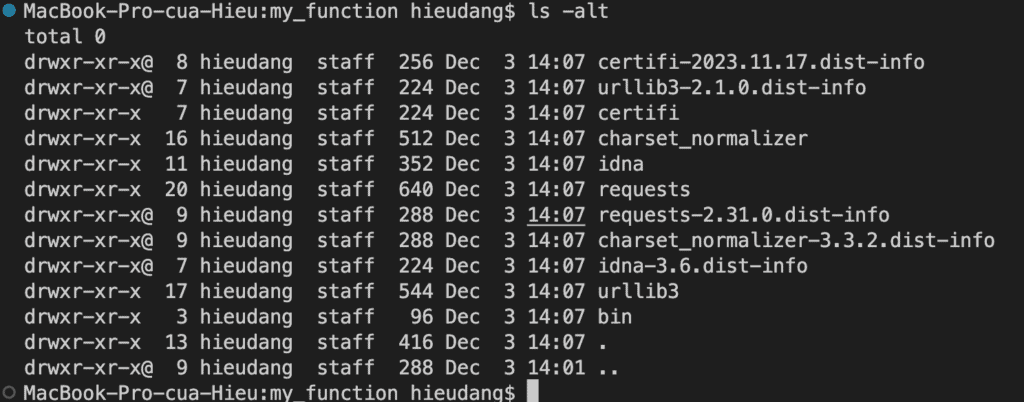
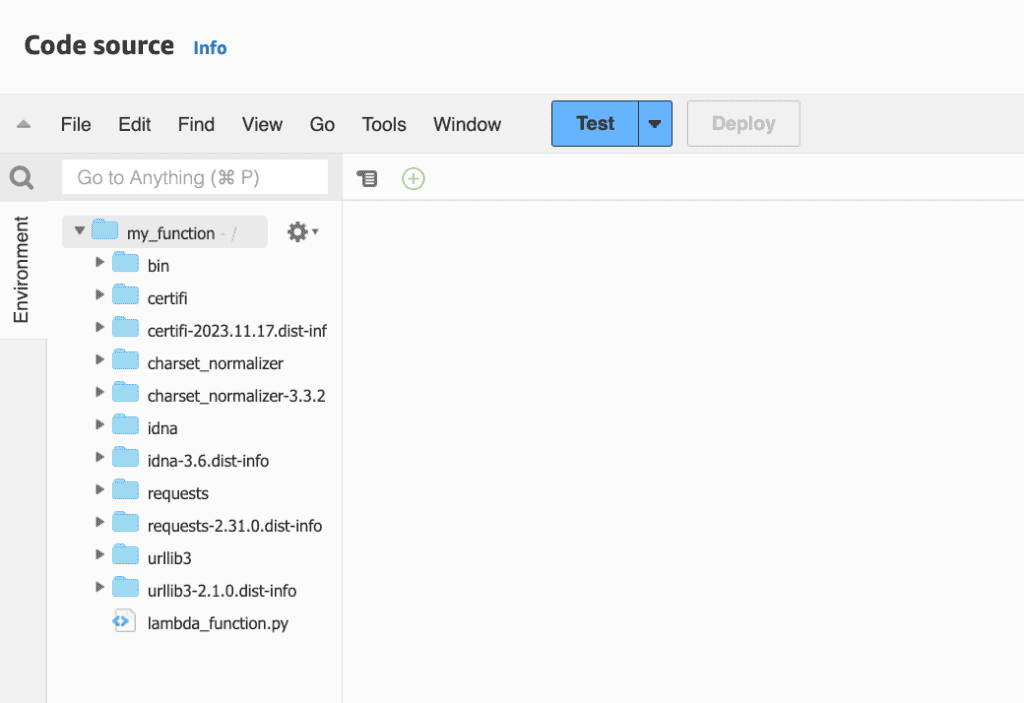
Navigate to the project directory containing your lambda_function.py source code file. In this example, the directory is named my_function.
mkdir my_function
cd my_function
ls -alt
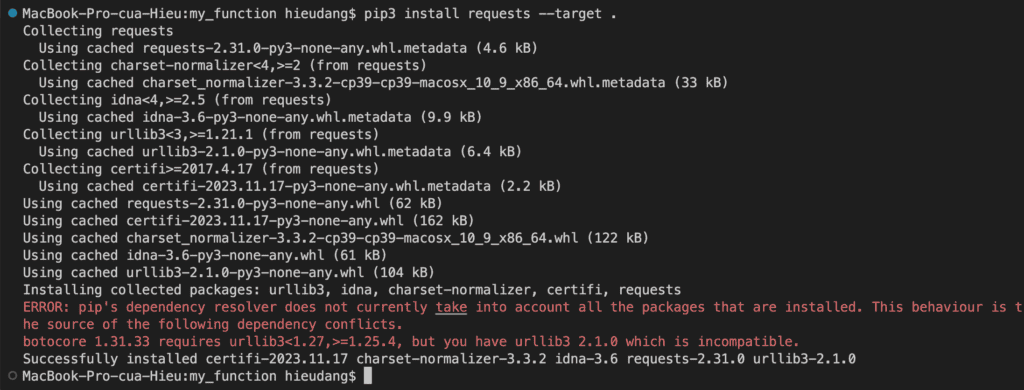
Install “requests” dependencies in the my_function directory.
pip3 install requests --target .
Create lambda_function.py source code file. This sample uses region_name=”ap-northeast-1″.(Tokyo region)
import boto3
import requests
def lambda_handler(event, context):
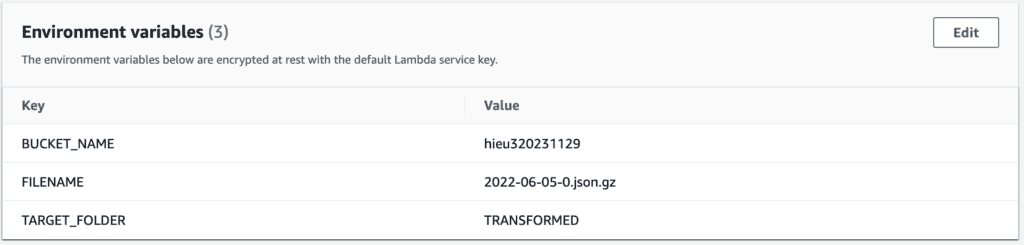
file_name = "2023-11-26-0.json.gz"
bucket_name = "hieu320231129"
print(f'Getting the {file_name} from gharchive')
res = requests.get(f'https://data.gharchive.org/{file_name}')
print(f'Uploading {file_name} to s3 under s3://{bucket_name}')
s3_client = boto3.client('s3', region_name="ap-northeast-1")
upload_res = s3_client.put_object(
Bucket=bucket_name,
Key=file_name,
Body=res.content
)
objects = s3_client.list_objects(Bucket=bucket_name)['Contents']
objectname= []
for obj in objects:
objectname.append(obj['Key'])
return {
'object_names': objectname,
'status_code': '200'
}
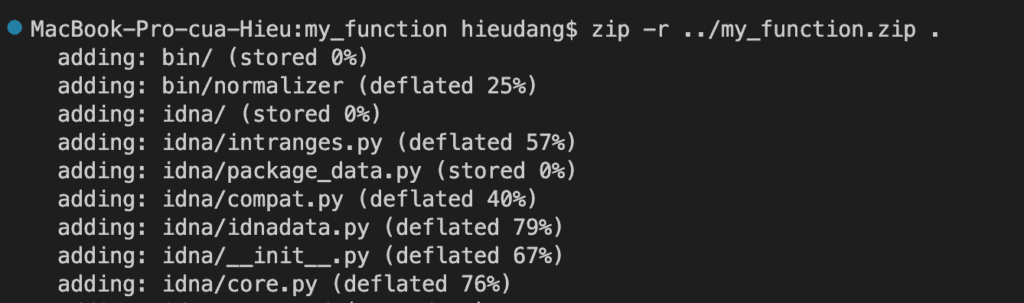
Create a .zip file with the installed libraries and lambda source code file.
zip -r ../my_function.zip .
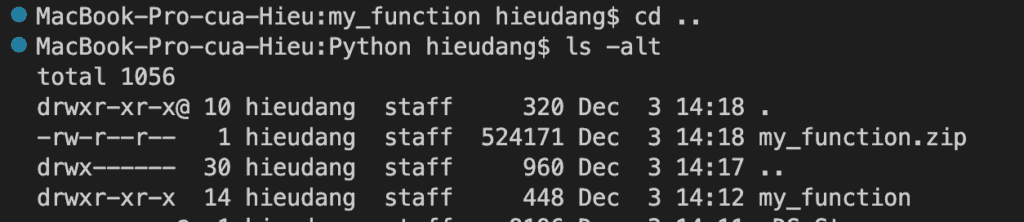
cd ..
ls -alt
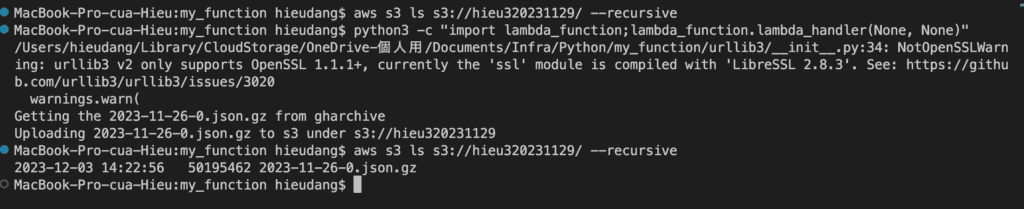
Test lambda function from local computer.
# check bucket
aws s3 ls s3://hieu320231129/ --recursive

#invoke lambda function from local
python3 -c "import lambda_function;lambda_function.lambda_handler(None, None)"

#delete uploaded file
aws s3 rm s3://hieu320231129/ --recursive
Create AWS Lambda function with requests module
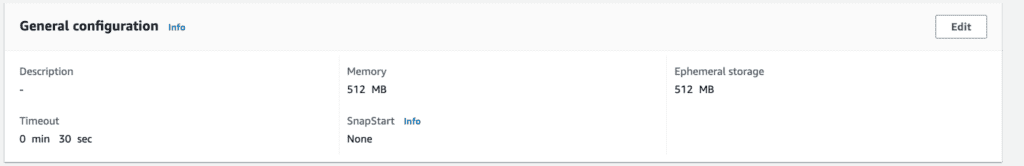
I will deploy zip file with python3.11 and change environment setting
Change environment setting
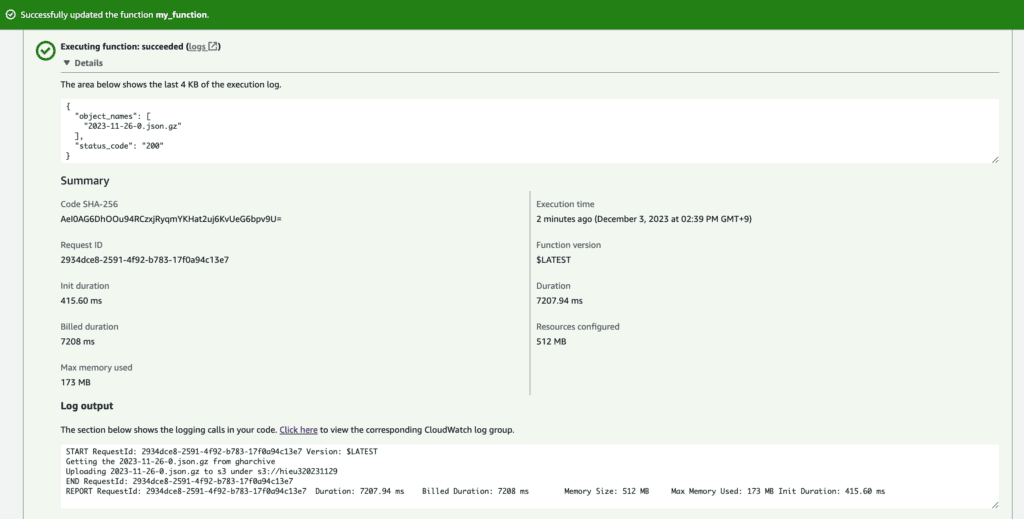
Test lambda function with request module
Conclusion
These steps provide an example of creating a lambda function with dependencies. I used the request module to read a file from a website and put it into an AWS S3 bucket. The specific configuration details may vary depending on your environment and setup. It’s recommended to consult the relevant documentation from AWS for detailed instructions on setting up. I hope will this your helpful. Thank you for reading the DevopsRoles page!
When setting up a Kubernetes cluster using Kubeadm, it’s essential to validate the installation to ensure everything is functioning correctly. In this blog post, we will guide you through the steps to Validating Kubernetes Cluster Installed using Kubeadm and Kubectl.
Learn how to validate your Kubernetes cluster installation using Kubeadm and ensure smooth operations. Follow our step-by-step guide for easy validation.
Validating Kubernetes Cluster Installed using Kubeadm: Step-by-Step Guide
Validating CMD Tools: Kubeadm & Kubectl
First, let’s check the versions of Kubeadm and Kubectl to ensure they match your cluster setup.
Checking “kubeadm” version
kubeadm version
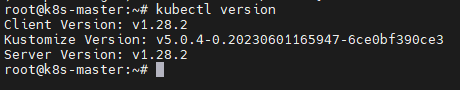
Checking “kubectl” version
kubectl version
Make sure the versions of Kubeadm and Kubectl are compatible with your Kubernetes cluster.
Validating Cluster Nodes
Next, we need to ensure that all nodes in the cluster, including both Master and Worker nodes, are in the “Ready” state.
To check the status of all nodes:
kubectl get nodes
kubectl get nodes -o wide
This command will display a list of all nodes in the cluster along with their status. Ensure that all nodes are marked as “Ready.”
Validating Kubernetes Components
It’s crucial to verify that all Kubernetes components on the Master node are running correctly.
To check the status of Kubernetes components:
kubectl get pods -n kube-system
kubectl get pods -n kube-system -o wide
This command will show the status of various Kubernetes components in the kube-system namespace. Ensure that all components are in the “Running” state.
Validating Services: Docker & Kubelet
To ensure the proper functioning of your cluster, we need to validate the services Docker and Kubelet on all nodes.
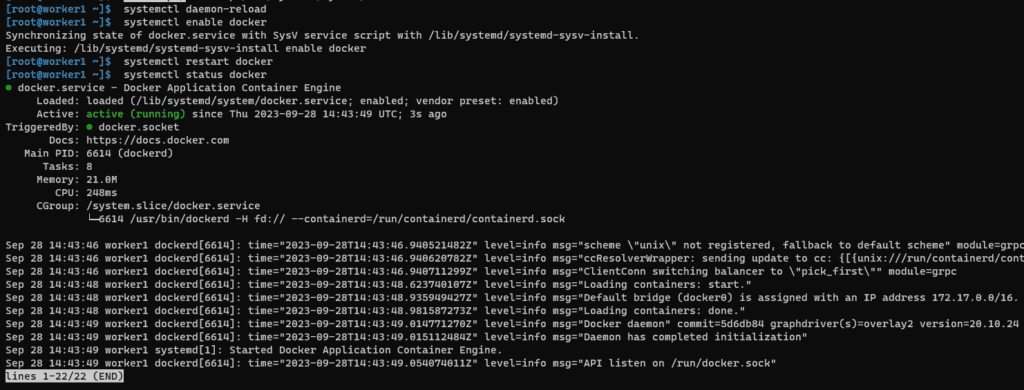
Checking Docker service status
systemctl status docker
This command will display the status of the Docker service. Ensure that it is “Active” and running without any errors.
Checking Kubelet service status
systemctl status kubelet
This command will show the status of the Kubelet service. Verify that it is “Active” and running correctly.
Deploying Test Deployment
To further validate your cluster, let’s deploy a sample Nginx deployment and check its status.
This command will delete the Nginx deployment from your cluster.
Conclusion
By following these steps, you can validate your Kubernetes cluster installation using Kubeadm and Kubectl. It’s essential to ensure that all the components, services, and deployments are running correctly to have a reliable and stable Kubernetes environment. I hope will this your helpful. Thank you for reading the DevopsRoles page!
Kubernetes has emerged as the go-to solution for container orchestration and management. If you’re looking to set up a Kubernetes cluster on a Ubuntu server, you’re in the right place. In this step-by-step guide, we’ll walk you through the process of installing Kubernetes using Kubeadm on Ubuntu.
Prerequisites
I have created 3 VMs for Kubernetes Cluster Nodes to Cloud Google Compute Engine (GCE)
Master(1): 2 vCPUs – 4GB Ram
Worker(2): 2 vCPUs – 2GB RAM
OS: Ubuntu 16.04 or CentOS/RHEL 7
I have configured Firewall Rules Ingress in Google Compute Engine (GCE)
Master Node: 2379,6443,10250,10251,10252
Worker Node: 10250,30000-32767
Installing Kubernetes using Kubeadm on Ubuntu
Set hostname on Each Node
# hostnamectl set-hostname "k8s-master"    // For Master node
# hostnamectl set-hostname "k8s-worker1"   // For 1st worker node
# hostnamectl set-hostname "k8s-worker2"   // For 2nd worker node
Add the following entries in /etc/hosts file on each node
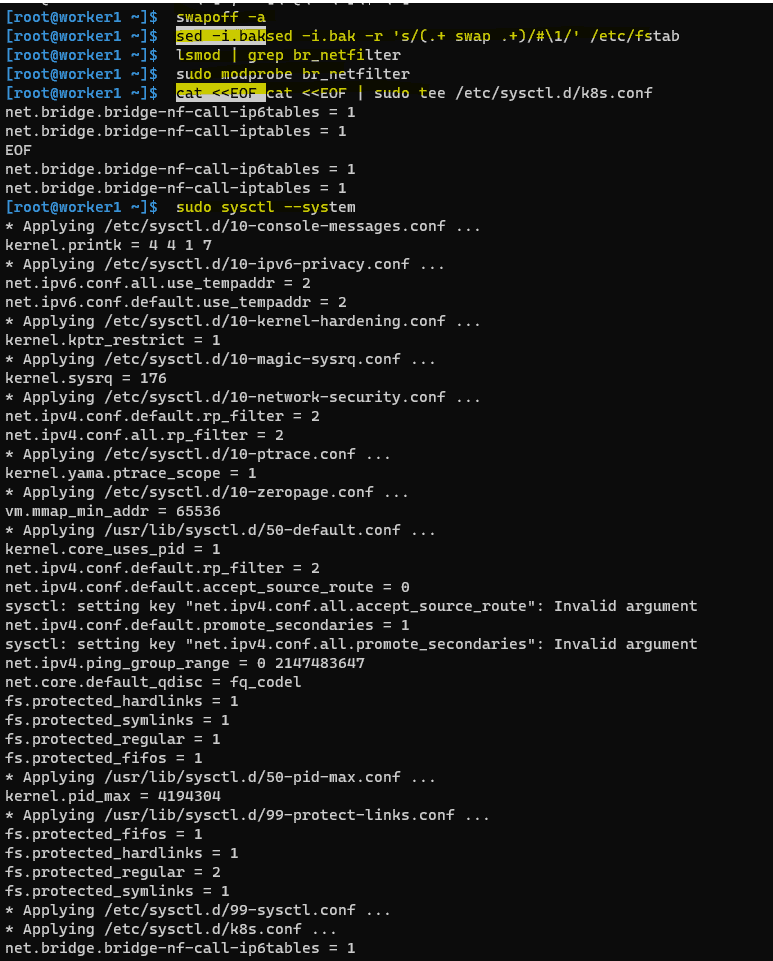
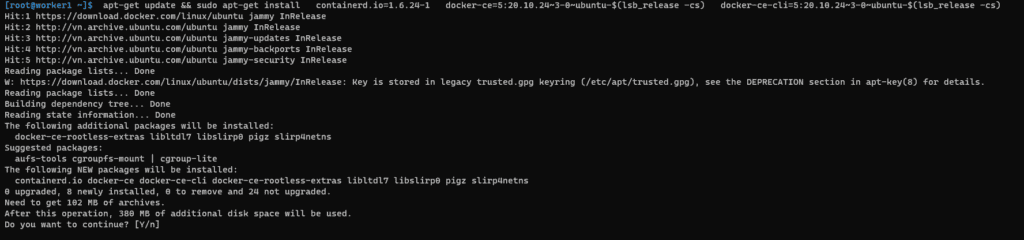
Run it on MASTER & WORKER Nodes. Kubernetes requires a container runtime, and Docker is a popular choice. To install Docker, run the following commands:
NOTE: There are multiple CNI Plug-ins available. You can install a choice of yours. In the case above commands don’t work, try checking the below link for more info
Joining Worker Nodes
Run it on WORKER Node only
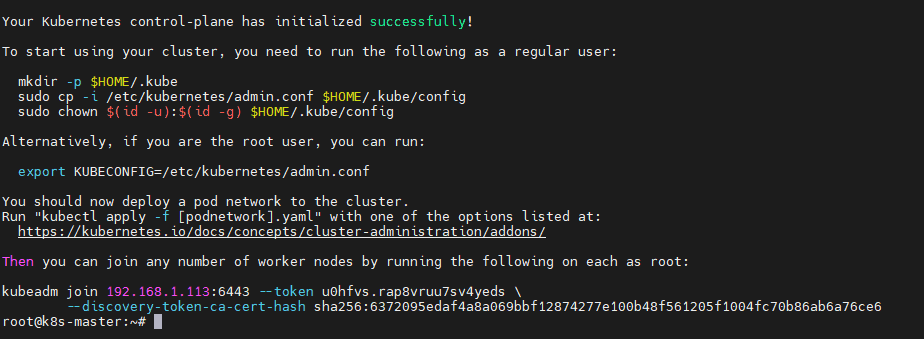
On your worker nodes, use the kubeadm join command from above kubeadm init output to join them to the cluster.
kubeadm join <...>
Run this command IF you do not have the above join command and/or create a NEW one.
kubeadm token create --print-join-command
Verify the Cluster
On the master node, ensure your cluster is up and running
kubectl get nodes
You should see the master node marked as “Ready” and any joined worker nodes.
Conclusion
Congratulations! You’ve successfully installed Kubernetes using Kubeadm on Ubuntu. With your Kubernetes cluster up and running, you’re ready to deploy and manage containerized applications and services at scale.
Kubernetes offers vast capabilities for container orchestration, scaling, and management. As you become more familiar with Kubernetes, you can explore advanced configurations and features to optimize your containerized environment.
I hope will this your helpful. Thank you for reading the DevopsRoles page!
How to Force history not to remember a particular command using HISTCONTROL ignorespace in Linux. When executing a command, you can use HISTCONTROL with ignorespace and precede the command with a space to ensure it’s ignored in your command history.
This might be tempting for junior sysadmins seeking discretion, but it’s essential to grasp how ignorespace functions. As a best practice, it’s generally discouraged to purposefully hide commands from your history, as transparency and accountability are crucial in system administration and troubleshooting.
What is HISTCONTROL?
HISTCONTROL is an environment variable in Linux that defines how your command history is managed. It allows you to specify which commands should be recorded in your history and which should be excluded. This can help you maintain a cleaner and more efficient command history.
ignorespace – An Option for HISTCONTROL
One of the settings you can use with HISTCONTROL is ignorespace. When ignorespace is included in the value of HISTCONTROL, any command line that begins with a space character will not be recorded in your command history. This can be incredibly handy for preventing sensitive information, such as passwords, from being stored in your history.
Working with HISTCONTROL ignorespace
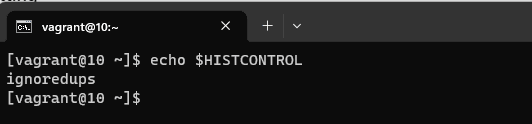
Step 1: Check Your Current HISTCONTROL Setting
Before you start using HISTCONTROL with ignorespace, it’s a good idea to check your current HISTCONTROL setting. Open a terminal and run the following command:
echo $HISTCONTROL
This will display your current HISTCONTROL setting. If it’s empty or doesn’t include ignorespace, you can proceed to the next step.
Step 2: Set HISTCONTROL to ignorespace
To enable ignorespace in your HISTCONTROL, you can add the following line to your shell configuration file (e.g., ~/.bashrc for Bash users):
export HISTCONTROL=ignorespace
After making this change, be sure to reload your shell configuration or start a new terminal session for the changes to take effect.
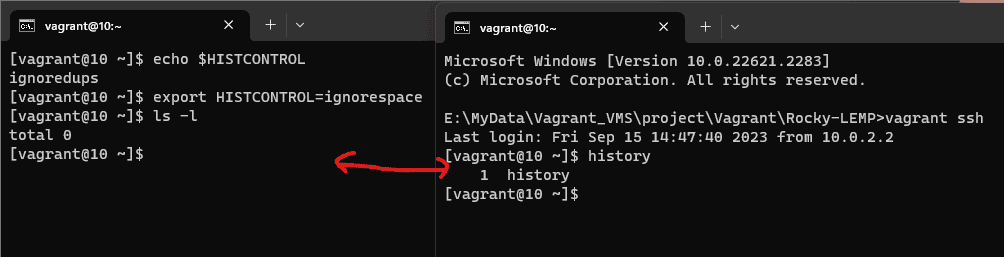
Step 3: Test ignorespace
Now that you’ve set HISTCONTROL to ignorespace, you can test its functionality. Try entering a command with a leading space, like this:
ls -l
Notice that the space at the beginning of the command is intentional. This command will not be recorded in your command history because of the ignorespace setting.
Step 4: Verify Your Command History
To verify that the command you just entered is not in your history, you can display your command history using the history command:
history
Conclusion
utilizing HISTCONTROL with ignorespace empowers you to better manage your Linux command history. This feature proves especially useful when excluding commands with sensitive data or temporary experiments. Understanding and harnessing HISTCONTROL ignorespace and its options, like ignorespace, enhances both the efficiency and security of your Linux command line experience.
Remember that these settings are user-specific, so individual configuration is necessary for each user on a multi-user system. Armed with this knowledge, you can exercise greater control over your command history and enhance your overall command line efficiency in Linux. You can Force history not to remember a particular command using HISTCONTROL ignorespace. Thank you for reading the DevopsRoles page!
How to view the contents of docker images? “Dive” is a command-line tool for exploring and analyzing Docker images. It allows you to inspect the contents of a Docker image, view its layers, and understand the file structure and sizes within those layers.
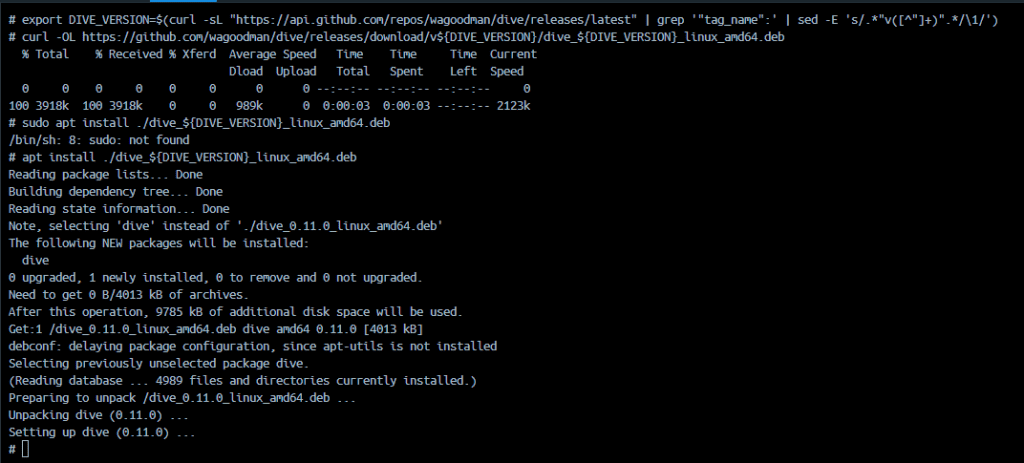
This tool can be helpful for optimizing Docker images and gaining insights into their composition. Dive: A Simple App for Viewing the Contents of a Docker Image.
For MacOS, Dive can be installed with either Homebrew and on Windows, Dive can be installed with a downloaded installer file for the OS.
What You’ll Need
Dive: You’ll need to install the Dive tool on your system to use it.
Docker: Dive works with Docker images, so you should have Docker installed on your system to pull and work with Docker images. For example, install docker on Ubuntu here.
Installing Dive
To install Dive, you can use package managers like Homebrew (on macOS) or download the binary from the Dive GitHub repository.
Using Homebrew (on macOS)
brew install dive
Downloading the binary
You can visit the Dive GitHub repository (dive) and download the binary for your platform from the “Releases” section. You installing Dive on Ubuntu.
Once you have Dive installed, you can use it to view the contents of a Docker image as follows:
Open your terminal or command prompt.
Run the following command, replacing with the name or ID of the Docker image you want to inspect:
Dive will launch a text-based interface that allows you to navigate through the layers of the Docker image. You can explore the file structure, check the sizes of individual layers, and gain insights into the image’s contents.
View the contents of docker images
To examine the latest Alpine Docker image
dive alpine:latest
You can define a different source using the source option
dive IMAGE --source SOURCE
SOURCE is the location of the repository.
The features of Dive
Layer Visualization: Dive provides a visual representation of a Docker image’s layers, showing how they are stacked on top of each other.
Layer Size Information: Dive displays the size of each individual layer in the Docker image.
File and Directory Listing: You can navigate through the contents of each layer and view the files and directories it contains.
Image Efficiency Analysis: Dive helps you identify inefficiencies in your Docker images.
Image Build Context Analysis: Dive can analyze the build context of a Docker image.
Image Diffing: Dive allows you to compare two Docker images and see the differences between them.
Conclusion
Dive is a powerful tool for image analysis and optimization, and it can help you gain insights into what’s inside a Docker image. It’s particularly useful for identifying large files or unnecessary dependencies that can be removed to create smaller and more efficient Docker images.
You can view the contents of docker images using Dive.
In this tutorial, you will create a Lambda to access ElastiCache cluster. When you create the Lambda function, you provide subnet IDs in your Amazon VPC and a VPC security group to allow the Lambda function to access resources in your VPC. For illustration in this tutorial, the Lambda function generates a UUID, writes it to the cache, and retrieves it from the cache.
Invoke the Lambda function and verify that it accessed the ElastiCache cluster in your VPC.
Prerequisites
Before starting, you should have the following prerequisites configured
An AWS account
AWS CLI on your computer
A Memcached cluster (refer Memcached tutorial to create a Memcached cluster )
Create a Lambda to access ElastiCache in an Amazon VPC
Create the execution role
Create an ElastiCache cluster
Create a deployment package
Create the Lambda function
Test the Lambda function
Clean up
Create the execution role
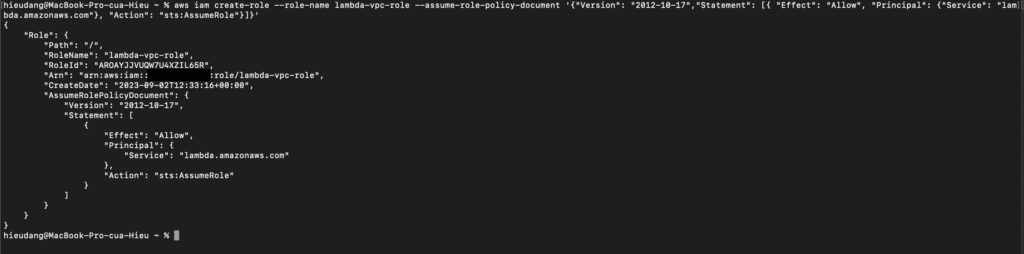
Create the execution role that gives your function permission to access AWS resources. To create an execution role with the AWS CLI, use the create-role command.
In the following example, you specify the trust policy inline.
You can also define the trust policy for the role using a JSON file. In the following example, trust-policy.json is a file in the current directory. Example trust-policy.json
In the following example, create app.py a file in the current directory. Example app.py
from __future__ import print_function
import time
import uuid
import sys
import socket
import elasticache_auto_discovery
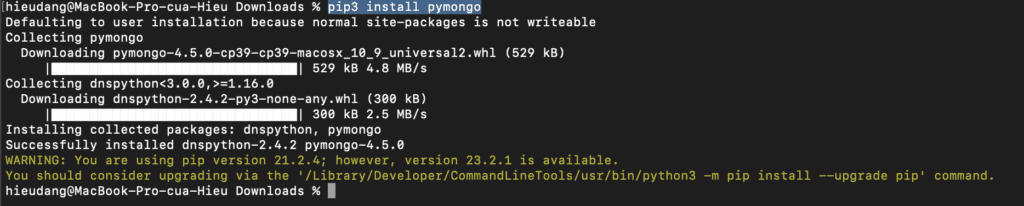
from pymemcache.client.hash import HashClient
#elasticache settings
elasticache_config_endpoint = "your-elasticache-cluster-endpoint:port"
nodes = elasticache_auto_discovery.discover(elasticache_config_endpoint)
nodes = map(lambda x: (x[1], int(x[2])), nodes)
memcache_client = HashClient(nodes)
def handler(event, context):
"""
This function puts into memcache and get from it.
Memcache is hosted using elasticache
"""
#Create a random UUID... this will be the sample element we add to the cache.
uuid_inserted = uuid.uuid4().hex
#Put the UUID to the cache.
memcache_client.set('uuid', uuid_inserted)
#Get item (UUID) from the cache.
uuid_obtained = memcache_client.get('uuid')
if uuid_obtained.decode("utf-8") == uuid_inserted:
# this print should go to the CloudWatch Logs and Lambda console.
print ("Success: Fetched value %s from memcache" %(uuid_inserted))
else:
raise Exception("Value is not the same as we put :(. Expected %s got %s" %(uuid_inserted, uuid_obtained))
return "Fetched value from memcache: " + uuid_obtained.decode("utf-8")
Dependencies
elasticache-auto-discovery – The Lambda function uses this library to get the nodes in your Amazon ElastiCache cluster.
pymemcache – The Lambda function code uses this library to create an HashClientobject to set and get items from memcache.
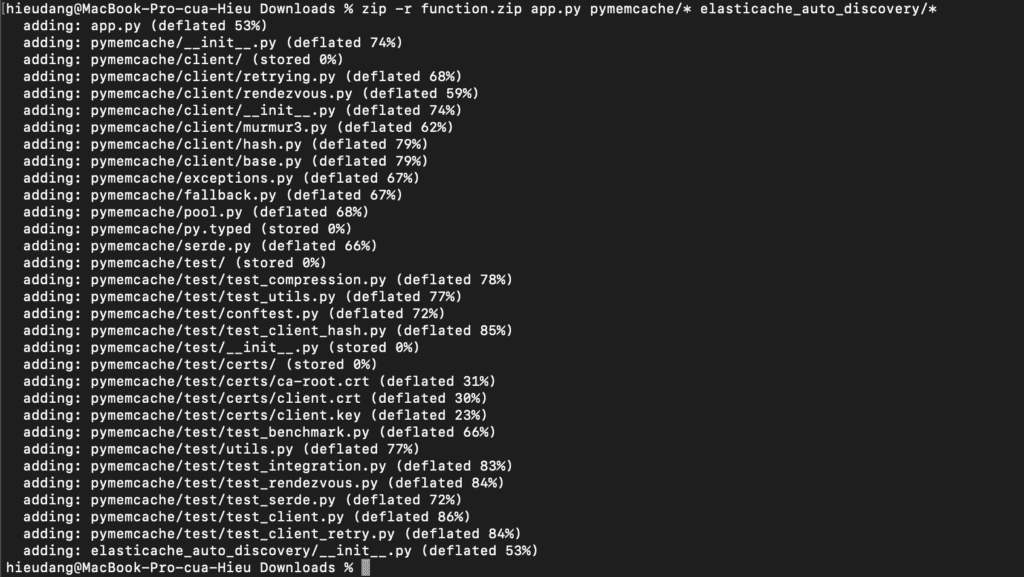
Create a deployment package.
zip -r function.zip app.py pymemcache/* elasticache_auto_discovery/*
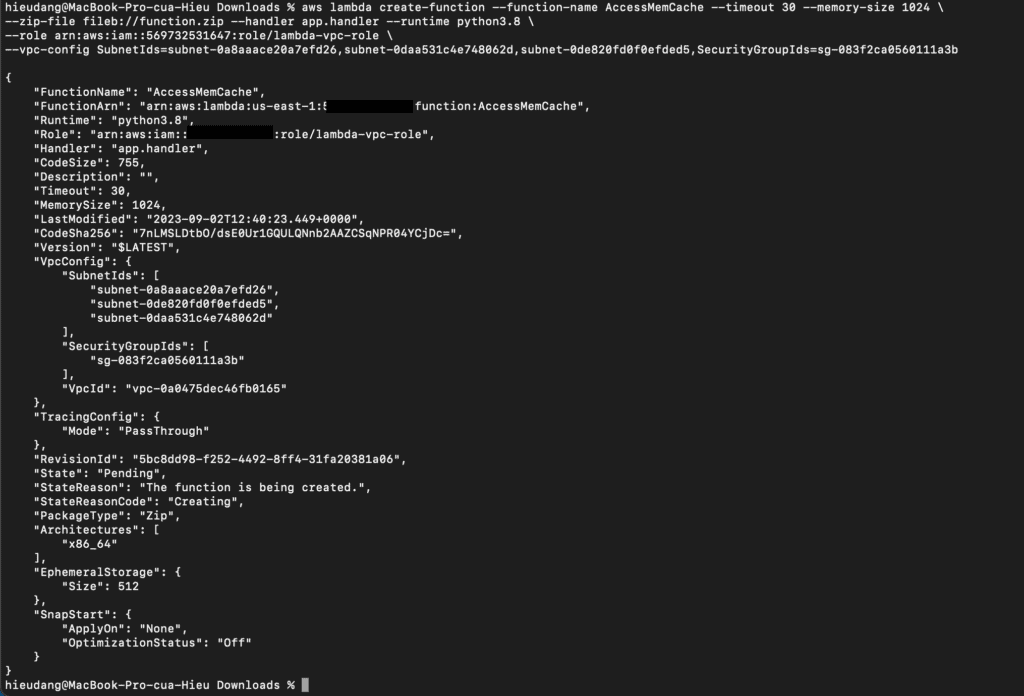
Create the Lambda function
Create the Lambda function with the create-function command.
In this step, you invoke the Lambda function manually using the invoke command. When the Lambda function runs, it generates a UUID and writes it to the ElastiCache cluster specified in your Lambda code. The Lambda function then retrieves the item from the cache.
Invoke the Lambda function with the invoke the command includes getting log stream from CloudWatch
aws iam list-attached-role-policies --role-name lambda-vpc-role
aws iam detach-role-policy --role-name lambda-vpc-role --policy-arn arn:aws:iam::aws:policy/service-role/AWSLambdaVPCAccessExecutionRole
aws iam delete-role --role-name lambda-vpc-role
Conclusion
These steps provide an example to manage the Memcached cluster. The specific configuration details may vary depending on your environment and setup. It’s recommended to consult the relevant documentation from AWS for detailed instructions on setting up. I hope this will your helpful. Thank you for reading the DevopsRoles page!
In this Memcached tutorial, you will create an Amazon ElastiCache for the Memcached cluster in your default Amazon Virtual Private Cloud. Operations on the cluster using CLI commands and node management using CLI commands. For more information about Amazon ElastiCache, see Amazon ElastiCache.
Prerequisites
Before starting, you should have the following prerequisites configured
An AWS account
AWS CLI on your computer
Memcached tutorial
Creating a Memcached cluster with AWS CLI
Modifying a Memcached cluster with AWS CLI
Viewing the elements in a Memcached cluster with AWS CLI
Rebooting a Memcached cluster with AWS CLI
Discovering the endpoints of Memcached cluster with AWS CLI
Adding nodes to a Memcached cluster with AWS CLI
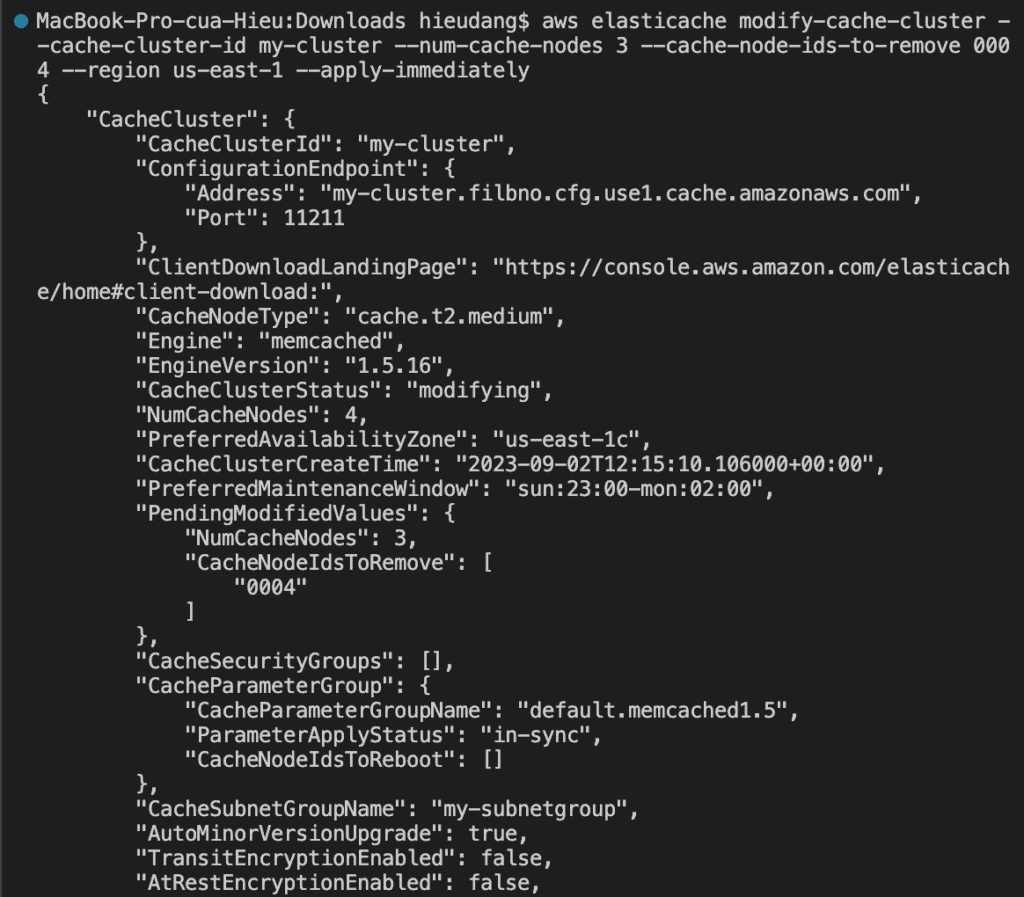
Removing nodes from a Memcached cluster with AWS CLI
Scaling Memcached vertically
Configuring a Lambda function to access Amazon ElastiCache in an Amazon VPC
Deleting a Memcached cluster with AWS CLI
Creating a Memcached cluster with AWS CLI
Before you begin, If you have not installed the AWS CLI, see Setting up the Amazon Redshift CLI. This tutorial uses the us-ease-1 region.
Now we’re ready to launch a Memcached cluster by using the AWS CLI.
You can set up a cluster with a specific number of nodes and a parameter group that controls the properties for each node. All nodes within a cluster are designed to be of the same node type and have the same parameter and security group settings.
Every cluster must have a cluster identifier. The cluster identifier is a customer-supplied name for the cluster. This identifier specifies a particular cluster when interacting with the ElastiCache API and AWS CLI commands. The cluster identifier must be unique for that customer in an AWS Region. For more information, see create-cache-cluster
–cache-parameter-group-name: If this argument is omitted, the default parameter group for the specified engine is used. Or you can use create-cache-parameter-group command to create a parameter group.
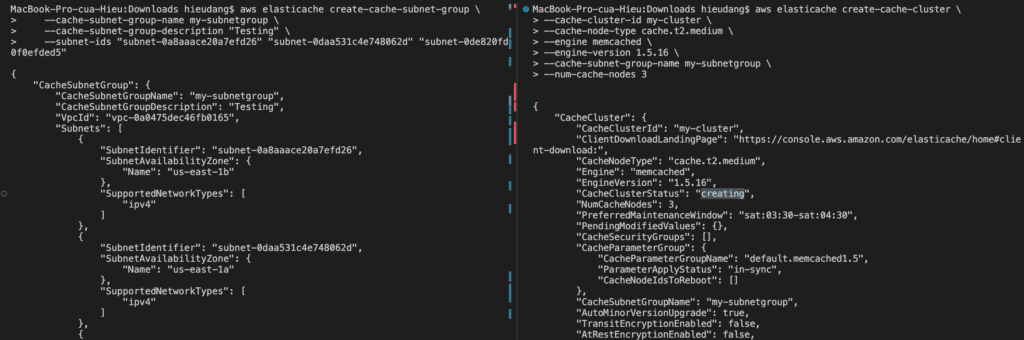
If you’re going to launch your cluster in a VPC, make sure to create a subnet group in the same VPC before you start creating a cluster.
The following CLI code creates a Memcached cache cluster with 3 nodes.
In addition to adding or removing nodes from a cluster, there can be times when you need to make other changes to an existing cluster, such as, adding a security group, changing the maintenance window, or a parameter group.
You can modify an existing cluster using the AWS CLI modify-cache-cluster operation. To modify a cluster’s configuration value, specify the cluster’s ID, the parameter to change, and the parameter’s new value.
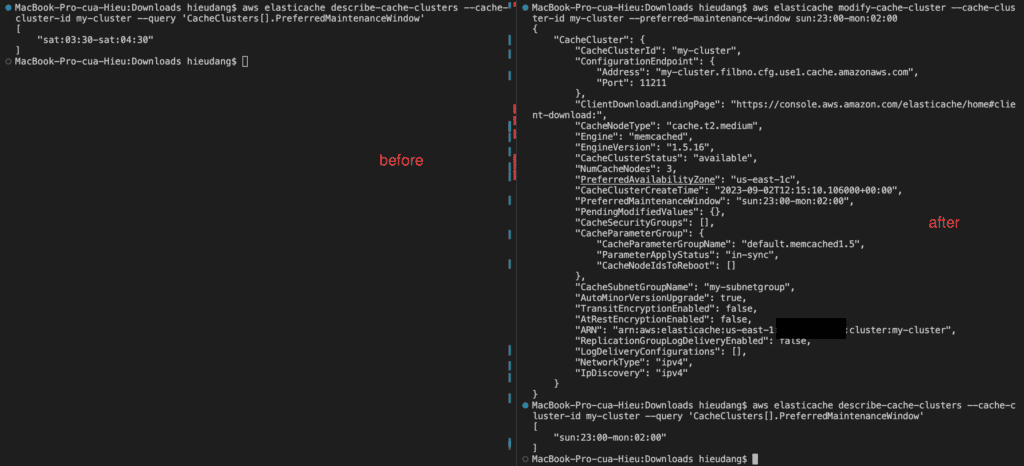
The --apply-immediately parameter applies only to modifications in the engine version and changing the number of nodes in a cluster. If you want to apply any of these changes immediately, use the --apply-immediately parameter. If you prefer postponing these changes to your next maintenance window, use the --no-apply-immediately parameter. Other modifications, such as changing the maintenance window, are applied immediately.
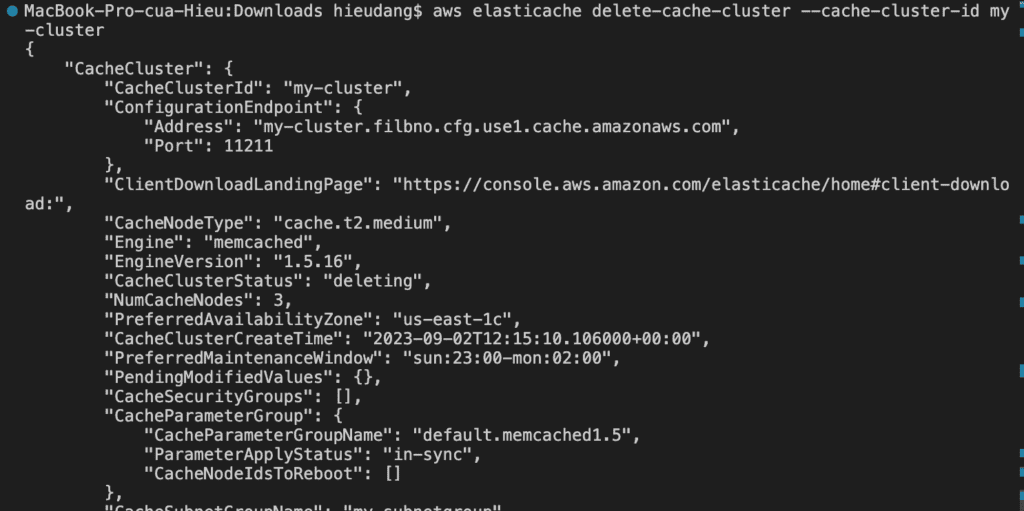
The following example changes the maintenance window for a cluster named my-cluster and applies the change immediately.
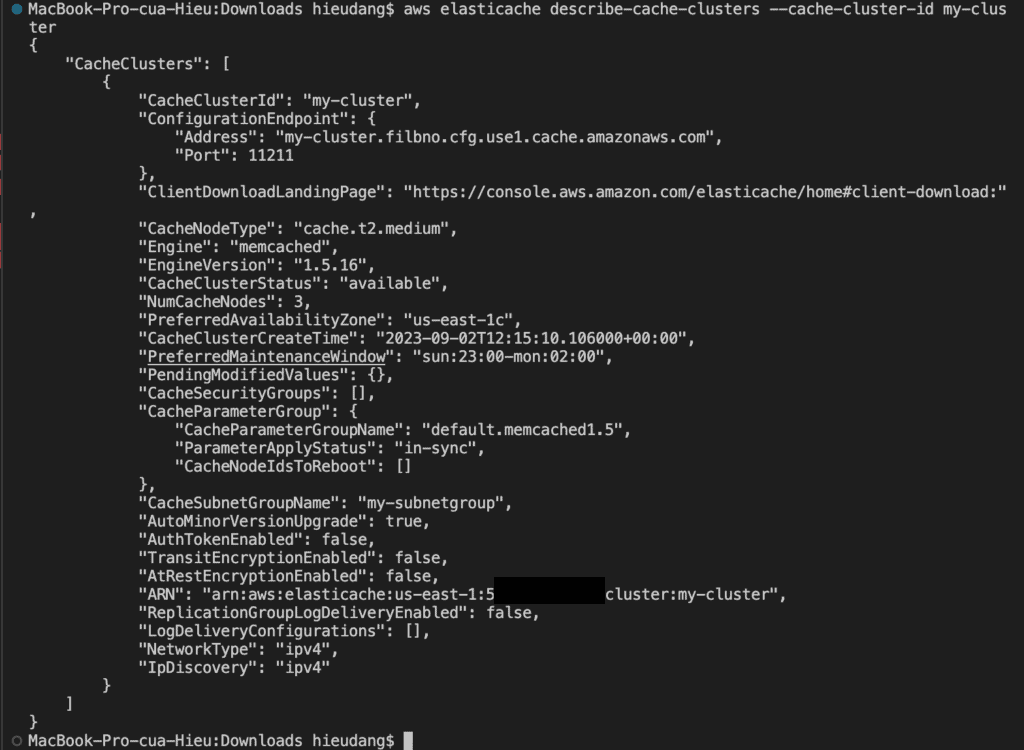
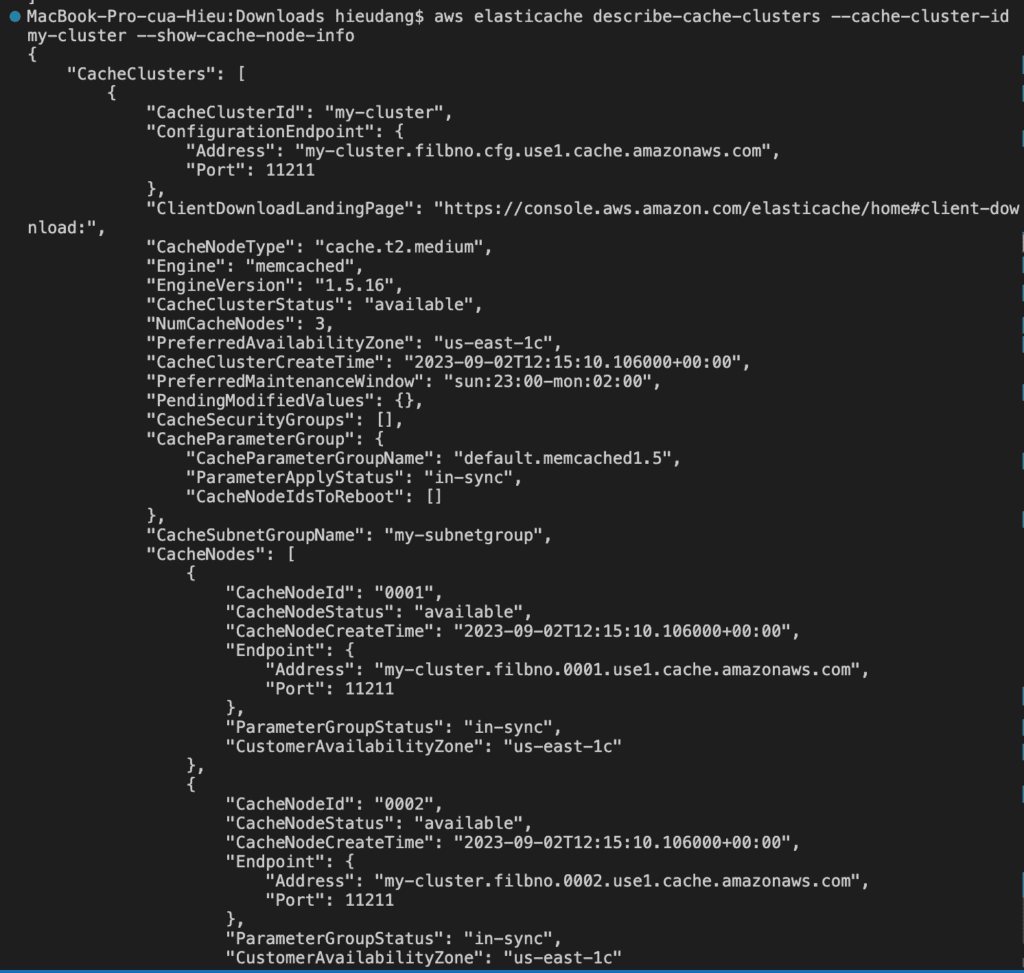
By default, abbreviated information about the clusters is returned. You can use the optional ShowCacheNodeInfo flag to retrieve detailed information about the cache nodes associated with the clusters. These details include the DNS address and port for the cache node endpoint.
The following code lists the details for my-cluster
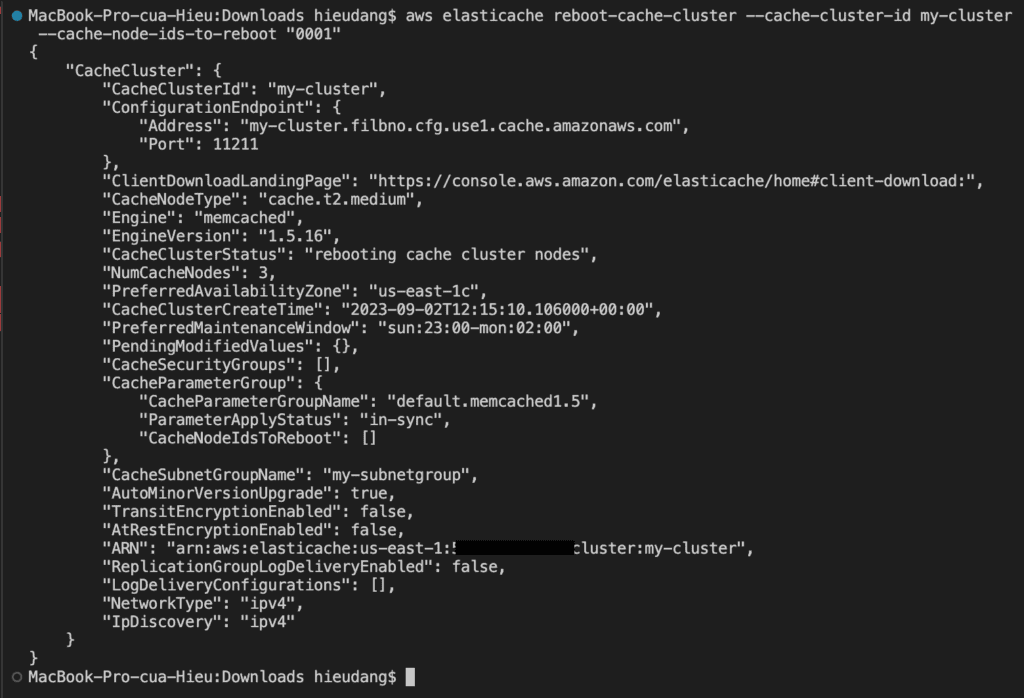
Some changes require that the cluster be rebooted for the changes to be applied. For example, for some parameters, changing the parameter value in a parameter group is only applied after a reboot.
When you reboot a cluster, the cluster flushes all its data and restarts its engine. During this process, you cannot access the cluster. Because the cluster flushed all its data, when it is available again, you start with an empty cluster.
To reboot specific nodes in the cluster, use the --cache-node-ids-to-reboot to list the specific clusters to reboot.
Discovering the endpoints of the Memcached cluster with AWS CLI
Your application connects to your cluster using endpoints. An endpoint is a node or cluster’s unique address. Which endpoints to use
If you use Automatic Discovery, you can use the cluster’s configuration endpoint to configure your Memcached client. This means you must use a client that supports Automatic Discovery.
If you don’t use Automatic Discovery, you must configure your client to use the individual node endpoints for reads and writes. You must also keep track of them as you add and remove nodes.
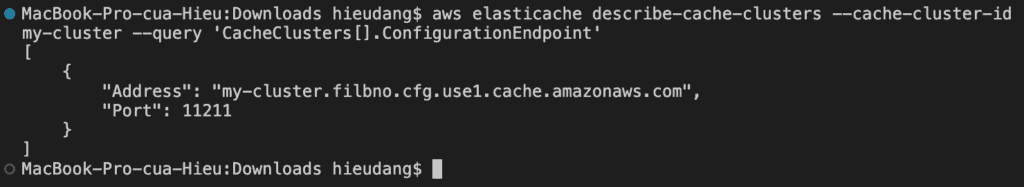
You can use the AWS CLI to discover the endpoints for a cluster and its nodes with the describe-cache-clusterscommand. For more information, see the topic describe-cache-clusters.
The following command retrieves the configuration endpoint (ConfigurationEndpoint)
For Memcached clusters, the command returns the configuration endpoint. If you include the optional parameter --show-cache-node-info, the following command retrieves the configuration endpoint (ConfigurationEndpoint) and individual node endpoints (Endpoint) for the Memcached cluster.
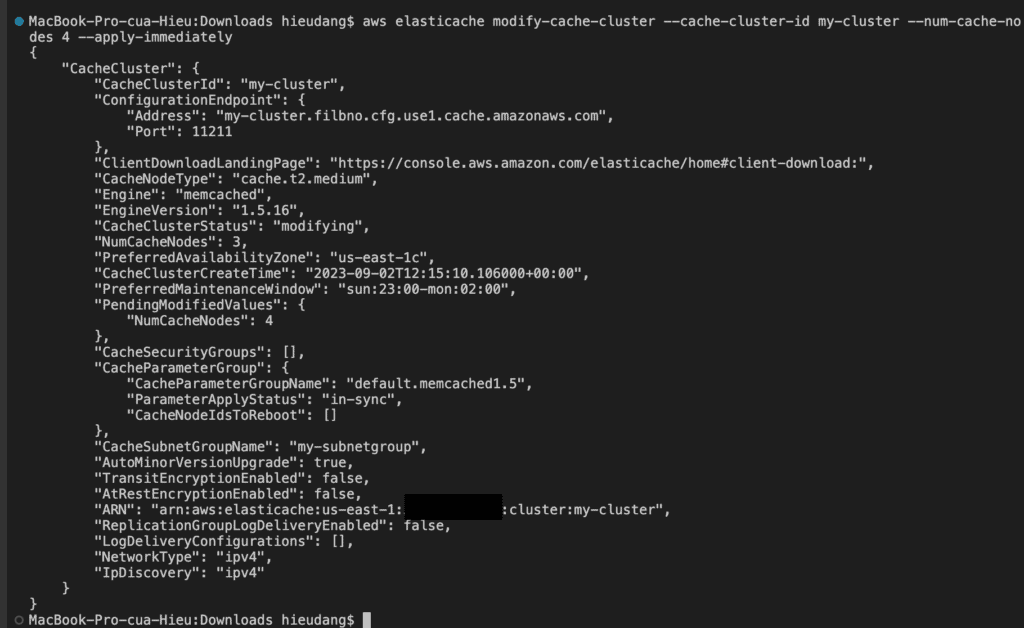
Adding nodes to a Memcached cluster increases the number of your cluster’s partitions.
To add nodes to a cluster using the AWS CLI, use the AWS CLI operation modify-cache-cluster. For more information, see the AWS CLI topic modify-cache-cluster.
Run the following command to add nodes to a cluster
These steps provide an example to manage the Memcached cluster. The specific configuration details may vary depending on your environment and setup. It’s recommended to consult the relevant documentation from AWS for detailed instructions on setting up. I hope will this be helpful. Thank you for reading the DevopsRoles page!
This tutorial shows you how to create a Redshift cluster resource, connect to Amazon Redshift, load sample data from S3 to Redshift into Redshift, and run queries with data usage command line tools.
You can use SQL Workbench or Amazon Redshift Query Editor v2.0 (web-based analyst workbench). In this tutorial, we choose to load sample data from an Amazon S3 bucket to Amazon Redshift using the PLSQL command-line tool.
psql is a terminal-based front-end to PostgreSQL. It enables you to type in queries interactively, issue them to PostgreSQL, and see the query results. Alternatively, input can be from a file or command line arguments. In addition, psql provides several meta-commands and various shell-like features to facilitate writing scripts and automating a wide variety of tasks.
Prerequisites
Before starting, you should have the following prerequisites configured
An AWS account
AWS CLI on your computer
Load data from S3 to Redshift into Redshift example with AWS CLI
Install PSQL on MacOS
Creating a data warehouse with Amazon Redshift using AWS CLI
Connect to the Redshift cluster using PSQL
Create Redshift cluster tables using PSQL
Redshift default role setting uses AWS Console manage
Loading sample data from S3 to Redshift with PSQL
Delete the sample cluster using AWS CLI
Install PSQL on MacOS
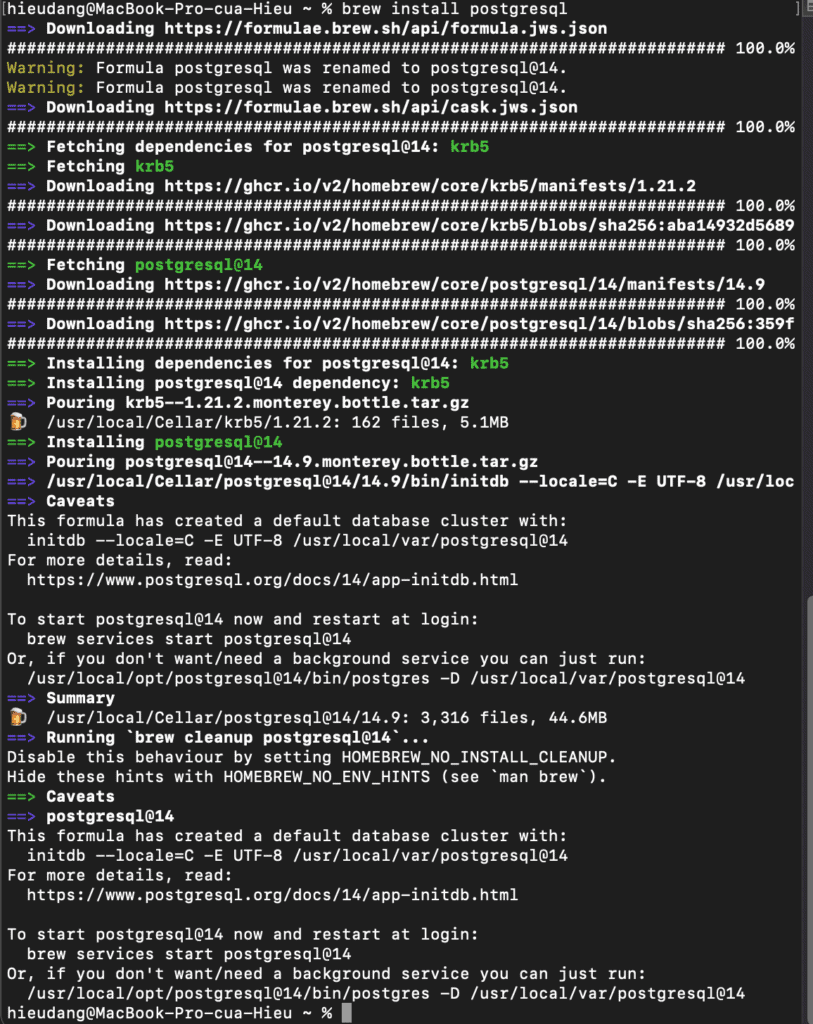
We can choose a version from PostgresSQL page or execute the following command on MacOS
brew install postgresql
Creating a data warehouse with Amazon Redshift using AWS CLI
Before you begin, If you have not installed the AWS CLI, see Setting up the Amazon Redshift CLI. This tutorial uses the us-east-1 region.
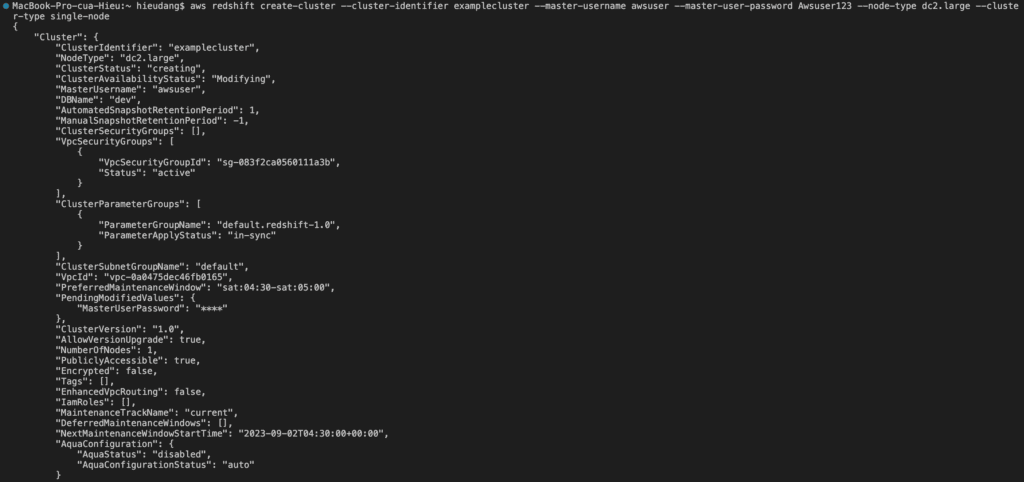
Now we’re ready to launch a cluster by using the AWS CLI.
The create-cluster the command has a large number of parameters. For this tutorial, you will use the parameter values that are described in the following table. Before you create a cluster in a production environment, we recommend that you review all the required and optional parameters so that your cluster configuration matches your requirements. For more information, see create-cluster
When the ClusterStatus field changes from creating to available, the cluster is ready for use.
Connect to the Redshift cluster using PSQL
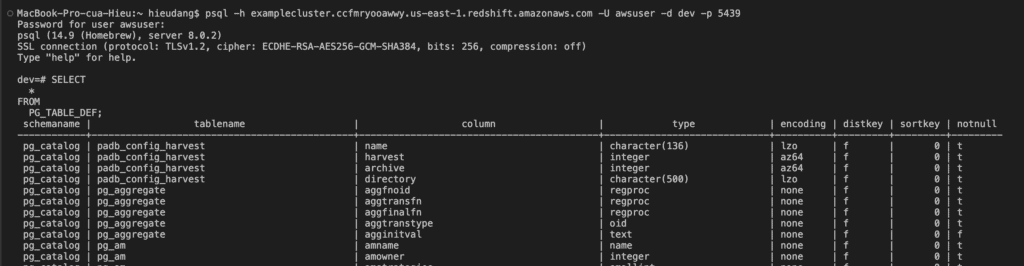
Run the following command to connect to the Redshift cluster.
psql -h examplecluster.ccfmryooawwy.us-east-1.redshift.amazonaws.com -U awsuser -d dev -p 5439
You must explicitly grant inbound access to your client to connect to the cluster. When you created a cluster in the previous step, because you did not specify a security group, you associated the default cluster security group with the cluster.
The default cluster security group contains no rules to authorize any inbound traffic to the cluster. To access the new cluster, you must add rules for inbound traffic, which are called ingress rules, to the cluster security group. If you are accessing your cluster from the Internet, you will need to authorize a Classless Inter-Domain Routing IP (CIDR/IP) address range.
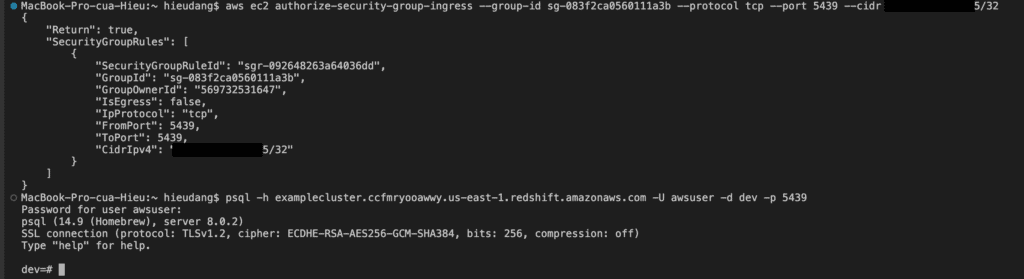
Run the following command to enable your computer to connect to your Redshift cluster. Then login into your cluster using psql.
#allow connect to cluster from my computer
aws ec2 authorize-security-group-ingress --group-id sg-083f2ca0560111a3b --protocol tcp --port 5439 --cidr 111.111.111.111/32
This command returns the following result.
Now test the connection by querying the system table
Create Redshift cluster tables using PSQL
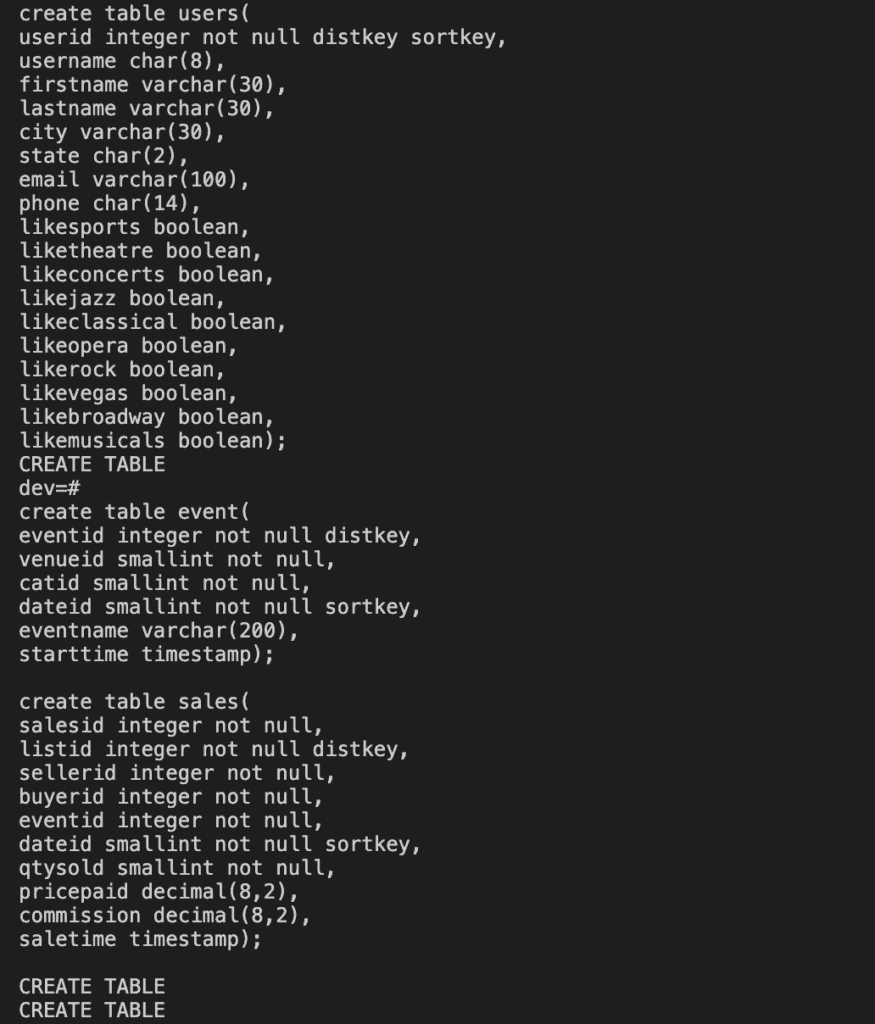
In this tutorial, I use sample data from AWS. Run the following command to create Redshift tables.
create table users(
userid integer not null distkey sortkey,
username char(8),
firstname varchar(30),
lastname varchar(30),
city varchar(30),
state char(2),
email varchar(100),
phone char(14),
likesports boolean,
liketheatre boolean,
likeconcerts boolean,
likejazz boolean,
likeclassical boolean,
likeopera boolean,
likerock boolean,
likevegas boolean,
likebroadway boolean,
likemusicals boolean);

create table event(
eventid integer not null distkey,
venueid smallint not null,
catid smallint not null,
dateid smallint not null sortkey,
eventname varchar(200),
starttime timestamp);

create table sales(
salesid integer not null,
listid integer not null distkey,
sellerid integer not null,
buyerid integer not null,
eventid integer not null,
dateid smallint not null sortkey,
qtysold smallint not null,
pricepaid decimal(8,2),
commission decimal(8,2),
saletime timestamp);
This command returns the following result.
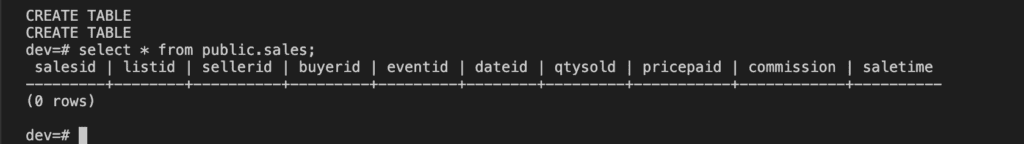
Test by querying the public.sales table as follows
select * from public.sales;
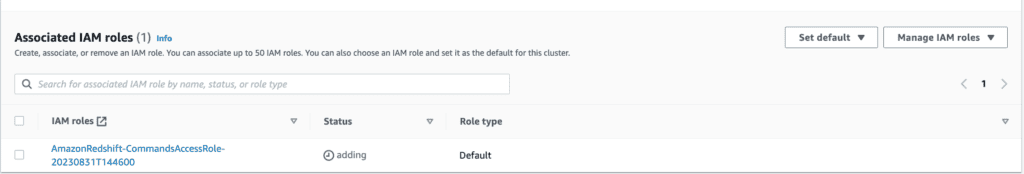
Redshift default role setting uses AWS Console manage
Before you can load data from Amazon S3, you must first create an IAM role with the necessary permissions and attach it to your cluster. To do this refer to AWS document
Loading sample data from S3 to Redshift with PSQL
Use the COPY command to load large datasets from Amazon S3 into Amazon Redshift. For more information about COPY syntax, see COPY in the Amazon Redshift Database Developer Guide.
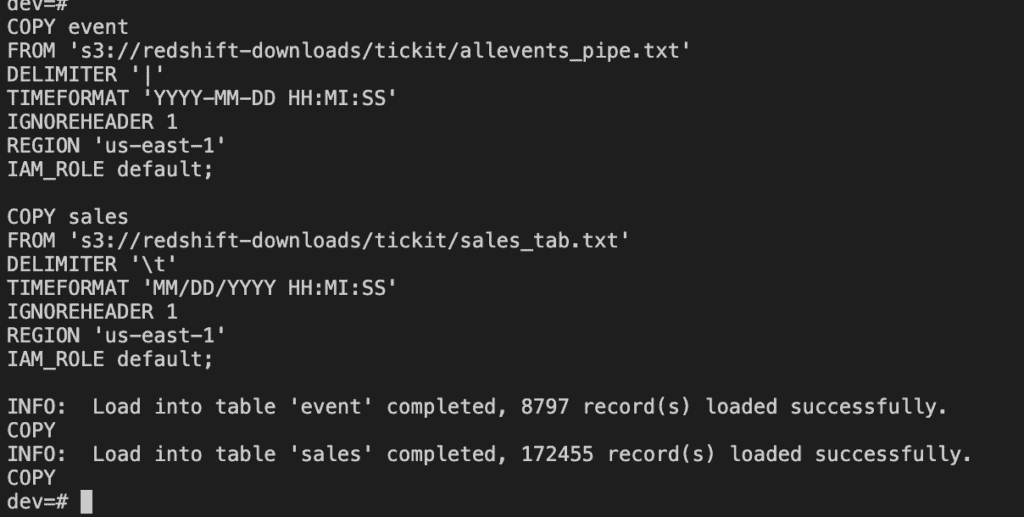
Run the following SQL commands in PSQL to load data from S3 to Redshift
COPY users
FROM 's3://redshift-downloads/tickit/allusers_pipe.txt'
DELIMITER '|'
TIMEFORMAT 'YYYY-MM-DD HH:MI:SS'
IGNOREHEADER 1
REGION 'us-east-1'
IAM_ROLE default;

COPY event
FROM 's3://redshift-downloads/tickit/allevents_pipe.txt'
DELIMITER '|'
TIMEFORMAT 'YYYY-MM-DD HH:MI:SS'
IGNOREHEADER 1
REGION 'us-east-1'
IAM_ROLE default;

COPY sales
FROM 's3://redshift-downloads/tickit/sales_tab.txt'
DELIMITER '\t'
TIMEFORMAT 'MM/DD/YYYY HH:MI:SS'
IGNOREHEADER 1
REGION 'us-east-1'
IAM_ROLE default;
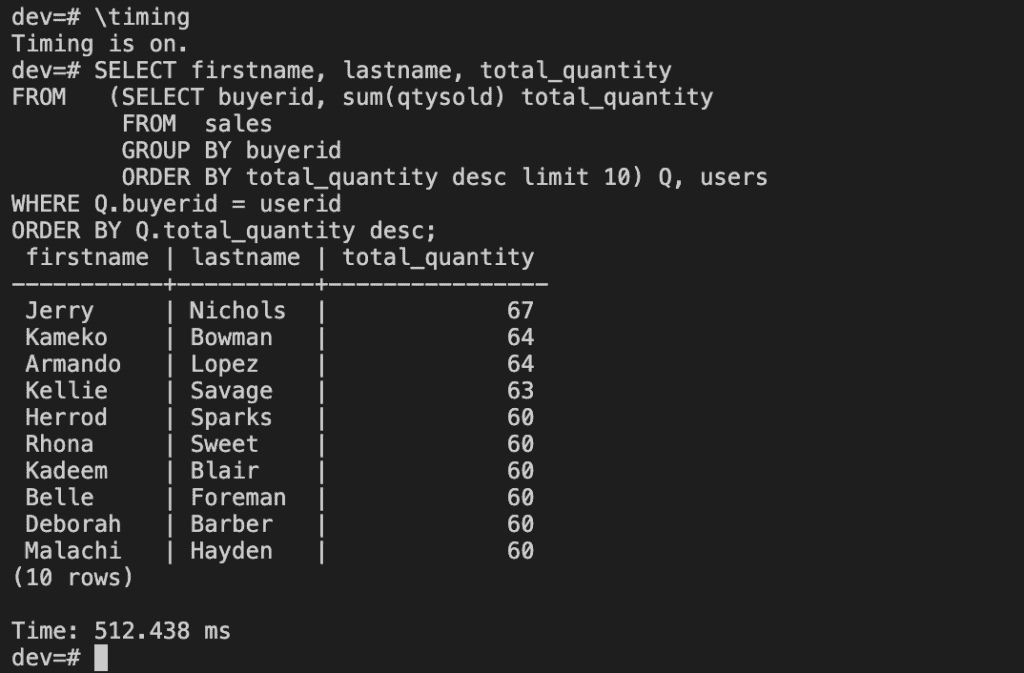
After loading data, try some example queries.
\timing

SELECT firstname, lastname, total_quantity
FROM   (SELECT buyerid, sum(qtysold) total_quantity
        FROM  sales
        GROUP BY buyerid
        ORDER BY total_quantity desc limit 10) Q, users
WHERE Q.buyerid = userid
ORDER BY Q.total_quantity desc;
Now that you’ve loaded data into Redshift.
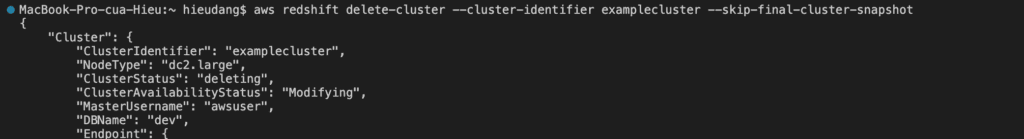
Delete the sample cluster using AWS CLI
When you delete a cluster, you must decide whether to create a final snapshot. Because this is an exercise and your test cluster should not have any important data in it, you can skip the final snapshot.
To delete your cluster, enter the following command.
Congratulations! You successfully launched, authorized access to, connected to, and terminated a cluster.
Conclusion
These steps provide an example of loading data from S3 to Redshift into Redshift with the PSQL tool. The specific configuration details may vary depending on your environment and setup. It’s recommended to consult the relevant documentation from AWS for detailed instructions on setting up. I hope will this be helpful. Thank you for reading the DevopsRoles page!