Migrating your infrastructure code can be a daunting task, fraught with potential pitfalls and unexpected challenges. However, the benefits of a well-planned migration are substantial, leading to improved efficiency, enhanced security, and a more robust infrastructure. This article focuses on simplifying the process of Terraform Waypoint migration, providing a comprehensive guide for developers and DevOps engineers looking to leverage Waypoint’s capabilities for managing their Terraform deployments. We’ll explore the reasons behind migrating, the process itself, best practices, and common issues you might encounter along the way.
Table of Contents
Understanding the Need for Terraform Waypoint Migration
Many organizations rely on Terraform for infrastructure as code (IaC), but managing deployments, particularly across various environments (development, staging, production), can become complex. This complexity often involves manual steps, increasing the risk of human error and inconsistencies. Terraform Waypoint migration offers a solution by providing a streamlined, automated workflow for managing your Terraform deployments. Waypoint simplifies the process, reducing operational overhead and ensuring consistency across your environments. This is especially valuable for organizations with large, complex infrastructures or those aiming to embrace a GitOps workflow.
Why Choose Waypoint for Terraform?
- Automated Deployments: Waypoint automates the entire deployment process, from building and testing to deploying to various environments.
- Simplified Workflows: It integrates seamlessly with Git, enabling efficient CI/CD pipelines and simplifying the process of managing changes.
- Improved Consistency: Waypoint ensures consistent deployments across different environments by automating the process and reducing manual intervention.
- Enhanced Security: By automating deployments, Waypoint reduces the risk of human error and improves the security of your infrastructure.
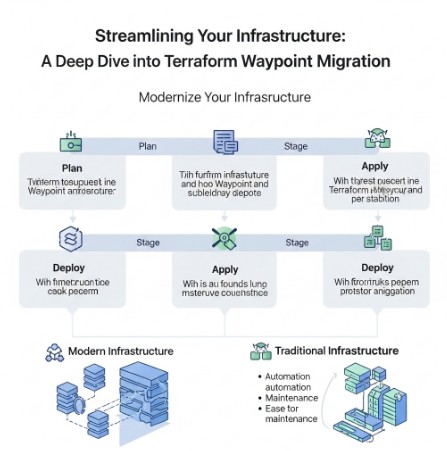
The Terraform Waypoint Migration Process
Migrating to Waypoint from a different deployment system requires a structured approach. The following steps outline a recommended process for Terraform Waypoint migration:
Step 1: Planning and Assessment
- Inventory your current setup: Identify your existing Terraform configurations, deployment scripts, and any related tooling.
- Define your migration goals: Clearly articulate what you hope to achieve by migrating to Waypoint (e.g., improved automation, enhanced security, reduced deployment times).
- Choose a migration strategy: Decide whether to migrate all your infrastructure at once or adopt a phased approach.
Step 2: Setting up Waypoint
- Install Waypoint: Download and install Waypoint according to the official documentation. Waypoint Getting Started
- Configure Waypoint: Configure Waypoint to connect to your infrastructure providers (e.g., AWS, GCP, Azure) and your Git repository.
- Create a Waypoint project: Create a new Waypoint project in your Git repository and configure it to manage your Terraform deployments.
Step 3: Implementing Waypoint
This involves adapting your existing Terraform code to work with Waypoint. This usually involves creating a waypoint.hcl file, which specifies the deployment process. The following is an example of a basic waypoint.hcl file:
project "my-project" {

  application "my-app" {

    build {

      type = "terraform"

      platform = "linux/amd64"

    }

    deploy {

      platform = "aws"

      config = {

        region = "us-west-2"

      }

    }

  }

}
Remember to replace placeholders like “my-project”, “my-app”, “aws”, “us-west-2” with your specific details. You will need to define the build and deploy stages appropriately for your infrastructure. For more complex scenarios you may need to specify more complex build and deploy configurations, including environment-specific variables.
Step 4: Testing and Iteration
- Test thoroughly: Deploy to a non-production environment to verify everything works as expected.
- Iterate and refine: Based on testing results, adjust your Waypoint configuration and Terraform code.
- Monitor and log: Implement proper monitoring and logging to track deployments and identify potential issues.
Step 5: Full Migration
Once testing is complete and you’re confident in the reliability of your Waypoint configuration, proceed with the full migration to your production environment. Remember to follow your organization’s change management procedures.
Terraform Waypoint Migration: Best Practices
- Modularization: Break down your Terraform code into smaller, reusable modules for easier management and maintenance.
- Version Control: Use Git for version control to track changes and collaborate effectively.
- Testing: Implement comprehensive testing strategies, including unit, integration, and end-to-end tests.
- Automation: Automate as much of the process as possible to reduce manual intervention and human error.
- Documentation: Maintain detailed documentation for your Terraform code and Waypoint configuration.
Frequently Asked Questions
Q1: What are the potential challenges during Terraform Waypoint migration?
Potential challenges include compatibility issues between your existing infrastructure and Waypoint, the need to adapt your existing Terraform code, and the learning curve associated with using Waypoint. Thorough planning and testing can mitigate these challenges.
Q2: How does Waypoint handle secrets management during deployment?
Waypoint integrates with various secrets management solutions, allowing you to securely store and manage sensitive information used during deployments. Consult the official Waypoint documentation for detailed information on integrating with specific secrets management tools. Waypoint Configuration Reference
Q3: Can I use Waypoint with different cloud providers?
Yes, Waypoint supports multiple cloud providers, including AWS, Google Cloud Platform (GCP), and Azure. You can configure Waypoint to deploy to different cloud providers by specifying the appropriate platform in your waypoint.hcl file.
Q4: What happens if my Terraform Waypoint migration fails?
Waypoint provides robust error handling and logging capabilities. In case of failure, you’ll receive detailed error messages that help you identify and troubleshoot the problem. Waypoint also allows for rollbacks to previous deployments, minimizing downtime.

Conclusion
Migrating your Terraform deployments to Waypoint can significantly improve your infrastructure management. By implementing the strategies and best practices outlined in this guide, you can streamline your workflows, enhance security, and achieve a more efficient and reliable infrastructure. Remember that careful planning and thorough testing are crucial for a successful Terraform Waypoint migration. Start small, test rigorously, and gradually migrate your infrastructure to reap the benefits of Waypoint’s powerful features. Thank you for reading the DevopsRoles page!