I still remember the sweat pouring down my neck during our massive 2021 Black Friday crash. Our Kubernetes HPA was supposed to be our safety net. It completely failed us.
Traffic spiked 500% in a matter of seconds. Alerts screamed in Slack.
But the pods just sat there. Doing absolutely nothing. Why? Because by the time the autoscaler realized we were drowning, the nodes were already choking and dropping requests.

Why Your Kubernetes HPA Is Failing You Right Now
Most engineers assume autoscaling is instant. It isn’t.
The harsh reality is that out-of-the-box autoscaling is incredibly lazy. You think you are protected against sudden spikes. You are actually protected against slow, predictable, 15-minute ramps.
Let’s look at the math behind the delay.
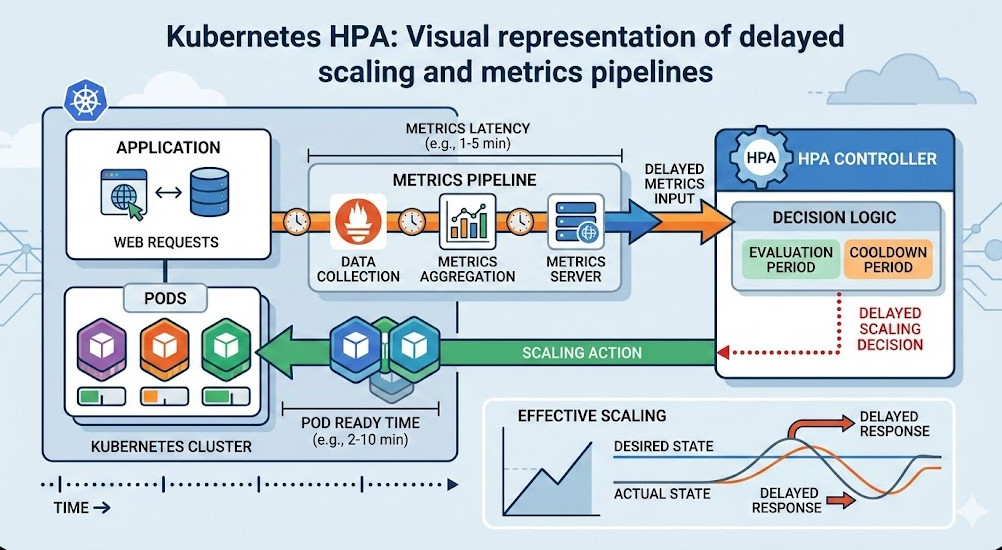
The Default Kubernetes HPA Pipeline is Slow
When a sudden surge of traffic hits your ingress controller, the CPU on your pods spikes immediately. But your cluster doesn’t know that yet.
First, the cAdvisor runs inside the kubelet. It scrapes container metrics every 10 to 15 seconds.
Then, the metrics-server polls the kubelet. By default, this happens every 60 seconds.
The Hidden Timers in Kubernetes HPA
We aren’t done counting the delays.
The controller manager, which actually calculates the scaling decisions, checks the metrics-server. The default `horizontal-pod-autoscaler-sync-period` is 15 seconds.
So, what’s our worst-case scenario before a scale-up is even triggered?
- 15 seconds for cAdvisor.
- 60 seconds for metrics-server.
- 15 seconds for the controller manager.
That is 90 seconds. A minute and a half of pure downtime before the control plane even requests a new pod. Can your business survive 90 seconds of dropped checkout requests? Mine couldn’t.
The Pod Startup Penalty
And let’s be real. Triggering the scale-up isn’t the end of the story.
Once the Kubernetes HPA updates the deployment, the scheduler has to find a node. If no nodes are available, the Cluster Autoscaler has to provision a new VM.
In AWS or GCP, a new node takes 2 to 3 minutes to spin up. Then your app has to pull the image, start up, and pass readiness probes.
You are looking at a 4 to 5 minute delay from traffic spike to actual relief. That is why you are scaling too late.
Tuning Your Kubernetes HPA Controller
So, how do we fix this mess?
Your first line of defense is tweaking the control plane flags. If you manage your own control plane, you can drastically reduce the sync periods.
You need to modify the kube-controller-manager arguments.
# Example control plane configuration tweaks
spec:
  containers:
  - command:
    - kube-controller-manager
    - --horizontal-pod-autoscaler-sync-period=5s
    - --horizontal-pod-autoscaler-downscale-stabilization=300s
By dropping the sync period to 5 seconds, you shave 10 seconds off the reaction time. It’s a small win, but every second counts when CPUs are maxing out.
If you are on a managed service like EKS or GKE, you usually can’t touch these flags. You need a different strategy.
Moving Beyond CPU: Why Custom Metrics Save Kubernetes HPA
Relying on CPU and Memory for autoscaling is a trap.
CPU is a lagging indicator. By the time CPU usage crosses your 80% threshold, the application is already struggling. Context switching increases. Latency skyrockets.
You need to scale on leading indicators. What’s a leading indicator? HTTP request queues. Kafka lag. RabbitMQ queue depth.
Setting Up the Prometheus Adapter
To scale on external metrics, you need to bridge the gap between Prometheus and your Kubernetes HPA.
This is where the Prometheus Adapter comes in. It translates PromQL queries into a format the custom metrics API can understand.
Let’s say we want to scale based on HTTP requests per second hitting our NGINX ingress.
# Kubernetes HPA Custom Metric Example
apiVersion: autoscaling/v2
kind: HorizontalPodAutoscaler
metadata:
  name: frontend-hpa
spec:
  scaleTargetRef:
    apiVersion: apps/v1
    kind: Deployment
    name: frontend
  minReplicas: 2
  maxReplicas: 50
  metrics:
  - type: Object
    object:
      metric:
        name: requests-per-second
      describedObject:
        apiVersion: networking.k8s.io/v1
        kind: Ingress
        name: main-route
      target:
        type: Value
        value: 100
Now, as soon as the ingress controller sees the traffic spike, the autoscaler acts. We don’t wait for the app’s CPU to choke.
We scale proactively based on the actual load hitting the front door.
The Ultimate Fix: Replacing Vanilla Kubernetes HPA with KEDA
Even with custom metrics, the native autoscaler can feel clunky.
Setting up the Prometheus adapter is tedious. Managing API service registrations is a headache. I got tired of maintaining it.
Enter KEDA: Kubernetes Event-driven Autoscaling.
KEDA is a CNCF project that acts as an aggressive steroid injection for your autoscaler. It natively understands dozens of external triggers. [Internal Link: Advanced KEDA Deployment Strategies].
How KEDA Changes the Game
KEDA doesn’t replace the native autoscaler; it feeds it. KEDA manages the custom metrics API for you.
More importantly, KEDA introduces the concept of scaling to zero. The native Kubernetes HPA cannot scale below 1 replica. KEDA can, which saves massive amounts of money on cloud bills.
Look at how easy it is to scale based on a Redis list length with KEDA:
apiVersion: keda.sh/v1alpha1
kind: ScaledObject
metadata:
  name: redis-worker-scaler
spec:
  scaleTargetRef:
    name: worker-deployment
  minReplicaCount: 0
  maxReplicaCount: 100
  triggers:
  - type: redis
    metadata:
      address: redis-master.default.svc.cluster.local:6379
      listName: task-queue
      listLength: "50"
If the queue hits 50, KEDA instantly cranks up the replicas. No waiting for 90-second internal polling loops.
Mastering the Kubernetes HPA Behavior API
Let’s talk about thrashing.
Thrashing happens when your autoscaler panics. It scales up rapidly, the load averages out, and then it immediately scales back down. Then it spikes again. Up, down, up, down.
This wreaks havoc on your node pools and network infrastructure.
To fix this, Kubernetes v1.18 introduced the behavior field. This is the most underutilized feature in modern cluster management.
The Dreaded Scale-Down Thrash
We can use the behavior block to force the Kubernetes HPA to scale up aggressively, but scale down very slowly.
This ensures we handle the spike, but don’t terminate pods prematurely if the traffic dips for just a few seconds.
# HPA Behavior Configuration
spec:
  behavior:
    scaleDown:
      stabilizationWindowSeconds: 300
      policies:
      - type: Percent
        value: 10
        periodSeconds: 60
    scaleUp:
      stabilizationWindowSeconds: 0
      policies:
      - type: Percent
        value: 100
        periodSeconds: 15
      - type: Pods
        value: 4
        periodSeconds: 15
      selectPolicy: Max
What does this configuration do?
For scaling up, we set the stabilization window to 0. We want zero delay. It will double the number of pods (100%) or add 4 pods every 15 seconds, whichever is greater.
For scaling down, we force a 300-second (5 minute) cooldown. And it will only remove 10% of the pods per minute. This provides a soft landing after a traffic spike.
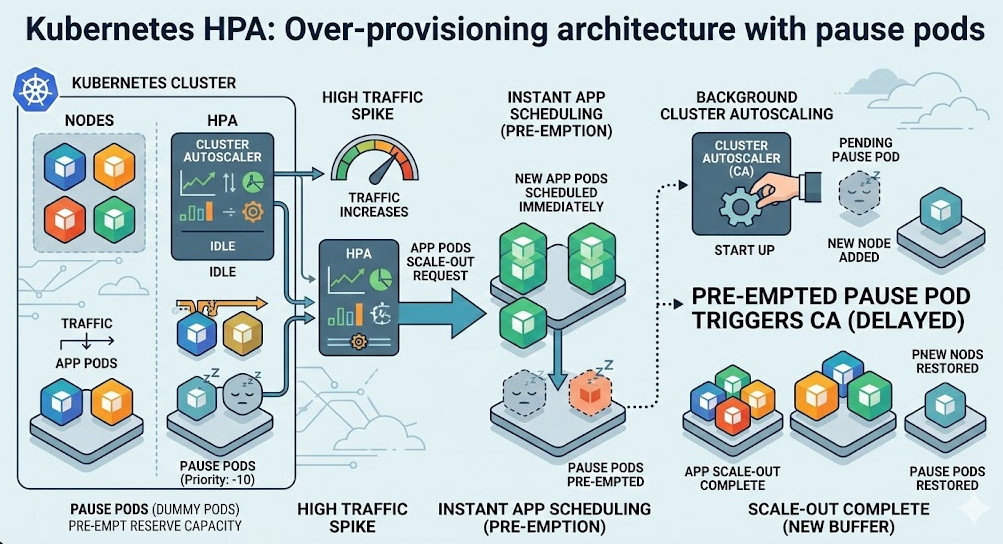
Over-Provisioning: The Dirty Secret of Kubernetes Autoscaling
Even if you perfectly tune your Kubernetes HPA and use KEDA, you still have the node provisioning problem.
If your cluster runs out of room, your pending pods will wait 3 minutes for a new EC2 instance to boot.
The secret weapon here is over-provisioning using pause pods.
You run low-priority “dummy” pods in your cluster that do nothing but sleep. When a real traffic spike hits, the autoscaler creates high-priority application pods.
The scheduler immediately evicts the dummy pods, placing your critical application pods onto the nodes instantly.
The Cluster Autoscaler then replaces the dummy pods in the background. Your application never waits for a VM to boot.

FAQ Section: Kubernetes HPA Troubleshooting
- Why is my HPA showing unknown metrics? This usually means the metrics-server is crashing, or the Prometheus adapter cannot resolve your PromQL query. Check the pod logs for the adapter.
- Can I use multiple metrics in one HPA? Yes. The Kubernetes HPA will evaluate all metrics and scale based on the metric that proposes the highest number of replicas.
- Why is my deployment not scaling down? Check your `stabilizationWindowSeconds`. Also, ensure that no custom metrics are returning high baseline values due to background noise.
For a deeper dive into the exact scenarios of late scaling, you should read the original deep dive documentation and article here.
Conclusion: Relying on default settings is a recipe for disaster. If you are blindly trusting CPU metrics to save you during a traffic spike, you are playing Russian roulette with your uptime.
Take control of your autoscaling. Move to leading indicators, master the behavior API, and stop letting your Kubernetes HPA scale too late. Thank you for reading the DevopsRoles page!