Kubernetes has revolutionized how we deploy and manage applications, but its power and flexibility come with significant complexity, especially regarding security. For developers and DevOps engineers, navigating the myriad of security controls can be daunting. This is where a Kubernetes Security Diagram becomes an invaluable tool. It provides a mental model and a visual cheatsheet to understand the layered nature of K8s security, helping you build more resilient and secure applications from the ground up. This article will break down the components of a comprehensive security diagram, focusing on practical steps you can take at every layer.
Why a Kubernetes Security Diagram is Essential
A secure system is built in layers, like an onion. A failure in one layer should be contained by the next. Kubernetes is no different. Its architecture is inherently distributed and multi-layered, spanning from the physical infrastructure to the application code running inside a container. A diagram helps to:
Visualize Attack Surfaces: It allows teams to visually map potential vulnerabilities at each layer of the stack.
Clarify Responsibilities: In a cloud environment, the shared responsibility model can be confusing. A diagram helps delineate where the cloud provider’s responsibility ends and yours begins.
Enable Threat Modeling: By understanding how components interact, you can more effectively brainstorm potential threats and design appropriate mitigations.
Improve Communication: It serves as a common language for developers, operations, and security teams to discuss and improve the overall K8s security posture.
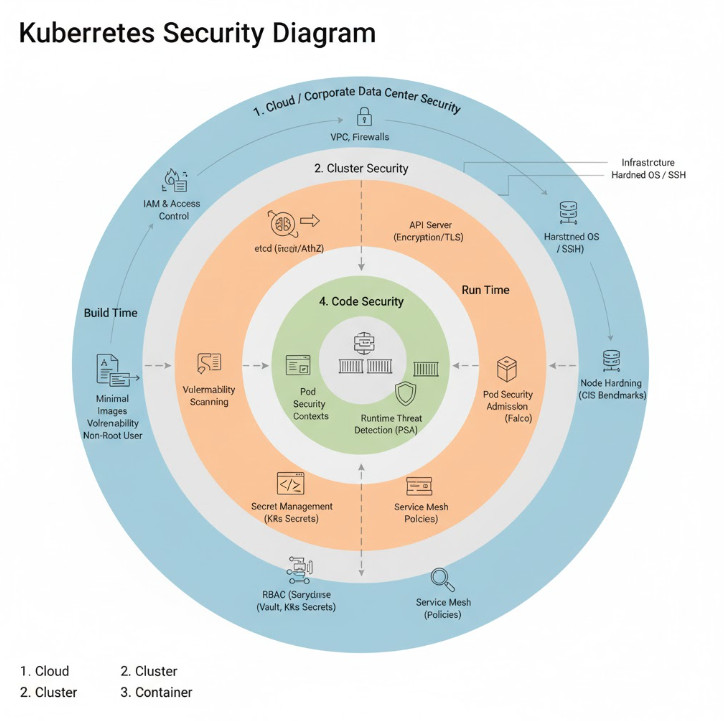
The most effective way to structure this diagram is by following the “4Cs of Cloud Native Security” model: Cloud, Cluster, Container, and Code. Let’s break down each layer.
Deconstructing the Kubernetes Security Diagram: The 4Cs
Imagine your Kubernetes environment as a set of concentric circles. The outermost layer is the Cloud (or your corporate data center), and the innermost is your application Code. Securing the system means applying controls at each of these boundaries.
Layer 1: Cloud / Corporate Data Center Security
This is the foundation upon which everything else is built. If your underlying infrastructure is compromised, no amount of cluster-level security can save you. Security at this layer involves hardening the environment where your Kubernetes nodes run.
Key Controls:
Network Security: Isolate your cluster’s network using Virtual Private Clouds (VPCs), subnets, and firewalls (Security Groups in AWS, Firewall Rules in GCP). Restrict all ingress and egress traffic to only what is absolutely necessary.
IAM and Access Control: Apply the principle of least privilege to the cloud provider’s Identity and Access Management (IAM). Users and service accounts that interact with the cluster infrastructure (e.g., creating nodes, modifying load balancers) should have the minimum required permissions.
Infrastructure Hardening: Ensure the virtual machines or bare-metal servers acting as your nodes are secure. This includes using hardened OS images, managing SSH key access tightly, and ensuring physical security if you’re in a private data center.
Provider-Specific Best Practices: Leverage security services offered by your cloud provider. For example, use AWS’s Key Management Service (KMS) for encrypting EBS volumes used by your nodes. Following frameworks like the AWS Well-Architected Framework is crucial.
Layer 2: Cluster Security
This layer focuses on securing the Kubernetes components themselves. It’s about protecting both the control plane (the “brains”) and the worker nodes (the “muscle”).
Control Plane Security
API Server: This is the gateway to your cluster. Secure it by enabling strong authentication (e.g., client certificates, OIDC) and authorization (RBAC). Disable anonymous access and limit access to trusted networks.
etcd Security: The `etcd` datastore holds the entire state of your cluster, including secrets. It must be protected. Encrypt `etcd` data at rest, enforce TLS for all client communication, and strictly limit access to only the API server.
Kubelet Security: The Kubelet is the agent running on each worker node. Use flags like --anonymous-auth=false and --authorization-mode=Webhook to prevent unauthorized requests.
Worker Node & Network Security
Node Hardening: Run CIS (Center for Internet Security) benchmarks against your worker nodes to identify and remediate security misconfigurations.
Network Policies: By default, all pods in a cluster can communicate with each other. This is a security risk. Use NetworkPolicy resources to implement network segmentation and restrict pod-to-pod communication based on labels.
Here’s an example of a NetworkPolicy that only allows ingress traffic from pods with the label app: frontend to pods with the label app: backend on port 8080.
This layer is all about securing the individual workloads running in your cluster. Security must be addressed both at build time (the container image) and at run time (the running container).
Image Security (Build Time)
Use Minimal Base Images: Start with the smallest possible base image (e.g., Alpine, or “distroless” images from Google). Fewer packages mean a smaller attack surface.
Vulnerability Scanning: Integrate image scanners (like Trivy, Clair, or Snyk) into your CI/CD pipeline to detect and block images with known vulnerabilities before they are ever pushed to a registry.
Don’t Run as Root: Define a non-root user in your Dockerfile and use the USER instruction.
Runtime Security
Security Contexts: Use Kubernetes SecurityContext to define privilege and access control settings for a Pod or Container. This is your most powerful tool for hardening workloads at runtime.
Pod Security Admission (PSA): The successor to Pod Security Policies, PSA enforces security standards (like Privileged, Baseline, Restricted) at the namespace level, preventing insecure pods from being created.
Runtime Threat Detection: Deploy tools like Falco or other commercial solutions to monitor container behavior in real-time and detect suspicious activity (e.g., a shell spawning in a container, unexpected network connections).
This manifest shows a pod with a restrictive securityContext, ensuring it runs as a non-root user with a read-only filesystem.
apiVersion: v1
kind: Pod
metadata:
  name: secure-pod-example
spec:
  containers:
  - name: nginx
    image: nginx:1.21
    securityContext:
      runAsNonRoot: true
      runAsUser: 1001
      allowPrivilegeEscalation: false
      readOnlyRootFilesystem: true
      capabilities:
        drop:
        - "ALL"
  # You need a writable volume for temporary files
  volumes:
  - name: tmp
    emptyDir: {}
Layer 4: Code Security
The final layer is the application code itself. A secure infrastructure can still be compromised by a vulnerable application.
Key Controls:
Secret Management: Never hardcode secrets (API keys, passwords, certificates) in your container images or manifests. Use Kubernetes Secrets, or for more robust security, integrate an external secrets manager like HashiCorp Vault or AWS Secrets Manager.
Role-Based Access Control (RBAC): If your application needs to talk to the Kubernetes API, grant it the bare minimum permissions required using a dedicated ServiceAccount, Role, and RoleBinding.
Service Mesh: For complex microservices architectures, consider using a service mesh like Istio or Linkerd. A service mesh can enforce mutual TLS (mTLS) for all service-to-service communication, provide fine-grained traffic control policies, and improve observability.
Here is an example of an RBAC Role that only allows a ServiceAccount to get and list pods in the default namespace.
apiVersion: rbac.authorization.k8s.io/v1
kind: Role
metadata:
  namespace: default
  name: pod-reader
rules:
- apiGroups: [""] # "" indicates the core API group
  resources: ["pods"]
  verbs: ["get", "list", "watch"]
---
apiVersion: rbac.authorization.k8s.io/v1
kind: RoleBinding
metadata:
  name: read-pods
  namespace: default
subjects:
- kind: ServiceAccount
  name: my-app-sa # The ServiceAccount used by your application
  apiGroup: ""
roleRef:
  kind: Role
  name: pod-reader
  apiGroup: rbac.authorization.k8s.io
Frequently Asked Questions
What is the most critical layer in Kubernetes security?
Every layer is critical. A defense-in-depth strategy is essential. However, the Cloud/Infrastructure layer is the foundation. A compromise at this level can undermine all other security controls you have in place.
How do Network Policies improve Kubernetes security?
They enforce network segmentation at Layer 3/4 (IP/port). By default, Kubernetes has a flat network where any pod can talk to any other pod. Network Policies act as a firewall for your pods, ensuring that workloads can only communicate with the specific services they are authorized to, drastically reducing the “blast radius” of a potential compromise.
What is the difference between Pod Security Admission (PSA) and Security Context?
SecurityContext is a setting within a Pod’s manifest that defines the security parameters for that specific workload (e.g., runAsNonRoot). Pod Security Admission (PSA) is a cluster-level admission controller that enforces security standards across namespaces. PSA acts as a gatekeeper, preventing pods that don’t meet a certain security standard (e.g., those requesting privileged access) from even being created in the first place.
Conclusion
Securing Kubernetes is not a one-time task but an ongoing process that requires vigilance at every layer of the stack. Thinking in terms of a layered defense model, as visualized by a Kubernetes Security Diagram based on the 4Cs, provides a powerful framework for developers and operators. It helps transform a complex ecosystem into a manageable set of security domains. By systematically applying controls at the Cloud, Cluster, Container, and Code layers, you can build a robust K8s security posture and confidently deploy your applications in production. Thank you for reading the DevopsRoles page!
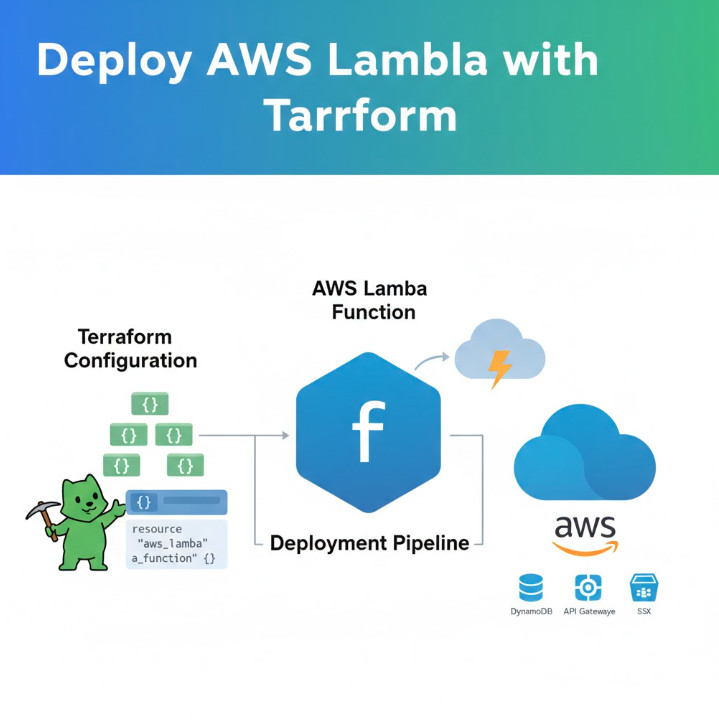
In the world of cloud computing, serverless architectures and Infrastructure as Code (IaC) are two paradigms that have revolutionized how we build and manage applications. AWS Lambda, a leading serverless compute service, allows you to run code without provisioning servers. Terraform, an open-source IaC tool, enables you to define and manage infrastructure with code. Combining them is a match made in DevOps heaven. This guide provides a deep dive into deploying, managing, and automating your serverless functions with AWS Lambda Terraform, transforming your workflow from manual clicks to automated, version-controlled deployments.
Why Use Terraform for AWS Lambda Deployments?
While you can easily create a Lambda function through the AWS Management Console, this approach doesn’t scale and is prone to human error. Using Terraform to manage your Lambda functions provides several key advantages:
Repeatability and Consistency: Define your Lambda function, its permissions, triggers, and environment variables in code. This ensures you can deploy the exact same configuration across different environments (dev, staging, prod) with a single command.
Version Control: Store your infrastructure configuration in a Git repository. This gives you a full history of changes, the ability to review updates through pull requests, and the power to roll back to a previous state if something goes wrong.
Automation: Integrate your Terraform code into CI/CD pipelines to fully automate the deployment process. A `git push` can trigger a pipeline that plans, tests, and applies your infrastructure changes seamlessly.
Full Ecosystem Management: Lambda functions rarely exist in isolation. They need IAM roles, API Gateway triggers, S3 bucket events, or DynamoDB streams. Terraform allows you to define and manage this entire ecosystem of related resources in a single, cohesive configuration.
Prerequisites
Before we start writing code, make sure you have the following tools installed and configured on your system:
AWS Account: An active AWS account with permissions to create IAM roles and Lambda functions.
AWS CLI: The AWS Command Line Interface installed and configured with your credentials (e.g., via `aws configure`).
Terraform: The Terraform CLI (version 1.0 or later) installed.
A Code Editor: A text editor or IDE like Visual Studio Code.
Python 3: We’ll use Python for our example Lambda function, so ensure you have a recent version installed.
Core Components of an AWS Lambda Terraform Deployment
A typical serverless deployment involves more than just the function code. With Terraform, we define each piece as a resource. Let’s break down the essential components.
1. The Lambda Function Code (Python Example)
This is the actual application logic you want to run. For this guide, we’ll use a simple “Hello World” function in Python.
# src/lambda_function.py
import json

def lambda_handler(event, context):
    print("Lambda function invoked!")
    return {
        'statusCode': 200,
        'body': json.dumps('Hello from Lambda deployed by Terraform!')
    }
2. The Deployment Package (.zip)
AWS Lambda requires your code and its dependencies to be uploaded as a deployment package, typically a `.zip` file. Instead of creating this file manually, we can use Terraform’s built-in `archive_file` data source to do it automatically during the deployment process.
# main.tf
data "archive_file" "lambda_zip" {
  type        = "zip"
  source_dir  = "${path.module}/src"
  output_path = "${path.module}/dist/lambda_function.zip"
}
3. The IAM Role and Policy
Every Lambda function needs an execution role. This is an IAM role that grants the function permission to interact with other AWS services. At a minimum, it needs permission to write logs to Amazon CloudWatch. We define the role and attach a policy to it.
# main.tf

# IAM role that the Lambda function will assume
resource "aws_iam_role" "lambda_exec_role" {
  name = "lambda_basic_execution_role"

  assume_role_policy = jsonencode({
    Version   = "2012-10-17",
    Statement = [
      {
        Action    = "sts:AssumeRole",
        Effect    = "Allow",
        Principal = {
          Service = "lambda.amazonaws.com"
        }
      }
    ]
  })
}

# Attaching the basic execution policy to the role
resource "aws_iam_role_policy_attachment" "lambda_policy_attachment" {
  role       = aws_iam_role.lambda_exec_role.name
  policy_arn = "arn:aws:iam::aws:policy/service-role/AWSLambdaBasicExecutionRole"
}
The `assume_role_policy` document specifies that the AWS Lambda service is allowed to “assume” this role. We then attach the AWS-managed `AWSLambdaBasicExecutionRole` policy, which provides the necessary CloudWatch Logs permissions. For more details, refer to the official documentation on AWS Lambda Execution Roles.
4. The Lambda Function Resource (`aws_lambda_function`)
This is the central resource that ties everything together. It defines the Lambda function itself, referencing the IAM role and the deployment package.
# main.tf
resource "aws_lambda_function" "hello_world_lambda" {
  function_name = "HelloWorldLambdaTerraform"

  # Reference to the zipped deployment package
  filename         = data.archive_file.lambda_zip.output_path
  source_code_hash = data.archive_file.lambda_zip.output_base64sha256

  # Reference to the IAM role
  role = aws_iam_role.lambda_exec_role.arn

  # Function configuration
  handler = "lambda_function.lambda_handler" # filename.handler_function_name
  runtime = "python3.9"
}
Notice the `source_code_hash` argument. This is crucial. It tells Terraform to trigger a new deployment of the function only when the content of the `.zip` file changes.
Step-by-Step Guide: Your First AWS Lambda Terraform Project
Let’s put all the pieces together into a working project.
Step 1: Project Structure
Create a directory for your project with the following structure:
Place the simple Python “Hello World” code into `src/lambda_function.py` as shown in the previous section.
Step 3: Defining the Full Terraform Configuration
Combine all the Terraform snippets into your `main.tf` file. This single file will define our entire infrastructure.
# main.tf

# Configure the AWS provider
provider "aws" {
  region = "us-east-1" # Change to your preferred region
}

# 1. Create a zip archive of our Python code
data "archive_file" "lambda_zip" {
  type        = "zip"
  source_dir  = "${path.module}/src"
  output_path = "${path.module}/dist/lambda_function.zip"
}

# 2. Create the IAM role for the Lambda function
resource "aws_iam_role" "lambda_exec_role" {
  name = "lambda_basic_execution_role"

  assume_role_policy = jsonencode({
    Version   = "2012-10-17",
    Statement = [
      {
        Action    = "sts:AssumeRole",
        Effect    = "Allow",
        Principal = {
          Service = "lambda.amazonaws.com"
        }
      }
    ]
  })
}

# 3. Attach the basic execution policy to the role
resource "aws_iam_role_policy_attachment" "lambda_policy_attachment" {
  role       = aws_iam_role.lambda_exec_role.name
  policy_arn = "arn:aws:iam::aws:policy/service-role/AWSLambdaBasicExecutionRole"
}

# 4. Create the Lambda function resource
resource "aws_lambda_function" "hello_world_lambda" {
  function_name = "HelloWorldLambdaTerraform"

  filename         = data.archive_file.lambda_zip.output_path
  source_code_hash = data.archive_file.lambda_zip.output_base64sha256

  role    = aws_iam_role.lambda_exec_role.arn
  handler = "lambda_function.lambda_handler"
  runtime = "python3.9"

  # Ensure the IAM role is created before the Lambda function
  depends_on = [
    aws_iam_role_policy_attachment.lambda_policy_attachment,
  ]

  tags = {
    ManagedBy = "Terraform"
  }
}

# 5. Output the Lambda function name
output "lambda_function_name" {
  value = aws_lambda_function.hello_world_lambda.function_name
}
Step 4: Deploying the Infrastructure
Now, open your terminal in the `my-lambda-project` directory and run the standard Terraform workflow commands:
Initialize Terraform: This downloads the necessary AWS provider plugin.
terraform init
Plan the deployment: This shows you what resources Terraform will create. It’s a dry run.
terraform plan
Apply the changes: This command actually creates the resources in your AWS account.
terraform apply
Terraform will prompt you to confirm the action. Type `yes` and hit Enter. After a minute, your IAM role and Lambda function will be deployed!
Step 5: Invoking and Verifying the Lambda Function
You can invoke your newly deployed function directly from the AWS CLI:
This command calls the function and saves the response to `output.json`. If you inspect the file (`cat output.json`), you should see:
{"statusCode": 200, "body": "\"Hello from Lambda deployed by Terraform!\""}
Success! You’ve just automated a serverless deployment.
Advanced Concepts and Best Practices
Let’s explore some more advanced topics to make your AWS Lambda Terraform deployments more robust and feature-rich.
Managing Environment Variables
You can securely pass configuration to your Lambda function using environment variables. Simply add an `environment` block to your `aws_lambda_function` resource.
A common use case is to trigger a Lambda function via an HTTP request. Terraform can manage the entire API Gateway setup for you. Here’s a minimal example of creating an HTTP endpoint that invokes our function.
# Create the API Gateway
resource "aws_apigatewayv2_api" "lambda_api" {
  name          = "lambda-gw-api"
  protocol_type = "HTTP"
}

# Create the integration between API Gateway and Lambda
resource "aws_apigatewayv2_integration" "lambda_integration" {
  api_id           = aws_apigatewayv2_api.lambda_api.id
  integration_type = "AWS_PROXY"
  integration_uri  = aws_lambda_function.hello_world_lambda.invoke_arn
}

# Define the route (e.g., GET /hello)
resource "aws_apigatewayv2_route" "api_route" {
  api_id    = aws_apigatewayv2_api.lambda_api.id
  route_key = "GET /hello"
  target    = "integrations/${aws_apigatewayv2_integration.lambda_integration.id}"
}

# Grant API Gateway permission to invoke the Lambda
resource "aws_lambda_permission" "api_gw_permission" {
  statement_id  = "AllowAPIGatewayInvoke"
  action        = "lambda:InvokeFunction"
  function_name = aws_lambda_function.hello_world_lambda.function_name
  principal     = "apigateway.amazonaws.com"
  source_arn    = "${aws_apigatewayv2_api.lambda_api.execution_arn}/*/*"
}

output "api_endpoint" {
  value = aws_apigatewayv2_api.lambda_api.api_endpoint
}
Frequently Asked Questions
How do I handle function updates with Terraform?
Simply change your Python code in the `src` directory. The next time you run `terraform plan` and `terraform apply`, the `archive_file` data source will compute a new `source_code_hash`, and Terraform will automatically upload the new version of your code.
What’s the best way to manage secrets for my Lambda function?
Avoid hardcoding secrets in Terraform files or environment variables. The best practice is to use AWS Secrets Manager or AWS Systems Manager Parameter Store. You can grant your Lambda’s execution role permission to read from these services and fetch secrets dynamically at runtime.
Can I use Terraform to manage multiple Lambda functions in one project?
Absolutely. You can define multiple `aws_lambda_function` resources. For better organization, consider using Terraform modules to create reusable templates for your Lambda functions, each with its own code, IAM role, and configuration.
How does the `source_code_hash` argument work?
It’s a base64-encoded SHA256 hash of the content of your deployment package. Terraform compares the hash in your state file with the newly computed hash from the `archive_file` data source. If they differ, Terraform knows the code has changed and initiates an update to the Lambda function. For more details, consult the official Terraform documentation.
Conclusion
You have successfully configured, deployed, and invoked a serverless function using an Infrastructure as Code approach. By leveraging Terraform, you’ve created a process that is automated, repeatable, and version-controlled. This foundation is key to building complex, scalable, and maintainable serverless applications on AWS. Adopting an AWS Lambda Terraform workflow empowers your team to move faster and with greater confidence, eliminating manual configuration errors and providing a clear, auditable history of your infrastructure’s evolution. Thank you for reading the DevopsRoles page!
The open-source community is eagerly anticipating the next major release from one of its most foundational projects. Codenamed ‘Trixie’, the upcoming Debian 13 Linux is set to be a landmark update, and this guide will explore the key features that make this release essential for all users.
‘Trixie’ promises a wealth of improvements, from critical security enhancements to a more polished user experience. It will feature a modern kernel, an updated software toolchain, and refreshed desktop environments, ensuring a more powerful and efficient system from the ground up.
For the professionals who depend on Debian’s legendary stability—including system administrators, DevOps engineers, and developers—understanding these changes is crucial. We will unpack what makes this a release worth watching and preparing for.
The Road to Debian 13 “Trixie”: Release Cycle and Expectations
Before diving into the new features, it’s helpful to understand where ‘Trixie’ fits within Debian’s methodical release process. This process is the very reason for its reputation as a rock-solid distribution.
Understanding the Debian Release Cycle
Debian’s development is split into three main branches:
Stable: This is the official release, currently Debian 12 ‘Bookworm’. It receives long-term security support and is recommended for production environments.
Testing: This branch contains packages that are being prepared for the next stable release. Right now, ‘Trixie’ is the testing distribution.
Unstable (Sid): This is the development branch where new packages are introduced and initial testing occurs.
Packages migrate from Unstable to Testing after meeting certain criteria, such as a lack of release-critical bugs. Eventually, the Testing branch is “frozen,” signaling the final phase of development before it becomes the new Stable release.
Projected Release Date for Debian 13 Linux
The Debian Project doesn’t operate on a fixed release schedule, but it has consistently followed a two-year cycle for major releases. Debian 12 ‘Bookworm’ was released in June 2023. Following this pattern, we can expect Debian 13 ‘Trixie’ to be released in mid-2025. The development freeze will likely begin in early 2025, giving developers and users a clear picture of the final feature set.
What’s New? Core System and Kernel Updates in Debian 13 Linux
The core of any Linux distribution is its kernel and system libraries. ‘Trixie’ will bring significant updates in this area, enhancing performance, hardware support, and security.
The Heart of Trixie: A Modern Linux Kernel
Debian 13 is expected to ship with a much newer Linux Kernel, likely version 6.8 or newer. This is a massive leap forward, bringing a host of improvements:
Expanded Hardware Support: Better support for the latest Intel and AMD CPUs, new GPUs (including Intel Battlemage and AMD RDNA 3), and emerging technologies like Wi-Fi 7.
Performance Enhancements: The new kernel includes numerous optimizations to the scheduler, I/O handling, and networking stack, resulting in a more responsive and efficient system.
Filesystem Improvements: Significant updates for filesystems like Btrfs and EXT4, including performance boosts and new features.
Enhanced Security: Newer kernels incorporate the latest security mitigations for hardware vulnerabilities and provide more robust security features.
Toolchain and Core Utilities Upgrade
The core toolchain—the set of programming tools used to create the operating system itself—is receiving a major refresh. We anticipate updated versions of:
GCC (GNU Compiler Collection): Likely version 13 or 14, offering better C++20/23 standard support, improved diagnostics, and better code optimization.
Glibc (GNU C Library): A newer version will provide critical bug fixes, performance improvements, and support for new kernel features.
Binutils: Updated versions of tools like the linker (ld) and assembler (as) are essential for building modern software.
These updates are vital for developers who need to build and run software on a modern, secure, and performant platform.
A Refreshed Desktop Experience: DE Updates
Debian isn’t just for servers; it’s also a powerful desktop operating system. ‘Trixie’ will feature the latest versions of all major desktop environments, offering a more polished and feature-rich user experience.
GNOME 47/48: A Modernized Interface
Debian’s default desktop, GNOME, will likely be updated to version 47 or 48. Users can expect continued refinement of the user interface, improved Wayland support, better performance, and enhancements to core apps like Nautilus (Files) and the GNOME Software center. The focus will be on usability, accessibility, and a clean, modern aesthetic.
KDE Plasma 6: The Wayland-First Future
One of the most exciting updates will be the inclusion of KDE Plasma 6. This is a major milestone for the KDE project, built on the new Qt 6 framework. Key highlights include:
Wayland by Default: Plasma 6 defaults to the Wayland display protocol, offering smoother graphics, better security, and superior handling of modern display features like fractional scaling.
Visual Refresh: A cleaner, more modern look and feel with updated themes and components.
Core App Rewrite: Many core KDE applications have been ported to Qt 6, improving performance and maintainability.
Updates for XFCE, MATE, and Other Environments
Users of other desktop environments won’t be left out. Debian 13 will include the latest stable versions of XFCE, MATE, Cinnamon, and LXQt, all benefiting from their respective upstream improvements, bug fixes, and feature additions.
For Developers and SysAdmins: Key Package Upgrades
Debian 13 will be an excellent platform for development and system administration, thanks to updated versions of critical software packages.
Programming Languages and Runtimes
Expect the latest stable versions of major programming languages, including:
Python 3.12+
PHP 8.3+
Ruby 3.2+
Node.js 20+ (LTS) or newer
Perl 5.38+
Server Software and Databases
Server administrators will appreciate updated versions of essential software:
Apache 2.4.x
Nginx 1.24.x+
PostgreSQL 16+
MariaDB 10.11+
These updates bring not just new features but also crucial security patches and performance optimizations, ensuring that servers running Debian remain secure and efficient. Maintaining up-to-date systems is a core principle recommended by authorities like the Cybersecurity and Infrastructure Security Agency (CISA).
How to Prepare for the Upgrade to Debian 13
While the final release is still some time away, it’s never too early to plan. A smooth upgrade from Debian 12 to Debian 13 requires careful preparation.
Best Practices for a Smooth Transition
Backup Everything: Before attempting any major upgrade, perform a full backup of your system and critical data. Tools like rsync or dedicated backup solutions are your best friend.
Update Your Current System: Ensure your Debian 12 system is fully up-to-date. Run sudo apt update && sudo apt full-upgrade and resolve any pending issues.
Read the Release Notes: Once they are published, read the official Debian 13 release notes thoroughly. They will contain critical information about potential issues and configuration changes.
A Step-by-Step Upgrade Command Sequence
When the time comes, the upgrade process involves changing your APT sources and running the upgrade commands. First, edit your /etc/apt/sources.list file and any files in /etc/apt/sources.list.d/, changing every instance of bookworm (Debian 12) to trixie (Debian 13).
After modifying your sources, execute the following commands in order:
# Step 1: Update the package lists with the new 'trixie' sources
sudo apt update

# Step 2: Perform a minimal system upgrade first
# This upgrades packages that can be updated without removing or installing others
sudo apt upgrade --without-new-pkgs

# Step 3: Perform the full system upgrade to Debian 13
# This will handle changing dependencies, installing new packages, and removing obsolete ones
sudo apt full-upgrade

# Step 4: Clean up obsolete packages
sudo apt autoremove

# Step 5: Reboot into your new Debian 13 system
sudo reboot
Frequently Asked Questions
When will Debian 13 “Trixie” be released?
Based on Debian’s typical two-year release cycle, the stable release of Debian 13 is expected in mid-2025.
What Linux kernel version will Debian 13 use?
It is expected to ship with a modern kernel, likely version 6.8 or a newer long-term support (LTS) version available at the time of the freeze.
Is it safe to upgrade from Debian 12 to Debian 13 right after release?
For production systems, it is often wise to wait a few weeks or for the first point release (e.g., 13.1) to allow any early bugs to be ironed out. For non-critical systems, upgrading shortly after release is generally safe if you follow the official instructions.
Will Debian 13 still support 32-bit (i386) systems?
This is a topic of ongoing discussion. While support for the 32-bit PC (i386) architecture may be dropped, a final decision will be confirmed closer to the release. For the most current information, consult the official Debian website.
What is the codename “Trixie” from?
Debian release codenames are traditionally taken from characters in the Disney/Pixar “Toy Story” movies. Trixie is the blue triceratops toy.
Conclusion
Debian 13 ‘Trixie’ is poised to be another outstanding release, reinforcing Debian’s commitment to providing a free, stable, and powerful operating system. With a modern Linux kernel, refreshed desktop environments like KDE Plasma 6, and updated versions of thousands of software packages, it offers compelling reasons to upgrade for both desktop users and system administrators. The focus on improved hardware support, performance, and security ensures that the Debian 13 Linux distribution will continue to be a top-tier choice for servers, workstations, and embedded systems for years to come. As the development cycle progresses, we can look forward to a polished and reliable OS that continues to power a significant portion of the digital world. Thank you for reading the DevopsRoles page!
In modern cloud engineering, Infrastructure as Code (IaC) is the gold standard for managing resources. Terraform has emerged as a leader in this space, allowing teams to define and provision infrastructure using a declarative configuration language. However, a significant challenge remains: how do you test your Terraform configurations efficiently without spinning up costly cloud resources and slowing down your development feedback loop? The answer lies in local cloud emulation. This guide provides a comprehensive walkthrough on how to leverage the powerful combination of Terraform LocalStack and the Go programming language to create a robust, local testing framework for your AWS infrastructure. This approach enables rapid, cost-effective integration testing, ensuring your code is solid before it ever touches a production environment.
Why Bother with Local Cloud Development?
The traditional “code, push, and pray” approach to infrastructure changes is fraught with risk and inefficiency. Testing against live AWS environments incurs costs, is slow, and can lead to resource conflicts between developers. A local cloud development strategy, centered around tools like LocalStack, addresses these pain points directly.
Cost Efficiency: By emulating AWS services on your local machine, you eliminate the need to pay for development or staging resources. This is especially beneficial when testing services that can be expensive, like multi-AZ RDS instances or EKS clusters.
Speed and Agility: Local feedback loops are orders of magnitude faster. Instead of waiting several minutes for a deployment pipeline to provision resources in the cloud, you can apply and test changes in seconds. This dramatically accelerates development and debugging.
Offline Capability: Develop and test your infrastructure configurations even without an internet connection. This is perfect for remote work or travel.
Isolated Environments: Each developer can run their own isolated stack, preventing the “it works on my machine” problem and eliminating conflicts over shared development resources.
Enhanced CI/CD Pipelines: Integrating local testing into your continuous integration (CI) pipeline allows you to catch errors early. You can run a full suite of integration tests against a LocalStack instance for every pull request, ensuring a higher degree of confidence before merging.
Setting Up Your Development Environment
Before we dive into the code, we need to set up our toolkit. This involves installing the necessary CLIs and getting LocalStack up and running with Docker.
Installing Core Tools
Ensure you have the following tools installed on your system. Most can be installed easily with package managers like Homebrew (macOS) or Chocolatey (Windows).
Terraform: The core IaC tool we’ll be using.
Go: The programming language for writing our integration tests.
Docker: The container platform needed to run LocalStack.
AWS CLI v2: Useful for interacting with and debugging our LocalStack instance.
Running LocalStack with Docker Compose
The easiest way to run LocalStack is with Docker Compose. Create a docker-compose.yml file with the following content. This configuration exposes the necessary ports and sets up a persistent volume for the LocalStack state.
Start LocalStack by running the following command in the same directory as your file:
docker-compose up -d
You can verify that it’s running correctly by checking the logs or using the AWS CLI, configured for the local endpoint:
aws --endpoint-url=http://localhost:4566 s3 ls
If this command returns an empty list without errors, your local AWS cloud is ready!
Crafting Your Terraform Configuration for LocalStack
The key to using Terraform with LocalStack is to configure the AWS provider to target your local endpoints instead of the official AWS APIs. This is surprisingly simple.
The provider Block: Pointing Terraform to LocalStack
In your Terraform configuration file (e.g., main.tf), you’ll define the aws provider with custom endpoints. This tells Terraform to direct all API calls for the specified services to your local container.
Important: For this to work seamlessly, you must use dummy values for access_key and secret_key. LocalStack doesn’t validate credentials by default.
With this configuration, you can now run terraform init and terraform apply. Terraform will communicate with your LocalStack container and create the S3 bucket locally.
Writing Go Tests with the AWS SDK for your Terraform LocalStack Setup
Now for the exciting part: writing automated tests in Go to validate the infrastructure that Terraform creates. We will use the official AWS SDK for Go V2, configuring it to point to our LocalStack instance.
Initializing the Go Project
In the same directory, initialize a Go module:
go mod init terraform-localstack-test
go get github.com/aws/aws-sdk-go-v2
go get github.com/aws/aws-sdk-go-v2/config
go get github.com/aws/aws-sdk-go-v2/service/s3
go get github.com/aws/aws-sdk-go-v2/aws
Configuring the AWS Go SDK v2 for LocalStack
To make the Go SDK talk to LocalStack, we need to provide a custom configuration. This involves creating a custom endpoint resolver and disabling credential checks. Create a helper file, perhaps aws_config.go, to handle this logic.
// aws_config.go
package main

import (
	"context"
	"github.com/aws/aws-sdk-go-v2/aws"
	"github.com/aws/aws-sdk-go-v2/config"
)

const (
	awsRegion    = "us-east-1"
	localstackEP = "http://localhost:4566"
)

// newAWSConfig creates a new AWS SDK v2 configuration pointed at LocalStack
func newAWSConfig(ctx context.Context) (aws.Config, error) {
	// Custom resolver for LocalStack endpoints
	customResolver := aws.EndpointResolverWithOptionsFunc(func(service, region string, options ...interface{}) (aws.Endpoint, error) {
		return aws.Endpoint{
			URL:           localstackEP,
			SigningRegion: region,
			Source:        aws.EndpointSourceCustom,
		}, nil
	})

	// Load default config and override with custom settings
	return config.LoadDefaultConfig(ctx,
		config.WithRegion(awsRegion),
		config.WithEndpointResolverWithOptions(customResolver),
		config.WithCredentialsProvider(aws.AnonymousCredentials{}),
	)
}
Writing the Integration Test: A Practical Example
Now, let’s write the test file main_test.go. We’ll use Go’s standard testing package. The test will create an S3 client using our custom configuration and then perform checks against the S3 bucket created by Terraform.
Test Case 1: Verifying S3 Bucket Creation
This test will check if the bucket exists. The HeadBucket API call is a lightweight way to do this; it succeeds if the bucket exists and you have permission, and fails otherwise.
A good test goes beyond mere existence. Let’s verify that the tags we defined in our Terraform code were applied correctly.
// Add this test to main_test.go
func TestS3BucketHasCorrectTags(t *testing.T) {
	// Arrange
	ctx := context.TODO()
	bucketName := "my-unique-local-test-bucket"
	expectedTags := map[string]string{
		"Environment": "Development",
		"ManagedBy":   "Terraform",
	}

	cfg, err := newAWSConfig(ctx)
	if err != nil {
		t.Fatalf("failed to create aws config: %v", err)
	}
	s3Client := s3.NewFromConfig(cfg)

	// Act
	output, err := s3Client.GetBucketTagging(ctx, &s3.GetBucketTaggingInput{
		Bucket: &bucketName,
	})
	if err != nil {
		t.Fatalf("GetBucketTagging failed: %v", err)
	}

	// Assert
	actualTags := make(map[string]string)
	for _, tag := range output.TagSet {
		actualTags[*tag.Key] = *tag.Value
	}

	for key, expectedValue := range expectedTags {
		actualValue, ok := actualTags[key]
		if !ok {
			t.Errorf("Expected tag '%s' not found", key)
			continue
		}
		if actualValue != expectedValue {
			t.Errorf("Tag '%s' has wrong value. Got: '%s', Expected: '%s'", key, actualValue, expectedValue)
		}
	}
}
The Complete Workflow: Tying It All Together
Now you have all the pieces. Here is the end-to-end workflow for developing and testing your infrastructure locally.
Step 1: Start LocalStack
Ensure your local cloud is running.
docker-compose up -d
Step 2: Apply Terraform Configuration
Initialize Terraform (if you haven’t already) and apply your configuration to provision the resources inside the LocalStack container.
terraform init
terraform apply -auto-approve
Step 3: Run the Go Integration Tests
Execute your test suite to validate the infrastructure.
go test -v
If all tests pass, you have a high degree of confidence that your Terraform code correctly defines the infrastructure you intended.
Step 4: Tear Down the Infrastructure
After testing, clean up the resources in LocalStack and, if desired, stop the container.
terraform destroy -auto-approve
docker-compose down
Frequently Asked Questions
1. Is LocalStack free? LocalStack has a free, open-source Community version that covers many core AWS services like S3, DynamoDB, Lambda, and SQS. More advanced services are available in the Pro/Team versions.
2. How does this compare to Terratest?
Terratest is another excellent framework for testing Terraform code, also written in Go. The approach described here is complementary. You can use Terratest’s helper functions to run terraform apply and then use the AWS SDK configuration method shown in this article to point your Terratest assertions at a LocalStack endpoint.
3. Can I use other languages for testing?
Absolutely! The core principle is configuring the AWS SDK of your chosen language (Python’s Boto3, JavaScript’s AWS-SDK, etc.) to use the LocalStack endpoint. The logic remains the same.
4. What if a service isn’t supported by LocalStack?
While LocalStack’s service coverage is extensive, it’s not 100%. For unsupported services, you may need to rely on mocks, stubs, or targeted tests against a real (sandboxed) AWS environment. Always check the official LocalStack documentation for the latest service coverage.
Conclusion
Adopting a local-first testing strategy is a paradigm shift for cloud infrastructure development. By combining the declarative power of Terraform with the high-fidelity emulation of LocalStack, you can build a fast, reliable, and cost-effective testing loop. Writing integration tests in Go with the AWS SDK provides the final piece of the puzzle, allowing you to programmatically verify that your infrastructure behaves exactly as expected. This Terraform LocalStack workflow not only accelerates your development cycle but also dramatically improves the quality and reliability of your infrastructure deployments, giving you and your team the confidence to innovate and deploy with speed. Thank you for reading the DevopsRoles page!
In the world of system administration and DevOps, performance is paramount. Every millisecond counts, and one of the most fundamental yet misunderstood components contributing to a Linux system’s speed is its caching mechanism. Many administrators see high memory usage attributed to “cache” and instinctively worry, but this is often a sign of a healthy, well-performing system. Understanding the Linux cache is not just an academic exercise; it’s a practical skill that allows you to accurately diagnose performance issues and optimize your infrastructure. This comprehensive guide will demystify the Linux caching system, from its core components to practical monitoring and management techniques.
What is the Linux Cache and Why is it Crucial?
At its core, the Linux cache is a mechanism that uses a portion of your system’s unused Random Access Memory (RAM) to store data that has recently been read from or written to a disk (like an SSD or HDD). Since accessing data from RAM is orders of magnitude faster than reading it from a disk, this caching dramatically speeds up system operations.
Think of it like a librarian who keeps the most frequently requested books on a nearby cart instead of returning them to the vast shelves after each use. The next time someone asks for one of those popular books, the librarian can hand it over instantly. In this analogy, the RAM is the cart, the disk is the main library, and the Linux kernel is the smart librarian. This process minimizes disk I/O (Input/Output), which is one of the slowest operations in any computer system.
The key benefits include:
Faster Application Load Times: Applications and their required data can be served from the cache instead of the disk, leading to quicker startup.
Improved System Responsiveness: Frequent operations, like listing files in a directory, become almost instantaneous as the required metadata is held in memory.
Reduced Disk Wear: By minimizing unnecessary read/write operations, caching can extend the lifespan of physical storage devices, especially SSDs.
It’s important to understand that memory used for cache is not “wasted” memory. The kernel is intelligent. If an application requires more memory, the kernel will seamlessly and automatically shrink the cache to free up RAM for the application. This dynamic management ensures that caching enhances performance without starving essential processes of the memory they need.
Diving Deep: The Key Components of the Linux Cache
The term “Linux cache” is an umbrella for several related but distinct mechanisms working together. The most significant components are the Page Cache, Dentry Cache, and Inode Cache.
The Page Cache: The Heart of File Caching
The Page Cache is the main disk cache used by the Linux kernel. When you read a file from the disk, the kernel reads it in chunks called “pages” (typically 4KB in size) and stores these pages in unused areas of RAM. The next time any process requests the same part of that file, the kernel can provide it directly from the much faster Page Cache, avoiding a slow disk read operation.
This also works for write operations. When you write to a file, the data can be written to the Page Cache first (a process known as write-back caching). The system can then inform the application that the write is complete, making the application feel fast and responsive. The kernel then flushes these “dirty” pages to the disk in the background at an optimal time. The sync command can be used to manually force all dirty pages to be written to disk.
The Buffer Cache: Buffering Block Device I/O
Historically, the Buffer Cache (or `Buffers`) was a separate entity that held metadata related to block devices, such as the filesystem journal or partition tables. In modern Linux kernels (post-2.4), the Buffer Cache is not a separate memory pool. Its functionality has been unified with the Page Cache. Today, when you see “Buffers” in tools like free or top, it generally refers to pages within the Page Cache that are specifically holding block device metadata. It’s a temporary storage for raw disk blocks and is a much smaller component compared to the file-centric Page Cache.
The Slab Allocator: Dentry and Inode Caches
Beyond caching file contents, the kernel also needs to cache filesystem metadata to avoid repeated disk lookups for file structure information. This is handled by the Slab allocator, a special memory management mechanism within the kernel for frequently used data structures.
Dentry Cache (dcache)
A “dentry” (directory entry) is a data structure used to translate a file path (e.g., /home/user/document.txt) into an inode. Every time you access a file, the kernel has to traverse this path. The dentry cache stores these translations in RAM. This dramatically speeds up operations like ls -l or any file access, as the kernel doesn’t need to read directory information from the disk repeatedly. You can learn more about kernel memory allocation from the official Linux Kernel documentation.
Inode Cache (icache)
An “inode” stores all the metadata about a file—except for its name and its actual data content. This includes permissions, ownership, file size, timestamps, and pointers to the disk blocks where the file’s data is stored. The inode cache holds this information in memory for recently accessed files, again avoiding slow disk I/O for metadata retrieval.
How to Monitor and Analyze Linux Cache Usage
Monitoring your system’s cache is straightforward with standard Linux command-line tools. Understanding their output is key to getting a clear picture of your memory situation.
Using the free Command
The free command is the quickest way to check memory usage. Using the -h (human-readable) flag makes the output easy to understand.
$ free -h
               total        used        free      shared  buff/cache   available
Mem:            15Gi       4.5Gi       338Mi       1.1Gi        10Gi        9.2Gi
Swap:          2.0Gi       1.2Gi       821Mi
Here’s how to interpret the key columns:
total: Total installed RAM.
used: Memory actively used by applications (total – free – buff/cache).
free: Truly unused memory. This number is often small on a busy system, which is normal.
buff/cache: This is the combined memory used by the Page Cache, Buffer Cache, and Slab allocator (dentries and inodes). This is the memory the kernel can reclaim if needed.
available: This is the most important metric. It’s an estimation of how much memory is available for starting new applications without swapping. It includes the “free” memory plus the portion of “buff/cache” that can be easily reclaimed.
Understanding /proc/meminfo
For a more detailed breakdown, you can inspect the virtual file /proc/meminfo. This file provides a wealth of information that tools like free use.
MemAvailable: The same as the “available” column in free.
Buffers: The memory used by the buffer cache.
Cached: Memory used by the page cache, excluding swap cache.
SReclaimable: The part of the Slab memory (like dentry and inode caches) that is reclaimable.
Advanced Tools: vmstat and slabtop
For dynamic monitoring, vmstat (virtual memory statistics) is excellent. Running vmstat 2 will give you updates every 2 seconds.
$ vmstat 2
procs -----------memory---------- ---swap-- -----io---- -system-- ------cpu-----
 r  b   swpd   free   buff  cache   si   so    bi    bo   in   cs us sy id wa st
 1  0 1252348 347492 345632 10580980    2    5   119   212  136  163  9  2 88  1  0
...
Pay attention to the bi (blocks in) and bo (blocks out) columns. High, sustained numbers here indicate heavy disk I/O. If these values are low while the system is busy, it’s a good sign that the cache is effectively serving requests.
To inspect the Slab allocator directly, you can use slabtop.
# requires root privileges
sudo slabtop
This command provides a real-time view of the top kernel caches, allowing you to see exactly how much memory is being used by objects like dentry and various inode caches.
Managing the Linux Cache: When and How to Clear It
Warning: Manually clearing the Linux cache is an operation that should be performed with extreme caution and is rarely necessary on a production system. The kernel’s memory management algorithms are highly optimized. Forcing a cache drop will likely degrade performance temporarily, as the system will need to re-read required data from the slow disk.
Why You Might *Think* You Need to Clear the Cache
The most common reason administrators want to clear the cache is a misunderstanding of the output from free -h. They see a low “free” memory value and a high “buff/cache” value and assume the system is out of memory. As we’ve discussed, this is the intended behavior of a healthy system. The only legitimate reason to clear the cache is typically for benchmarking purposes—for example, to measure the “cold-start” performance of an application’s disk I/O without any caching effects.
The drop_caches Mechanism: The Right Way to Clear Cache
If you have a valid reason to clear the cache, Linux provides a non-destructive way to do so via the /proc/sys/vm/drop_caches interface. For a detailed explanation, resources like Red Hat’s articles on memory management are invaluable.
First, it’s good practice to write all cached data to disk to prevent any data loss using the sync command. This flushes any “dirty” pages from memory to the storage device.
# First, ensure all pending writes are completed
sync
Next, you can write a value to drop_caches to specify what to clear. You must have root privileges to do this.
To free pagecache only:
echo 1 | sudo tee /proc/sys/vm/drop_caches
To free reclaimable slab objects (dentries and inodes):
echo 2 | sudo tee /proc/sys/vm/drop_caches
To free pagecache, dentries, and inodes (most common):
echo 3 | sudo tee /proc/sys/vm/drop_caches
Example: Before and After
Let’s see the effect.
Before:
$ free -h
               total        used        free      shared  buff/cache   available
Mem:            15Gi       4.5Gi       338Mi       1.1Gi        10Gi        9.2Gi
Action:
$ sync; echo 3 | sudo tee /proc/sys/vm/drop_caches
3
After:
$ free -h
               total        used        free      shared  buff/cache   available
Mem:            15Gi       4.4Gi        10Gi       1.1Gi       612Mi        9.6Gi
As you can see, the buff/cache value dropped dramatically from 10Gi to 612Mi, and the free memory increased by a corresponding amount. However, the system’s performance will now be slower for any operation that needs data that was just purged from the cache.
Frequently Asked Questions
What’s the difference between buffer and cache in Linux?
Historically, buffers were for raw block device I/O and cache was for file content. In modern kernels, they are unified. “Cache” (Page Cache) holds file data, while “Buffers” represents metadata for block I/O, but both reside in the same memory pool.
Is high cache usage a bad thing in Linux?
No, quite the opposite. High cache usage is a sign that your system is efficiently using available RAM to speed up disk operations. It is not “wasted” memory and will be automatically released when applications need it.
How can I see what files are in the page cache?
There isn’t a simple, standard command for this, but third-party tools like vmtouch or pcstat can analyze a file or directory and report how much of it is currently resident in the page cache.
Will clearing the cache delete my data?
No. Using the drop_caches method will not cause data loss. The cache only holds copies of data that is permanently stored on the disk. Running sync first ensures that any pending writes are safely committed to the disk before the cache is cleared.
Conclusion
The Linux cache is a powerful and intelligent performance-enhancing feature, not a problem to be solved. By leveraging unused RAM, the kernel significantly reduces disk I/O and makes the entire system faster and more responsive. While the ability to manually clear the cache exists, its use cases are limited almost exclusively to specific benchmarking scenarios. For system administrators and DevOps engineers, the key is to learn how to monitor and interpret cache usage correctly using tools like free, vmstat, and /proc/meminfo. Embracing and understanding the behavior of the Linux cache is a fundamental step toward mastering Linux performance tuning and building robust, efficient systems.Thank you for reading the DevopsRoles page!
In the ever-accelerating world of digital transformation, the complexity of IT environments is growing at an exponential rate. Hybrid clouds, edge computing, and the pervasive integration of artificial intelligence are no longer futuristic concepts but the daily reality for IT professionals. This intricate tapestry of technologies demands a new paradigm of automation—one that is not just reactive but predictive, not just scripted but intelligent, and not just centralized but pervasive. Recognizing this critical need, Red Hat extends Ansible Automation with a bold and ambitious new scope, fundamentally reshaping what’s possible in the realm of IT automation and management.
For years, Red Hat Ansible Automation Platform has been the de facto standard for automating provisioning, configuration management, and application deployment. Its agentless architecture, human-readable YAML syntax, and vast ecosystem of modules have empowered countless organizations to streamline operations, reduce manual errors, and accelerate service delivery. However, the challenges of today’s IT landscape demand more than just traditional automation. They require a platform that can intelligently respond to events in real-time, harness the power of generative AI to democratize automation, and seamlessly extend its reach from the core datacenter to the farthest edge of the network. This article delves into the groundbreaking extensions to the Ansible Automation Platform, exploring how Red Hat is pioneering the future of autonomous IT operations and providing a roadmap for businesses to not only navigate but thrive in this new era of complexity.
The Next Frontier: How Red Hat Extends Ansible Automation for the AI-Driven Era
The core of Ansible’s expanded vision lies in its deep integration with artificial intelligence and its evolution into a more responsive, event-driven platform. This isn’t merely about adding a few new features; it’s a strategic realignment to address the fundamental shifts in how IT is managed and operated. The new scope of Ansible Automation is built upon several key pillars, each designed to tackle a specific set of modern IT challenges.
Ansible Lightspeed with IBM Watson Code Assistant: The Dawn of Generative AI in Automation
One of the most transformative extensions to the Ansible Automation Platform is the introduction of Ansible Lightspeed with IBM Watson Code Assistant. This generative AI service, born from the erstwhile Project Wisdom, is designed to revolutionize how Ansible content is created, maintained, and adopted across an organization.
From Novice to Expert: Democratizing Ansible Playbook Creation
Traditionally, writing robust and efficient Ansible Playbooks required a significant level of expertise in both Ansible’s syntax and the intricacies of the target systems. Ansible Lightspeed dramatically lowers this barrier to entry by allowing users to generate Ansible tasks and even entire Playbooks using natural language prompts. This has profound implications for productivity and inclusivity:
For the beginner: A system administrator who understands the desired outcome but is unfamiliar with Ansible’s modules and syntax can simply describe the task in plain English (e.g., “create a new EC2 instance in AWS with a specific VPC and security group”) and receive a syntactically correct and functional Ansible task as a starting point.
For the expert: Experienced automators can accelerate their workflow by offloading the creation of boilerplate code and focusing on the more complex and strategic aspects of their automation. This also helps in discovering new modules and best practices they might not have been aware of.
Advanced Playbook Generation and Code Explanation
Ansible Lightspeed goes beyond simple task generation. With its deep integration into Visual Studio Code via the Ansible extension, it provides a seamless and interactive development experience. Users can generate multi-task Playbooks, and crucially, request explanations for existing Ansible code. This “explainability” feature is invaluable for training new team members, debugging complex Playbooks, and ensuring a consistent understanding of automation logic across the organization.
Example: Generating a Multi-Task Playbook with Ansible Lightspeed
A developer could input the following prompt into the Ansible Lightspeed interface in VS Code:
# ansible-lightspeed prompt
# - Install the latest version of Nginx
# - Create a new index.html file with the content "Welcome to our new web server"
# - Start and enable the Nginx service
Ansible Lightspeed, powered by Watson Code Assistant’s fine-tuned model trained on vast amounts of Ansible Galaxy content, would then generate a complete and contextually aware Playbook:
YAML
---
- name: Deploy and configure Nginx web server
  hosts: webservers
  become: true
  tasks:
    - name: Install the latest version of Nginx
      ansible.builtin.package:
        name: nginx
        state: latest

    - name: Create a custom index.html file
      ansible.builtin.copy:
        content: "Welcome to our new web server"
        dest: /usr/share/nginx/html/index.html
        mode: '0644'

    - name: Start and enable the Nginx service
      ansible.builtin.service:
        name: nginx
        state: started
        enabled: yes
Model Customization: Tailoring AI to Your Organization’s Needs
Recognizing that every organization has its own unique automation patterns, best practices, and custom modules, Red Hat and IBM have enabled model customization for Ansible Lightspeed. This allows enterprises to train the Watson Code Assistant model on their own private Ansible content. The result is a generative AI service that provides recommendations aligned with the organization’s specific operational standards, further improving the quality, accuracy, and relevance of the generated code.
Event-Driven Ansible: From Proactive to Responsive Automation
While traditional Ansible excels at executing predefined workflows, the dynamic nature of modern IT environments requires a more reactive and intelligent approach. This is where Event-Driven Ansible comes into play, a powerful extension that enables the platform to listen for and automatically respond to events from a wide range of sources across the IT landscape.
The Architecture of Responsiveness: Rulebooks, Sources, and Actions
Event-Driven Ansible introduces the concept of Ansible Rulebooks, which are YAML-defined sets of rules that link event sources to specific actions. The architecture is elegantly simple yet incredibly powerful:
Event Sources: These are plugins that connect to various monitoring, observability, and IT service management tools. There are out-of-the-box source plugins for a multitude of platforms, including AWS, Microsoft Azure, Google Cloud Platform, Kafka, webhooks, and popular observability tools like Dynatrace, Prometheus, and Grafana.
Rules: Within a rulebook, you define conditions that evaluate the incoming event data. These conditions can be as simple as checking for a specific status code or as complex as a multi-part logical expression that correlates data from different parts of the event payload.
Actions: When a rule’s condition is met, a corresponding action is triggered. This action can be running a full-fledged Ansible Playbook, executing a specific module, or even posting a new event to another system, creating a chain of automated workflows.
Practical Use Cases for Event-Driven Ansible
The applications of Event-Driven Ansible are vast and span across numerous IT domains:
Self-Healing Infrastructure: If a monitoring tool detects a failed web server, Event-Driven Ansible can automatically trigger a Playbook to restart the service, provision a new server, and update the load balancer, all without human intervention.Example: A Simple Self-Healing RulebookYAML--- - name: Monitor web server health hosts: all sources: - ansible.eda.url_check: urls: - https://www.example.com delay: 30 rules: - name: Restart Nginx on failure condition: event.url_check.status == "down" action: run_playbook: name: restart_nginx.yml
Automated Security Remediation: When a security information and event management (SIEM) system like Splunk or an endpoint detection and response (EDR) tool such as CrowdStrike detects a threat, Event-Driven Ansible can immediately execute a response Playbook. This could involve isolating the affected host by updating firewall rules, quarantining a user account, or collecting forensic data for further analysis.
FinOps and Cloud Cost Optimization: Event-Driven Ansible can be used to implement sophisticated FinOps strategies. By listening to events from cloud provider billing and usage APIs, it can automatically scale down underutilized resources during off-peak hours, decommission idle development environments, or enforce tagging policies to ensure proper cost allocation.
Hybrid Cloud and Edge Automation: In distributed environments, Event-Driven Ansible can react to changes in network latency, resource availability at the edge, or synchronization issues between on-premises and cloud resources, triggering automated workflows to maintain operational resilience.
Expanding the Automation Universe: New Content Collections and Integrations
The power of Ansible has always been in its extensive ecosystem of modules and collections. Red Hat is supercharging this ecosystem with a continuous stream of new, certified, and validated content, ensuring that Ansible can automate virtually any technology in the modern IT stack.
AI Infrastructure and MLOps
A key focus of the new content collections is the automation of AI and machine learning infrastructure. With new collections for Red Hat OpenShift AI and other popular MLOps platforms, organizations can automate the entire lifecycle of their AI/ML workloads, from provisioning GPU-accelerated compute nodes to deploying and managing complex machine learning models.
Networking and Security Automation at Scale
Red Hat continues to invest heavily in network and security automation. Recent updates include:
Expanded Cisco Integration: With a 300% expansion of the Cisco Intersight collection, network engineers can automate a wide range of tasks within the UCS ecosystem.
Enhanced Multi-Vendor Support: New and updated collections for vendors like Juniper, F5, and Nokia ensure that Ansible remains a leading platform for multi-vendor network automation.
Validated Security Content: Validated content for proactive security scenarios with Event-Driven Ansible enables security teams to build robust, automated threat response workflows.
Deepened Hybrid and Multi-Cloud Capabilities
The new scope of Ansible Automation places a strong emphasis on seamless hybrid and multi-cloud management. Enhancements include:
Expanded Cloud Provider Support: Significant updates to the AWS, Azure, and Google Cloud collections, including support for newer services like Azure Arc and enhanced capabilities for managing virtual machines and storage.
Virtualization Modernization: Improved integration with VMware vSphere and support for Red Hat OpenShift Virtualization make it easier for organizations to manage and migrate their virtualized workloads.
Infrastructure as Code (IaC) Integration: Upcoming integrations with tools like Terraform Enterprise and HashiCorp Vault will further solidify Ansible’s position as a central orchestrator in a modern IaC toolchain.
Ansible at the Edge: Automating the Distributed Enterprise
As computing moves closer to the data source, the need for robust and scalable edge automation becomes paramount. Red Hat has strategically positioned Ansible Automation Platform as the ideal solution for managing complex edge deployments.
Overcoming Edge Challenges with Automation Mesh
Ansible’s Automation Mesh provides a flexible and resilient architecture for distributing automation execution across geographically dispersed locations. This allows organizations to:
Execute Locally: Run automation closer to the edge devices, reducing latency and ensuring continued operation even with intermittent network connectivity to the central controller.
Scale Rapidly: Easily scale automation capacity to manage thousands of edge sites, network devices, and IoT endpoints.
Enhance Security: Deploy standardized configurations and automate patch management to maintain a strong security posture across the entire edge estate.
Real-World Edge Use Cases
Retail: Automating the deployment and configuration of point-of-sale (POS) systems, in-store servers, and IoT devices across thousands of retail locations.
Telecommunications: Automating the configuration and management of virtualized radio access networks (vRAN) and multi-access edge computing (MEC) infrastructure.
Manufacturing: Automating the configuration and monitoring of industrial control systems (ICS) and IoT sensors on the factory floor.
Frequently Asked Questions (FAQ)
Q1: How does Ansible Lightspeed with IBM Watson Code Assistant ensure the quality and security of the generated code?
Ansible Lightspeed is trained on a vast corpus of curated Ansible content from sources like Ansible Galaxy, with a strong emphasis on best practices. The models are fine-tuned to produce high-quality, reliable automation code. Furthermore, it provides source matching, giving users transparency into the potential origins of the generated code, including the author and license. For organizations with stringent security and compliance requirements, the ability to customize the model with their own internal, vetted Ansible content provides an additional layer of assurance.
Q2: Can Event-Driven Ansible integrate with custom or in-house developed applications?
Yes, Event-Driven Ansible is designed for flexibility and extensibility. One of its most powerful source plugins is the generic webhook source, which can receive events from any application or service capable of sending an HTTP POST request. This makes it incredibly easy to integrate with custom applications, legacy systems, and CI/CD pipelines. For more complex integrations, it’s also possible to develop custom event source plugins.
Q3: Is Ansible still relevant in a world dominated by Kubernetes and containers?
Absolutely. In fact, Ansible’s role is more critical than ever in a containerized world. While Kubernetes excels at container orchestration, it doesn’t solve all automation challenges. Ansible is a perfect complement to Kubernetes for tasks such as:
Provisioning and managing the underlying infrastructure for Kubernetes clusters, whether on-premises or in the cloud.
Automating the deployment of complex, multi-tier applications onto Kubernetes.
Managing the configuration of applications running inside containers.
Orchestrating workflows that span both Kubernetes and traditional IT infrastructure, which is a common reality in most enterprises.
Q4: How does Automation Mesh improve the performance and reliability of Ansible Automation at scale?
Automation Mesh introduces a distributed execution model. Instead of all automation jobs running on a central controller, they can be distributed to execution nodes located closer to the managed infrastructure. This provides several benefits:
Reduced Latency: For automation targeting geographically dispersed systems, running the execution from a nearby node significantly reduces network latency and improves performance.
Improved Reliability: If the connection to the central controller is lost, execution nodes can continue to run scheduled jobs, providing a higher level of resilience.
Enhanced Scalability: By distributing the execution load across multiple nodes, Automation Mesh allows the platform to handle a much larger volume of concurrent automation jobs.
Conclusion: A New Era of Intelligent Automation
The landscape of IT is in a state of constant evolution, and the tools we use to manage it must evolve as well. With its latest extensions, Red Hat extends Ansible Automation beyond its traditional role as a configuration management and orchestration tool. It is now a comprehensive, intelligent automation platform poised to tackle the most pressing challenges of the AI-driven, hybrid cloud era. By seamlessly integrating the power of generative AI with Ansible Lightspeed, embracing real-time responsiveness with Event-Driven Ansible, and continuously expanding its vast content ecosystem, Red Hat is not just keeping pace with the future of IT—it is actively defining it. For organizations looking to build a more agile, resilient, and innovative IT operation, the ambitious new scope of the Red Hat Ansible Automation Platform offers a clear and compelling path forward.
In the rapidly evolving landscape of cloud-native infrastructure, maintaining stringent security, operational, and cost compliance policies is a formidable challenge. Traditional, manual approaches to policy enforcement are often error-prone, inconsistent, and scale poorly, leading to configuration drift and potential security vulnerabilities. Enter GitOps and Terraform – two powerful methodologies that, when combined, offer a revolutionary approach to declarative policy management. This article will delve into how leveraging GitOps principles with Terraform’s infrastructure-as-code capabilities can transform your policy enforcement, ensuring consistency, auditability, and automation across your entire infrastructure lifecycle, ultimately boosting your overall policy management.
The Policy Management Conundrum in Modern IT
The acceleration of cloud adoption and the proliferation of microservices architectures have introduced unprecedented complexity into IT environments. While this agility offers immense business value, it simultaneously magnifies the challenges of maintaining effective policy management. Organizations struggle to ensure that every piece of infrastructure adheres to internal standards, regulatory compliance, and security best practices.
Manual Processes: A Recipe for Inconsistency
Many organizations still rely on manual checks, ad-hoc scripts, and human oversight for policy enforcement. This approach is fraught with inherent weaknesses:
Human Error: Manual tasks are susceptible to mistakes, leading to misconfigurations that can expose vulnerabilities or violate compliance.
Lack of Version Control: Changes made manually are rarely tracked in a systematic way, making it difficult to audit who made what changes and when.
Inconsistency: Without a standardized, automated process, policies might be applied differently across various environments or teams.
Scalability Issues: As infrastructure grows, manual policy checks become a significant bottleneck, unable to keep pace with demand.
Configuration Drift and Compliance Gaps
Configuration drift occurs when the actual state of your infrastructure deviates from its intended or desired state. This drift often arises from manual interventions, emergency fixes, or unmanaged updates. In the context of policy management, configuration drift means that your infrastructure might no longer comply with established rules, even if it was compliant at deployment time. Identifying and remediating such drift manually is resource-intensive and often reactive, leaving organizations vulnerable to security breaches or non-compliance penalties.
The Need for Automated, Declarative Enforcement
To overcome these challenges, modern IT demands a shift towards automated, declarative policy enforcement. Declarative approaches define what the desired state of the infrastructure (and its policies) should be, rather than how to achieve it. Automation then ensures that this desired state is consistently maintained. This is where the combination of GitOps and Terraform shines, offering a robust framework for managing policies as code.
Understanding GitOps: A Paradigm Shift for Infrastructure Management
GitOps is an operational framework that takes DevOps best practices like version control, collaboration, compliance, and CI/CD, and applies them to infrastructure automation. It champions the use of Git as the single source of truth for declarative infrastructure and applications.
Core Principles of GitOps
At its heart, GitOps is built on four fundamental principles:
Declarative Configuration: The entire system state (infrastructure, applications, policies) is described declaratively in a way that machines can understand and act upon.
Git as the Single Source of Truth: All desired state is stored in a Git repository. Any change to the system must be initiated by a pull request to this repository.
Automated Delivery: Approved changes in Git are automatically applied to the target environment through a continuous delivery pipeline.
Software Agents (Controllers): These agents continuously observe the actual state of the system and compare it to the desired state in Git. If a divergence is detected (configuration drift), the agents automatically reconcile the actual state to match the desired state.
Benefits of a Git-Centric Workflow
Adopting GitOps brings a multitude of benefits to infrastructure management:
Enhanced Auditability: Every change, who made it, and when, is recorded in Git’s immutable history, providing a complete audit trail.
Improved Security: With Git as the control plane, all changes go through code review, approval processes, and automated checks, reducing the attack surface.
Faster Mean Time To Recovery (MTTR): If a deployment fails or an environment breaks, you can quickly revert to a known good state by rolling back a Git commit.
Increased Developer Productivity: Developers can deploy applications and manage infrastructure using familiar Git workflows, reducing operational overhead.
Consistency Across Environments: By defining infrastructure and application states declaratively in Git, consistency across development, staging, and production environments is ensured.
GitOps in Practice: The Reconciliation Loop
A typical GitOps workflow involves a “reconciliation loop.” A GitOps operator or controller (e.g., Argo CD, Flux CD) continuously monitors the Git repository for changes to the desired state. When a change is detected (e.g., a new commit or merged pull request), the operator pulls the updated configuration and applies it to the target infrastructure. Simultaneously, it constantly monitors the live state of the infrastructure, comparing it against the desired state in Git. If any drift is found, the operator automatically corrects it, bringing the live state back into alignment with Git.
Terraform: Infrastructure as Code for Cloud Agility
Terraform, developed by HashiCorp, is an open-source infrastructure-as-code (IaC) tool that allows you to define and provision data center infrastructure using a high-level configuration language (HashiCorp Configuration Language – HCL). It supports a vast ecosystem of providers for various cloud platforms (AWS, Azure, GCP, VMware, OpenStack), SaaS services, and on-premise solutions.
The Power of Declarative Configuration
With Terraform, you describe your infrastructure in a declarative manner, specifying the desired end state rather than a series of commands to reach that state. For example, instead of writing scripts to manually create a VPC, subnets, and security groups, you write a Terraform configuration file that declares these resources and their attributes. Terraform then figures out the necessary steps to provision or update them.
Here’s a simple example of a Terraform configuration for an AWS S3 bucket:
This code explicitly declares that an S3 bucket named “my-unique-application-bucket” should exist, be private, and have public access completely blocked – an implicit policy definition.
Managing Infrastructure Lifecycle
Terraform provides a straightforward workflow for managing infrastructure:
terraform init: Initializes a working directory containing Terraform configuration files.
terraform plan: Generates an execution plan, showing what actions Terraform will take to achieve the desired state without actually making any changes. This is crucial for review and policy validation.
terraform apply: Executes the actions proposed in a plan, provisioning or updating infrastructure.
terraform destroy: Tears down all resources managed by the current Terraform configuration.
State Management and Remote Backends
Terraform keeps track of the actual state of your infrastructure in a “state file” (terraform.tfstate). This file maps the resources defined in your configuration to the real-world resources in your cloud provider. For team collaboration and security, it’s essential to store this state file in a remote backend (e.g., AWS S3, Azure Blob Storage, HashiCorp Consul/Terraform Cloud) and enable state locking to prevent concurrent modifications.
Implementing Policy Management with GitOps and Terraform
The true power emerges when we integrate GitOps and Terraform for policy management. This combination allows organizations to treat policies themselves as code, version-controlling them, automating their enforcement, and ensuring continuous compliance.
Policy as Code with Terraform
Terraform configurations inherently define policies. For instance, creating an AWS S3 bucket with acl = "private" is a policy. Similarly, an AWS IAM policy resource dictates access permissions. By defining these configurations in HCL, you are effectively writing “policy as code.”
However, basic Terraform doesn’t automatically validate against arbitrary external policies. This is where additional tools and GitOps principles come into play. The goal is to enforce policies that go beyond what Terraform’s schema directly offers, such as “no S3 buckets should be public” or “all EC2 instances must use encrypted EBS volumes.”
Git as the Single Source of Truth for Policies
In a GitOps model, all Terraform code – including infrastructure definitions, module calls, and implicit or explicit policy definitions – resides in Git. This makes Git the immutable, auditable source of truth for your infrastructure policies. Any proposed change to infrastructure, which might inadvertently violate a policy, must go through a pull request (PR). This PR serves as a critical checkpoint for policy validation.
Automated Policy Enforcement via GitOps Workflows
Combining GitOps and Terraform creates a robust pipeline for automated policy enforcement:
Developer Submits PR: A developer proposes an infrastructure change by submitting a PR to the Git repository containing Terraform configurations.
CI Pipeline Triggered: The PR triggers an automated CI pipeline (e.g., GitHub Actions, GitLab CI, Jenkins).
terraform plan Execution: The CI pipeline runs terraform plan to determine the exact infrastructure changes.
Policy Validation Tools Engaged: Before terraform apply, specialized policy-as-code tools analyze the terraform plan output or the HCL code itself against predefined policy rules.
Feedback and Approval: If policy violations are found, the PR is flagged, and feedback is provided to the developer. If no violations, the plan is approved (potentially after manual review).
Automated Deployment (CD): Upon PR merge to the main branch, a CD pipeline (often managed by a GitOps controller like Argo CD or Flux) automatically executes terraform apply, provisioning the compliant infrastructure.
Continuous Reconciliation: The GitOps controller continuously monitors the live infrastructure, detecting and remediating any drift from the Git-defined desired state, thus ensuring continuous policy compliance.
Effective policy management with GitOps and Terraform involves integrating policy checks at various stages of the development and deployment lifecycle.
Pre-Deployment Policy Validation (CI-Stage)
This is the most crucial stage for preventing policy violations from reaching your infrastructure. Tools are used to analyze Terraform code and plans before deployment.
Static Analysis Tools:
terraform validate: Checks configuration syntax and internal consistency.
tflint: A pluggable linter for Terraform that can enforce best practices and identify potential errors.
Open Policy Agent (OPA) / Rego: A general-purpose policy engine. You can write policies in Rego (OPA’s query language) to evaluate Terraform plans or HCL code against custom rules. Tools like Checkov and Terrascan are built on OPA or similar engines to scan Terraform code for security and compliance issues.
HashiCorp Sentinel: An enterprise-grade policy-as-code framework integrated with HashiCorp products like Terraform Enterprise/Cloud.
Infracost: While not strictly a policy tool, Infracost can provide cost estimates for Terraform plans, allowing you to enforce cost policies (e.g., “VMs cannot exceed X cost”).
Code Example: GitHub Actions for Policy Validation with Checkov
name: Terraform Policy Scan

on: [pull_request]

jobs:
  terraform_policy_scan:
    runs-on: ubuntu-latest
    steps:
    - uses: actions/checkout@v3
    - uses: hashicorp/setup-terraform@v2
      with:
        terraform_version: 1.x.x

    - name: Terraform Init
      id: init
      run: terraform init

    - name: Terraform Plan
      id: plan
      run: terraform plan -no-color -out=tfplan.binary
      # Save the plan to a file for Checkov to scan

    - name: Convert Terraform Plan to JSON
      id: convert_plan
      run: terraform show -json tfplan.binary > tfplan.json

    - name: Run Checkov with Terraform Plan
      uses: bridgecrewio/checkov-action@v12
      with:
        file: tfplan.json # Scan the plan JSON
        output_format: cli
        framework: terraform_plan
        soft_fail: false # Set to true to allow PR even with failures, for reporting
        # Customize policies:
        # skip_check: CKV_AWS_18,CKV_AWS_19
        # check: CKV_AWS_35
This example demonstrates how a CI pipeline can leverage Checkov to scan a Terraform plan for policy violations, preventing non-compliant infrastructure from being deployed.
Even with robust pre-deployment checks, continuous monitoring is essential. This can involve:
Cloud-Native Policy Services: Services like AWS Config, Azure Policy, and Google Cloud Organization Policy Service can continuously assess your deployed resources against predefined rules and flag non-compliance. These can often be integrated with GitOps reconciliation loops for automated remediation.
OPA/Gatekeeper (for Kubernetes): While Terraform provisions the underlying cloud resources, OPA Gatekeeper can enforce policies on Kubernetes clusters provisioned by Terraform. It acts as a validating admission controller, preventing non-compliant resources from being deployed to the cluster.
Regular Drift Detection: A GitOps controller can periodically run terraform plan and compare the output against the committed state in Git. If drift is detected and unauthorized, it can trigger alerts or even automatically apply the Git-defined state to remediate.
Policy for Terraform Modules and Providers
To scale policy management, organizations often create a centralized repository of approved Terraform modules. These modules are pre-vetted to be compliant with organizational policies. Teams then consume these modules, ensuring that their deployments inherit the desired policy adherence. Custom Terraform providers can also be developed to enforce specific policies or interact with internal systems.
Advanced Strategies and Enterprise Considerations
For large organizations, implementing GitOps and Terraform for policy management requires careful planning and advanced strategies.
Multi-Cloud and Hybrid Cloud Environments
GitOps and Terraform are inherently multi-cloud capable, making them ideal for consistent policy enforcement across diverse environments. Terraform’s provider model allows defining infrastructure in different clouds using a unified language. GitOps principles ensure that the same set of policy checks and deployment workflows can be applied consistently, regardless of the underlying cloud provider. For hybrid clouds, specialized providers or custom integrations can extend this control to on-premises infrastructure.
Integrating with Governance and Compliance Frameworks
The auditable nature of Git, combined with automated policy checks, provides strong evidence for meeting regulatory compliance requirements (e.g., NIST, PCI-DSS, HIPAA, GDPR). Every infrastructure change, including those related to security configurations, is recorded and can be traced back to a specific commit and reviewer. Integrating policy-as-code tools with security information and event management (SIEM) systems can further enhance real-time compliance monitoring and reporting.
Drift Detection and Remediation
Beyond initial deployment, continuous drift detection is vital. GitOps operators can be configured to periodically run terraform plan and compare the output to the state defined in Git. If a drift is detected:
Alerting: Trigger alerts to relevant teams for investigation.
Automated Remediation: For certain types of drift (e.g., a security group rule manually deleted), the GitOps controller can automatically trigger terraform apply to revert the change and enforce the desired state. Careful consideration is needed for automated remediation to avoid unintended consequences.
Scalability and Organizational Structure
As organizations grow, managing a single monolithic Terraform repository becomes challenging. Strategies include:
Module Decomposition: Breaking down infrastructure into reusable, versioned Terraform modules.
Workspace/Project Separation: Using separate Git repositories and Terraform workspaces for different teams, applications, or environments.
Federated GitOps: Multiple Git repositories, each managed by a dedicated GitOps controller for specific domains or teams, all feeding into a higher-level governance structure.
Role-Based Access Control (RBAC): Implementing strict RBAC for Git repositories and CI/CD pipelines to control who can propose and approve infrastructure changes.
Benefits of Combining GitOps and Terraform for Policy Management
The synergy between GitOps and Terraform offers compelling advantages for modern infrastructure policy management:
Enhanced Security and Compliance: By enforcing policies at every stage through automated checks and Git-driven workflows, organizations can significantly reduce their attack surface and demonstrate continuous compliance. Every change is auditable, leaving a clear trail.
Reduced Configuration Drift: The core GitOps principle of continuous reconciliation ensures that the actual infrastructure state always matches the desired state defined in Git, minimizing inconsistencies and policy violations.
Increased Efficiency and Speed: Automating policy validation and enforcement within CI/CD pipelines accelerates deployment cycles. Developers receive immediate feedback on policy violations, enabling faster iterations.
Improved Collaboration and Transparency: Git provides a collaborative platform where teams can propose, review, and approve infrastructure changes. Policies embedded in this workflow become transparent and consistently applied.
Cost Optimization: Policies can be enforced to ensure resource efficiency (e.g., preventing oversized instances, enforcing auto-scaling, managing resource tags for cost allocation), leading to better cloud cost management.
Disaster Recovery and Consistency: The entire infrastructure, including its policies, is defined as code in Git. This enables rapid and consistent recovery from disasters by simply rebuilding the environment from the Git repository.
Overcoming Potential Challenges
While powerful, adopting GitOps and Terraform for policy management also comes with certain challenges:
Initial Learning Curve
Teams need to invest time in learning Terraform HCL, GitOps principles, and specific policy-as-code tools like OPA/Rego. This cultural and technical shift requires training and strong leadership buy-in.
Tooling Complexity
Integrating various tools (Terraform, Git, CI/CD platforms, GitOps controllers, policy engines) can be complex. Choosing the right tools and ensuring seamless integration is key to a smooth workflow.
State Management Security
Terraform state files contain sensitive information about your infrastructure. Securing remote backends, implementing proper encryption, and managing access to state files is paramount. GitOps principles should extend to securing access to the Git repository itself.
Frequently Asked Questions
Can GitOps and Terraform replace all manual policy checks?
While GitOps and Terraform significantly reduce the need for manual policy checks by automating enforcement and validation, some high-level governance or very nuanced, human-driven policy reviews might still be necessary. The goal is to automate as much as possible, focusing manual effort on complex edge cases or strategic oversight.
What are some popular tools for policy as code with Terraform?
Popular tools include Open Policy Agent (OPA) with its Rego language (used by tools like Checkov and Terrascan), HashiCorp Sentinel (for Terraform Enterprise/Cloud), and cloud-native policy services such as AWS Config, Azure Policy, and Google Cloud Organization Policy Service. Each offers different strengths depending on your specific needs and environment.
How does this approach handle emergency changes?
In a strict GitOps model, even emergency changes should ideally go through a rapid Git-driven workflow (e.g., a fast-tracked PR with minimal review). However, some organizations maintain an “escape hatch” mechanism for critical emergencies, allowing direct access to modify infrastructure. If such direct changes occur, the GitOps controller will detect the drift and either revert the change or require an immediate Git commit to reconcile the desired state, thereby ensuring auditability and eventual consistency with the defined policies.
Is GitOps only for Kubernetes, or can it be used with Terraform?
While GitOps gained significant traction in the Kubernetes ecosystem with tools like Argo CD and Flux, its core principles are applicable to any declarative system. Terraform, being a declarative infrastructure-as-code tool, is perfectly suited for a GitOps workflow. The Git repository serves as the single source of truth for Terraform configurations, and CI/CD pipelines or custom operators drive the “apply” actions based on Git changes, embodying the GitOps philosophy.
Conclusion
The combination of GitOps and Terraform offers a paradigm shift in how organizations manage infrastructure and enforce policies. By embracing declarative configurations, version control, and automated reconciliation, you can transform policy management from a manual, error-prone burden into an efficient, secure, and continuously compliant process. This approach not only enhances security and ensures adherence to regulatory standards but also accelerates innovation by empowering teams with agile, auditable, and automated infrastructure deployments. As you navigate the complexities of modern cloud environments, leveraging GitOps and Terraform will be instrumental in building resilient, compliant, and scalable infrastructure. Thank you for reading the DevopsRoles page!
In the world of data science and machine learning, rapidly developing interactive web applications is crucial for showcasing models, visualizing data, and building internal tools. Streamlit has emerged as a powerful, user-friendly framework that empowers developers and data scientists to create beautiful, performant data apps with pure Python code. However, taking these applications from local development to a scalable, cost-efficient production environment often presents a significant challenge, especially when aiming for a serverless Streamlit deployment.
Traditional deployment methods can involve manual server provisioning, complex dependency management, and a constant struggle with scalability and maintenance. This article will guide you through an automated, repeatable, and robust approach to achieving a serverless Streamlit deployment using Terraform. By combining the agility of Streamlit with the infrastructure-as-code (IaC) prowess of Terraform, you’ll learn how to build a scalable, cost-effective, and reproducible deployment pipeline, freeing you to focus on developing your innovative data applications rather than managing underlying infrastructure.
Understanding Streamlit and Serverless Architectures
Before diving into the mechanics of automation, let’s establish a clear understanding of the core technologies involved: Streamlit and serverless computing.
What is Streamlit?
Streamlit is an open-source Python library that transforms data scripts into interactive web applications in minutes. It simplifies the web development process for Pythonistas by allowing them to create custom user interfaces with minimal code, without needing extensive knowledge of front-end frameworks like React or Angular.
Simplicity: Write Python scripts, and Streamlit handles the UI generation.
Interactivity: Widgets like sliders, buttons, text inputs are easily integrated.
Data-centric: Optimized for displaying and interacting with data, perfect for machine learning models and data visualizations.
Rapid Prototyping: Speeds up the iteration cycle for data applications.
The Appeal of Serverless
Serverless computing is an execution model where the cloud provider dynamically manages the allocation and provisioning of servers. You, as the developer, write and deploy your code, and the cloud provider handles all the underlying infrastructure concerns like scaling, patching, and maintenance. This model offers several compelling advantages:
No Server Management: Eliminate the operational overhead of provisioning, maintaining, and updating servers.
Automatic Scaling: Resources automatically scale up or down based on demand, ensuring your application handles traffic spikes without manual intervention.
Pay-per-Execution: You only pay for the compute time and resources your application consumes, leading to significant cost savings, especially for applications with intermittent usage.
High Availability: Serverless platforms are designed for high availability and fault tolerance, distributing your application across multiple availability zones.
Faster Time-to-Market: Developers can focus more on code and less on infrastructure, accelerating the deployment process.
While often associated with function-as-a-service (FaaS) platforms like AWS Lambda, the serverless paradigm extends to container-based services such as AWS Fargate or Google Cloud Run, which are excellent candidates for containerized Streamlit applications. Deploying Streamlit in a serverless manner allows your data applications to be highly available, scalable, and cost-efficient, adapting seamlessly to varying user loads.
Challenges in Traditional Streamlit Deployment
Even with Streamlit’s simplicity, traditional deployment can quickly become complex, hindering the benefits of rapid application development.
Manual Configuration Headaches
Deploying a Streamlit application typically involves setting up a server, installing Python, managing dependencies, configuring web servers (like Nginx or Gunicorn), and ensuring proper networking and security. This manual process is:
Time-Consuming: Each environment (development, staging, production) requires repetitive setup.
Prone to Errors: Human error can lead to misconfigurations, security vulnerabilities, or application downtime.
Inconsistent: Subtle differences between environments can cause the “it works on my machine” syndrome.
Lack of Reproducibility and Version Control
Without a defined process, infrastructure changes are often undocumented or managed through ad-hoc scripts. This leads to:
Configuration Drift: Environments diverge over time, making debugging and maintenance difficult.
Poor Auditability: It’s hard to track who made what infrastructure changes and why.
Difficulty in Rollbacks: Reverting to a previous, stable infrastructure state becomes a guessing game.
Scaling and Maintenance Overhead
Once deployed, managing the operational aspects of a Streamlit app on traditional servers adds further burden:
Scaling Challenges: Manually adding or removing server instances, configuring load balancers, and adjusting network settings to match demand is complex and slow.
Patching and Updates: Keeping operating systems, libraries, and security patches up-to-date requires constant attention.
Resource Utilization: Under-provisioning leads to performance issues, while over-provisioning wastes resources and money.
Terraform: The Infrastructure as Code Solution
This is where Infrastructure as Code (IaC) tools like Terraform become indispensable. Terraform addresses these deployment challenges head-on by enabling you to define your cloud infrastructure in a declarative language.
What is Terraform?
Terraform, developed by HashiCorp, is an open-source IaC tool that allows you to define and provision cloud and on-premise resources using human-readable configuration files. It supports a vast ecosystem of providers for various cloud platforms (AWS, Azure, GCP, etc.), SaaS offerings, and custom services.
Declarative Language: You describe the desired state of your infrastructure, and Terraform figures out how to achieve it.
Providers: Connect to various cloud services (e.g., aws, google, azurerm) to manage their resources.
Resources: Individual components of your infrastructure (e.g., a virtual machine, a database, a network).
State File: Terraform maintains a state file that maps your configuration to the real-world resources it manages. This allows it to understand what changes need to be made.
Leveraging Terraform for your serverless Streamlit deployment offers numerous advantages:
Automation and Consistency: Automate the provisioning of all necessary cloud resources, ensuring consistent deployments across environments.
Reproducibility: Infrastructure becomes code, meaning you can recreate your entire environment from scratch with a single command.
Version Control: Store your infrastructure definitions in a version control system (like Git), enabling change tracking, collaboration, and easy rollbacks.
Cost Optimization: Define resources precisely, avoid over-provisioning, and easily manage serverless resources that scale down to zero when not in use.
Security Best Practices: Embed security configurations directly into your code, ensuring compliance and reducing the risk of misconfigurations.
Reduced Manual Effort: Developers and DevOps teams spend less time on manual configuration and more time on value-added tasks.
Designing Your Serverless Streamlit Architecture with Terraform
A robust serverless architecture for Streamlit needs several components to ensure scalability, security, and accessibility. We’ll focus on AWS as a primary example, as its services like Fargate are well-suited for containerized applications.
Choosing a Serverless Platform for Streamlit
While AWS Lambda is a serverless function service, Streamlit applications typically require a persistent process and more memory than a standard Lambda function provides, making direct deployment challenging. Instead, container-based serverless options are preferred:
AWS Fargate (with ECS): A serverless compute engine for containers that works with Amazon Elastic Container Service (ECS). Fargate abstracts away the need to provision, configure, or scale clusters of virtual machines. You simply define your application’s resource requirements, and Fargate runs it. This is an excellent choice for Streamlit.
Google Cloud Run: A fully managed platform for running containerized applications. It automatically scales your container up and down, even to zero, based on traffic.
Azure Container Apps: A fully managed serverless container service that supports microservices and containerized applications.
For the remainder of this guide, we’ll use AWS Fargate as our target serverless environment due to its maturity and robust ecosystem, making it a powerful choice for a serverless Streamlit deployment.
Key Components for Deployment on AWS Fargate
A typical serverless Streamlit deployment on AWS using Fargate will involve:
AWS ECR (Elastic Container Registry): A fully managed Docker container registry that makes it easy to store, manage, and deploy Docker images. Your Streamlit app’s Docker image will reside here.
AWS ECS (Elastic Container Service): A highly scalable, high-performance container orchestration service that supports Docker containers. We’ll use it with Fargate launch type.
AWS VPC (Virtual Private Cloud): Your isolated network in the AWS cloud, containing subnets, route tables, and network gateways.
Security Groups: Act as virtual firewalls to control inbound and outbound traffic to your ECS tasks.
Application Load Balancer (ALB): Distributes incoming application traffic across multiple targets, such as your ECS tasks. It also handles SSL termination and routing.
AWS Route 53 (Optional): For managing your custom domain names and pointing them to your ALB.
AWS Certificate Manager (ACM) (Optional): For provisioning SSL/TLS certificates for HTTPS.
Architecture Sketch:
User -> Route 53 (Optional) -> ALB -> VPC (Public/Private Subnets) -> Security Group -> ECS Fargate Task (Running Streamlit Container from ECR)
Step-by-Step: Accelerating Your Serverless Streamlit Deployment with Terraform on AWS
Let’s walk through the process of setting up your serverless Streamlit deployment using Terraform on AWS.
AWS CLI installed and configured with your credentials.
Docker installed on your local machine.
Terraform installed on your local machine.
Step 1: Streamlit Application Containerization
First, you need to containerize your Streamlit application using Docker. Create a simple Streamlit app (e.g., app.py) and a Dockerfile in your project root.
app.py:
import streamlit as st

st.set_page_config(page_title="My Serverless Streamlit App")
st.title("Hello from Serverless Streamlit!")
st.write("This application is deployed on AWS Fargate using Terraform.")

name = st.text_input("What's your name?")
if name:
    st.write(f"Nice to meet you, {name}!")

st.sidebar.header("About")
st.sidebar.info("This is a simple demo app.")
requirements.txt:
streamlit==1.x.x # Use a specific version
Dockerfile:
# Use an official Python runtime as a parent image
FROM python:3.9-slim-buster

# Set the working directory in the container
WORKDIR /app

# Copy the current directory contents into the container at /app
COPY requirements.txt ./
COPY app.py ./

# Install any needed packages specified in requirements.txt
RUN pip install --no-cache-dir -r requirements.txt

# Make port 8501 available to the world outside this container
EXPOSE 8501

# Run app.py when the container launches
ENTRYPOINT ["streamlit", "run", "app.py", "--server.port=8501", "--server.enableCORS=false", "--server.enableXsrfProtection=false"]
Note: --server.enableCORS=false and --server.enableXsrfProtection=false are often needed when Streamlit is behind a load balancer to prevent connection issues. Adjust as per your security requirements.
Step 2: Initialize Terraform Project
Create a directory for your Terraform configuration (e.g., terraform-streamlit). Inside this directory, create the following files:
main.tf: Defines AWS resources.
variables.tf: Declares input variables.
outputs.tf: Specifies output values.
main.tf (initial provider configuration):
variable "region" {
  description = "AWS region"
  type        = string
  default     = "us-east-1" # Or your preferred region
}

variable "project_name" {
  description = "Name of the project for resource tagging"
  type        = string
  default     = "streamlit-fargate-app"
}

variable "vpc_cidr_block" {
  description = "CIDR block for the VPC"
  type        = string
  default     = "10.0.0.0/16"
}

variable "public_subnet_cidrs" {
  description = "List of CIDR blocks for public subnets"
  type        = list(string)
  default     = ["10.0.1.0/24", "10.0.2.0/24"] # Adjust based on your region's AZs
}

variable "container_port" {
  description = "Port on which the Streamlit container listens"
  type        = number
  default     = 8501
}
outputs.tf (initially empty, will be populated later):
/* No outputs defined yet */
Initialize your Terraform project:
terraform init
Step 3: Define AWS ECR Repository
Add the ECR repository definition to your main.tf. This is where your Docker image will be pushed.
resource "aws_ecr_repository" "streamlit_repo" { name = "${var.project_name}-repo" image_tag_mutability = "MUTABLE"
output "ecr_repository_url" { description = "URL of the ECR repository" value = aws_ecr_repository.streamlit_repo.repository_url }
Step 4: Build and Push Docker Image
Before deploying with Terraform, you need to build your Docker image and push it to the ECR repository created in Step 3. You’ll need the ECR repository URL from Terraform’s output.
# After `terraform apply`, get the ECR URL:
terraform output ecr_repository_url

# Example shell commands (replace with your ECR URL and desired tag):
# Login to ECR
aws ecr get-login-password --region us-east-1 | docker login --username AWS --password-stdin .dkr.ecr.us-east-1.amazonaws.com

# Build the Docker image
docker build -t ${var.project_name} .

# Tag the image
docker tag ${var.project_name}:latest .dkr.ecr.us-east-1.amazonaws.com/${var.project_name}-repo:latest

# Push the image to ECR
docker push .dkr.ecr.us-east-1.amazonaws.com/${var.project_name}-repo:latest
Step 5: Provision AWS ECS Cluster and Fargate Service
This is the core of your serverless Streamlit deployment. We’ll define the VPC, subnets, security groups, ECS cluster, task definition, and service, along with an Application Load Balancer.
default_action { type = "forward" target_group_arn = aws_lb_target_group.streamlit_tg.arn } }
# --- ECS Service --- resource "aws_ecs_service" "streamlit_service" { name = "${var.project_name}-service" cluster = aws_ecs_cluster.streamlit_cluster.id task_definition = aws_ecs_task_definition.streamlit_task.arn desired_count = 1 # Start with 1 instance, can be scaled with auto-scaling
launch_type = "FARGATE"
network_configuration { subnets = aws_subnet.public.*.id security_groups = [aws_security_group.ecs_task.id] assign_public_ip = true # Required for Fargate tasks in public subnets to reach ECR, etc. }
lifecycle { ignore_changes = [desired_count] # Prevents Terraform from changing desired_count if auto-scaling is enabled later }
tags = { Project = var.project_name }
depends_on = [ aws_lb_listener.http ] }
# Output the ALB DNS name output "streamlit_app_url" { description = "The URL of the deployed Streamlit application" value = aws_lb.streamlit_alb.dns_name }
Remember to update variables.tf with required variables (like project_name, vpc_cidr_block, public_subnet_cidrs, container_port) if not already done. The outputs.tf will now have the streamlit_app_url.
Step 6: Deploy and Access
Navigate to your Terraform project directory and run the following commands:
# Review the plan to see what resources will be created
terraform plan

# Apply the changes to create the infrastructure
terraform apply --auto-approve

# Get the URL of your deployed Streamlit application
terraform output streamlit_app_url
Once terraform apply completes successfully, you will get an ALB DNS name. Paste this URL into your browser, and you should see your Streamlit application running!
Advanced Considerations
Custom Domains and HTTPS
For a production serverless Streamlit deployment, you’ll want a custom domain and HTTPS. This involves:
AWS Certificate Manager (ACM): Request and provision an SSL/TLS certificate.
AWS Route 53: Create a DNS A record (or CNAME) pointing your domain to the ALB.
ALB Listener: Add an HTTPS listener (port 443) to your ALB, attaching the ACM certificate and forwarding traffic to your target group.
CI/CD Integration
Automate the build, push, and deployment process with CI/CD tools like GitHub Actions, GitLab CI, or AWS CodePipeline/CodeBuild. This ensures that every code change triggers an automated infrastructure update and application redeployment.
A typical CI/CD pipeline would:
On code push to main branch:
Build Docker image.
Push image to ECR.
Run terraform init, terraform plan, terraform apply to update the ECS service with the new image tag.
Logging and Monitoring
Ensure your ECS tasks are configured to send logs to AWS CloudWatch Logs (as shown in the task definition). You can then use CloudWatch Alarms and Dashboards for monitoring your application’s health and performance.
Terraform State Management
For collaborative projects and production environments, it’s crucial to store your Terraform state file remotely. Amazon S3 is a common choice for this, coupled with DynamoDB for state locking to prevent concurrent modifications.
Add this to your main.tf:
terraform {
  backend "s3" {
    bucket         = "your-terraform-state-bucket" # Replace with your S3 bucket name
    key            = "streamlit-fargate/terraform.tfstate"
    region         = "us-east-1"
    encrypt        = true
    dynamodb_table = "your-terraform-state-lock-table" # Replace with your DynamoDB table name
  }
}
You would need to manually create the S3 bucket and DynamoDB table before initializing Terraform with this backend configuration.
Frequently Asked Questions
Q1: Why not use Streamlit Cloud for serverless deployment?
Streamlit Cloud offers the simplest way to deploy Streamlit apps, often with a few clicks or GitHub integration. It’s a fantastic option for quick prototypes, personal projects, and even some production use cases where its features meet your needs. However, using Terraform for a serverless Streamlit deployment on a cloud provider like AWS gives you:
Full control: Over the underlying infrastructure, networking, security, and resource allocation.
Customization: Ability to integrate with a broader AWS ecosystem (databases, queues, machine learning services) that might be specific to your architecture.
Cost Optimization: Fine-tuned control over resource sizing and auto-scaling rules can sometimes lead to more optimized costs for specific traffic patterns.
IaC Benefits: All the advantages of version-controlled, auditable, and repeatable infrastructure.
The choice depends on your project’s complexity, governance requirements, and existing cloud strategy.
Q2: Can I use this approach for other web frameworks or Python apps?
Absolutely! The approach demonstrated here for containerizing a Streamlit app and deploying it on AWS Fargate with Terraform is highly generic. Any web application or Python service that can be containerized with Docker can leverage this identical pattern for a scalable, serverless deployment. You would simply swap out the Streamlit specific code and port for your application’s requirements.
Q3: How do I handle stateful Streamlit apps in a serverless environment?
Serverless environments are inherently stateless. For Streamlit applications requiring persistence (e.g., storing user sessions, uploaded files, or complex model outputs), you must integrate with external state management services:
Databases: Use managed databases like AWS RDS (PostgreSQL, MySQL), DynamoDB, or ElastiCache (Redis) for session management or persistent data storage.
Object Storage: For file uploads or large data blobs, AWS S3 is an excellent choice.
External Cache: Use Redis (via AWS ElastiCache) for caching intermediate results or session data.
Terraform can be used to provision and configure these external state services alongside your Streamlit deployment.
Q4: What are the cost implications of Streamlit on AWS Fargate?
AWS Fargate is a pay-per-use service, meaning you are billed for the amount of vCPU and memory resources consumed by your application while it’s running. Costs are generally competitive, especially for applications with variable or intermittent traffic, as Fargate scales down when not in use. Factors influencing cost include:
CPU and Memory: The amount of resources allocated to each task.
Number of Tasks: How many instances of your Streamlit app are running.
Data Transfer: Ingress and egress data transfer costs.
Other AWS Services: Costs for ALB, ECR, CloudWatch, etc.
Compared to running a dedicated EC2 instance 24/7, Fargate can be significantly more cost-effective if your application experiences idle periods. For very high, consistent traffic, dedicated EC2 instances might sometimes offer better price performance, but at the cost of operational overhead.
Q5: Is Terraform suitable for small Streamlit projects?
For a single, small Streamlit app that you just want to get online quickly and don’t foresee much growth or infrastructure complexity, the initial learning curve and setup time for Terraform might seem like overkill. In such cases, Streamlit Cloud or manual deployment to a simple VM could be faster. However, if you anticipate:
Future expansion or additional services.
Multiple environments (dev, staging, prod).
Collaboration with other developers.
The need for robust CI/CD pipelines.
Any form of compliance or auditing requirements.
Then, even for a “small” project, investing in Terraform from the start pays dividends in the long run by providing a solid foundation for scalable, maintainable, and cost-efficient infrastructure.
Conclusion
Deploying Streamlit applications in a scalable, reliable, and cost-effective manner is a common challenge for data practitioners and developers. By embracing the power of Infrastructure as Code with Terraform, you can significantly accelerate your serverless Streamlit deployment process, transforming a manual, error-prone endeavor into an automated, version-controlled pipeline.
This comprehensive guide has walked you through containerizing your Streamlit application, defining your AWS infrastructure using Terraform, and orchestrating its deployment on AWS Fargate. You now possess the knowledge to build a robust foundation for your data applications, ensuring they can handle varying loads, remain highly available, and adhere to modern DevOps principles. Embracing this automated approach will not only streamline your current projects but also empower you to manage increasingly complex cloud architectures with confidence and efficiency. Invest in IaC; it’s the future of cloud resource management.
Docker has revolutionized how applications are built, shipped, and run, enabling unprecedented agility and efficiency through containerization. However, managing and understanding the performance of dynamic, ephemeral containers in a production environment presents unique challenges. Without proper visibility, resource bottlenecks, application errors, and security vulnerabilities can go unnoticed, leading to performance degradation, increased operational costs, and potential downtime. This is where robust Docker monitoring tools become indispensable.
As organizations increasingly adopt microservices architectures and container orchestration platforms like Kubernetes, the complexity of their infrastructure grows. Traditional monitoring solutions often fall short in these highly dynamic and distributed environments. Modern Docker monitoring tools are specifically designed to provide deep insights into container health, resource utilization, application performance, and log data, helping DevOps teams, developers, and system administrators ensure the smooth operation of their containerized applications.
In this in-depth guide, we will explore why Docker monitoring is critical, what key features to look for in a monitoring solution, and present the 15 best Docker monitoring tools available in 2025. Whether you’re looking for an open-source solution, a comprehensive enterprise platform, or a specialized tool, this article will help you make an informed decision to optimize your containerized infrastructure.
Why Docker Monitoring is Critical for Modern DevOps
In the fast-paced world of DevOps, where continuous integration and continuous delivery (CI/CD) are paramount, understanding the behavior of your Docker containers is non-negotiable. Here’s why robust Docker monitoring is essential:
Visibility into Ephemeral Environments: Docker containers are designed to be immutable and can be spun up and down rapidly. Traditional monitoring struggles with this transient nature. Docker monitoring tools provide real-time visibility into these short-lived components, ensuring no critical events are missed.
Performance Optimization: Identifying CPU, memory, disk I/O, and network bottlenecks at the container level is crucial for optimizing application performance. Monitoring allows you to pinpoint resource hogs and allocate resources more efficiently.
Proactive Issue Detection: By tracking key metrics and logs, monitoring tools can detect anomalies and potential issues before they impact end-users. Alerts and notifications enable teams to respond proactively to prevent outages.
Resource Efficiency: Over-provisioning resources for containers can lead to unnecessary costs, while under-provisioning can lead to performance problems. Monitoring helps right-size resources, leading to significant cost savings and improved efficiency.
Troubleshooting and Debugging: When issues arise, comprehensive monitoring provides the data needed for quick root cause analysis. Aggregated logs, traces, and metrics from multiple containers and services simplify the debugging process.
Security and Compliance: Monitoring container activity, network traffic, and access patterns can help detect security threats and ensure compliance with regulatory requirements.
Capacity Planning: Historical data collected by monitoring tools is invaluable for understanding trends, predicting future resource needs, and making informed decisions about infrastructure scaling.
Key Features to Look for in Docker Monitoring Tools
Selecting the right Docker monitoring solution requires careful consideration of various features tailored to the unique demands of containerized environments. Here are the essential capabilities to prioritize:
Container-Level Metrics: Deep visibility into CPU utilization, memory consumption, disk I/O, network traffic, and process statistics for individual containers and hosts.
Log Aggregation and Analysis: Centralized collection, parsing, indexing, and searching of logs from all Docker containers. This includes structured logging support and anomaly detection in log patterns.
Distributed Tracing: Ability to trace requests across multiple services and containers, providing an end-to-end view of transaction flows in microservices architectures.
Alerting and Notifications: Customizable alert rules based on specific thresholds or anomaly detection, with integration into communication channels like Slack, PagerDuty, email, etc.
Customizable Dashboards and Visualization: Intuitive and flexible dashboards to visualize metrics, logs, and traces in real-time, allowing for quick insights and correlation.
Integration with Orchestration Platforms: Seamless integration with Kubernetes, Docker Swarm, and other orchestrators for cluster-level monitoring and auto-discovery of services.
Application Performance Monitoring (APM): Capabilities to monitor application-specific metrics, identify code-level bottlenecks, and track user experience within containers.
Host and Infrastructure Monitoring: Beyond containers, the tool should ideally monitor the underlying host infrastructure (VMs, physical servers) to provide a complete picture.
Service Maps and Dependency Mapping: Automatic discovery and visualization of service dependencies, helping to understand the architecture and impact of changes.
Scalability and Performance: The ability to scale with your growing container infrastructure without introducing significant overhead or latency.
Security Monitoring: Detection of suspicious container activity, network breaches, or policy violations.
Cost-Effectiveness: A balance between features, performance, and pricing models (SaaS, open-source, hybrid) that aligns with your budget and operational needs.
The 15 Best Docker Monitoring Tools for 2025
Choosing the right set of Docker monitoring tools is crucial for maintaining the health and performance of your containerized applications. Here’s an in-depth look at the top contenders for 2025:
1. Datadog
Datadog is a leading SaaS-based monitoring and analytics platform that offers full-stack observability for cloud-scale applications. It provides comprehensive monitoring for Docker containers, Kubernetes, serverless functions, and traditional infrastructure, consolidating metrics, traces, and logs into a unified view.
Key Features:
Real-time container metrics and host-level resource utilization.
Advanced log management and analytics with powerful search.
Distributed tracing for microservices with APM.
Customizable dashboards and service maps for visualizing dependencies.
AI-powered anomaly detection and robust alerting.
Out-of-the-box integrations with Docker, Kubernetes, AWS, Azure, GCP, and hundreds of other technologies.
Pros:
Extremely comprehensive and unified platform for all observability needs.
Excellent user experience, intuitive dashboards, and easy setup.
Strong community support and continuous feature development.
Scales well for large and complex environments.
Cons:
Can become expensive for high data volumes, especially logs and traces.
Feature richness can have a steep learning curve for new users.
Prometheus is a powerful open-source monitoring system that collects metrics from configured targets at given intervals, evaluates rule expressions, displays the results, and can trigger alerts. Grafana is an open-source data visualization and analytics tool that allows you to query, visualize, alert on, and explore metrics, logs, and traces from various sources, making it a perfect companion for Prometheus.
Key Features (Prometheus):
Multi-dimensional data model with time series data identified by metric name and key/value pairs.
Flexible query language (PromQL) for complex data analysis.
Service discovery for dynamic environments like Docker and Kubernetes.
Built-in alerting manager.
Key Features (Grafana):
Rich and interactive dashboards.
Support for multiple data sources (Prometheus, Elasticsearch, Loki, InfluxDB, etc.).
Alerting capabilities integrated with various notification channels.
Templating and variables for dynamic dashboards.
Pros:
Open-source and free, highly cost-effective for budget-conscious teams.
Extremely powerful and flexible for custom metric collection and visualization.
Large and active community support.
Excellent for self-hosting and full control over your monitoring stack.
Cons:
Requires significant effort to set up, configure, and maintain.
Limited long-term storage capabilities without external integrations.
No built-in logging or tracing (requires additional tools like Loki or Jaeger).
3. cAdvisor (Container Advisor)
cAdvisor is an open-source tool from Google that provides container users with an understanding of the resource usage and performance characteristics of their running containers. It collects, aggregates, processes, and exports information about running containers, exposing a web interface for basic visualization and a raw data endpoint.
Key Features:
Collects CPU, memory, network, and file system usage statistics.
Provides historical resource usage information.
Supports Docker containers natively.
Lightweight and easy to deploy.
Pros:
Free and open-source.
Excellent for basic, localized container monitoring on a single host.
Easy to integrate with Prometheus for metric collection.
Cons:
Lacks advanced features like log aggregation, tracing, or robust alerting.
Not designed for large-scale, distributed environments.
User interface is basic compared to full-fledged monitoring solutions.
4. New Relic
New Relic is another full-stack observability platform offering deep insights into application and infrastructure performance, including extensive support for Docker and Kubernetes. It combines APM, infrastructure monitoring, logs, browser, mobile, and synthetic monitoring into a single solution.
Key Features:
Comprehensive APM for applications running in Docker containers.
Detailed infrastructure monitoring for hosts and containers.
Full-stack distributed tracing and service maps.
Centralized log management and analytics.
AI-powered proactive anomaly detection and intelligent alerting.
Native integration with Docker and Kubernetes.
Pros:
Provides a holistic view of application health and performance.
Strong APM capabilities for identifying code-level issues.
User-friendly interface and powerful visualization tools.
Good for large enterprises requiring end-to-end visibility.
Cons:
Can be costly, especially with high data ingest volumes.
May have a learning curve due to the breadth of features.
Sysdig Monitor is a container-native visibility platform that provides deep insights into the performance, health, and security of containerized applications and infrastructure. It’s built specifically for dynamic cloud-native environments and offers granular visibility at the process, container, and host level.
Key Features:
Deep container visibility with granular metrics.
Prometheus-compatible monitoring and custom metric collection.
Container-aware logging and auditing capabilities.
Interactive service maps and topology views.
Integrated security and forensics (Sysdig Secure).
Powerful alerting and troubleshooting features.
Pros:
Excellent for container-specific monitoring and security.
Provides unparalleled depth of visibility into container activity.
Strong focus on security and compliance in container environments.
Good for organizations prioritizing container security alongside performance.
Cons:
Can be more expensive than some other solutions.
Steeper learning curve for some advanced features.
6. Dynatrace
Dynatrace is an AI-powered, full-stack observability platform that provides automatic and intelligent monitoring for modern cloud environments, including Docker and Kubernetes. Its OneAgent technology automatically discovers, maps, and monitors all components of your application stack.
Key Features:
Automatic discovery and mapping of all services and dependencies.
AI-driven root cause analysis with Davis AI.
Full-stack monitoring: APM, infrastructure, logs, digital experience.
Code-level visibility for applications within containers.
Real-time container and host performance metrics.
Extensive Kubernetes and Docker support.
Pros:
Highly automated setup and intelligent problem detection.
Provides deep, code-level insights without manual configuration.
Excellent for complex, dynamic cloud-native environments.
Reduces mean time to resolution (MTTR) significantly.
Cons:
One of the more expensive enterprise solutions.
Resource footprint of the OneAgent might be a consideration for very small containers.
7. AppDynamics
AppDynamics, a Cisco company, is an enterprise-grade APM solution that extends its capabilities to Docker container monitoring. It provides deep visibility into application performance, user experience, and business transactions, linking them directly to the underlying infrastructure, including containers.
Key Features:
Business transaction monitoring across containerized services.
Code-level visibility into applications running in Docker.
Infrastructure visibility for Docker hosts and containers.
Automatic baselining and anomaly detection.
End-user experience monitoring.
Scalable for large enterprise deployments.
Pros:
Strong focus on business context and transaction tracing.
Excellent for large enterprises with complex application landscapes.
Helps connect IT performance directly to business outcomes.
Robust reporting and analytics features.
Cons:
High cost, typically suited for larger organizations.
Can be resource-intensive for agents.
Setup and configuration might be more complex than lightweight tools.
The Elastic Stack, comprising Elasticsearch (search and analytics engine), Logstash (data collection and processing pipeline), and Kibana (data visualization), is a popular open-source solution for log management and analytics. It’s widely used for collecting, processing, storing, and visualizing Docker container logs.
Key Features:
Centralized log aggregation from Docker containers (via Filebeat or Logstash).
Powerful search and analytics capabilities with Elasticsearch.
Rich visualization and customizable dashboards with Kibana.
Can also collect metrics (via Metricbeat) and traces (via Elastic APM).
Scalable for large volumes of log data.
Pros:
Highly flexible and customizable for log management.
Open-source components offer cost savings.
Large community and extensive documentation.
Can be extended to full-stack observability with other Elastic components.
Cons:
Requires significant effort to set up, manage, and optimize the stack.
Steep learning curve for new users, especially for performance tuning.
Resource-intensive, particularly Elasticsearch.
No built-in distributed tracing without Elastic APM.
9. Splunk
Splunk is an enterprise-grade platform for operational intelligence, primarily known for its powerful log management and security information and event management (SIEM) capabilities. It can effectively ingest, index, and analyze data from Docker containers, hosts, and applications to provide real-time insights.
Key Features:
Massive-scale log aggregation, indexing, and search.
Real-time data correlation and anomaly detection.
Customizable dashboards and powerful reporting.
Can monitor Docker daemon logs, container logs, and host metrics.
Integrates with various data sources and offers a rich app ecosystem.
Pros:
Industry-leading for log analysis and operational intelligence.
Extremely powerful search language (SPL).
Excellent for security monitoring and compliance.
Scalable for petabytes of data.
Cons:
Very expensive, pricing based on data ingest volume.
Can be complex to configure and optimize.
More focused on logs and events rather than deep APM or tracing natively.
10. LogicMonitor
LogicMonitor is a SaaS-based performance monitoring platform for hybrid IT infrastructures, including extensive support for Docker, Kubernetes, and cloud environments. It provides automated discovery, comprehensive metric collection, and intelligent alerting across your entire stack.
Key Features:
Automated discovery and monitoring of Docker containers, hosts, and services.
Pre-built monitoring templates for Docker and associated technologies.
Intelligent alerting with dynamic thresholds and root cause analysis.
Customizable dashboards and reporting.
Monitors hybrid cloud and on-premises environments from a single platform.
Pros:
Easy to deploy and configure with automated discovery.
Provides a unified view for complex hybrid environments.
Strong alerting capabilities with reduced alert fatigue.
Good support for a wide range of technologies out-of-the-box.
Cons:
Can be more expensive than open-source or some smaller SaaS tools.
May lack the deep, code-level APM of specialized tools like Dynatrace.
11. Sematext
Sematext provides a suite of monitoring and logging products, including Sematext Monitoring (for infrastructure and APM) and Sematext Logs (for centralized log management). It offers comprehensive monitoring for Docker, Kubernetes, and microservices environments, focusing on ease of use and full-stack visibility.
Key Features:
Full-stack visibility for Docker containers, hosts, and applications.
Real-time container metrics, events, and logs.
Distributed tracing with Sematext Experience.
Anomaly detection and powerful alerting.
Pre-built dashboards and customizable views.
Support for Prometheus metric ingestion.
Pros:
Offers a good balance of features across logs, metrics, and traces.
Relatively easy to set up and use.
Cost-effective compared to some enterprise alternatives, with flexible pricing.
Good for small to medium-sized teams seeking full-stack observability.
Cons:
User interface can sometimes feel less polished than market leaders.
May not scale as massively as solutions like Splunk for petabyte-scale data.
12. Instana
Instana, an IBM company, is an automated enterprise observability platform designed for modern cloud-native applications and microservices. It automatically discovers, maps, and monitors all services and infrastructure components, providing real-time distributed tracing and AI-powered root cause analysis for Docker and Kubernetes environments.
Key Features:
Fully automated discovery and dependency mapping.
Real-time distributed tracing for every request.
AI-powered root cause analysis and contextual alerting.
Comprehensive metrics for Docker containers, Kubernetes, and underlying hosts.
Code-level visibility and APM.
Agent-based with minimal configuration.
Pros:
True automated observability with zero-config setup.
Exceptional for complex microservices architectures.
Provides immediate, actionable insights into problems.
Significantly reduces operational overhead and MTTR.
Cons:
Premium pricing reflecting its advanced automation and capabilities.
May be overkill for very simple container setups.
13. Site24x7
Site24x7 is an all-in-one monitoring solution from Zoho that covers websites, servers, networks, applications, and cloud resources. It offers extensive monitoring capabilities for Docker containers, providing insights into their performance and health alongside the rest of your IT infrastructure.
Key Features:
Docker container monitoring with key metrics (CPU, memory, network, disk I/O).
Docker host monitoring.
Automated discovery of containers and applications within them.
Log management for Docker containers.
Customizable dashboards and reporting.
Integrated alerting with various notification channels.
Unified monitoring for hybrid cloud environments.
Pros:
Comprehensive all-in-one platform for diverse monitoring needs.
Relatively easy to set up and use.
Cost-effective for businesses looking for a single monitoring vendor.
Good for monitoring entire IT stack, not just Docker.
Cons:
May not offer the same depth of container-native features as specialized tools.
UI can sometimes feel a bit cluttered due to the breadth of features.
14. Netdata
Netdata is an open-source, real-time performance monitoring solution that provides high-resolution metrics for systems, applications, and containers. It’s designed to be installed on every system (or container) you want to monitor, providing instant visualization and anomaly detection without requiring complex setup.
Key Features:
Real-time, per-second metric collection for Docker containers and hosts.
Interactive, zero-configuration dashboards.
Thousands of metrics collected out-of-the-box.
Anomaly detection and customizable alerts.
Low resource footprint.
Distributed monitoring capabilities with Netdata Cloud.
Pros:
Free and open-source with optional cloud services.
Incredibly easy to install and get started, providing instant insights.
Excellent for real-time troubleshooting and granular performance analysis.
Very low overhead, suitable for edge devices and resource-constrained environments.
Cons:
Designed for real-time, local monitoring; long-term historical storage requires external integration.
Lacks integrated log management and distributed tracing features.
Scalability for thousands of nodes might require careful planning and integration with other tools.
15. Prometheus + Grafana with Blackbox Exporter and Pushgateway
While Prometheus and Grafana were discussed earlier, this specific combination highlights their extended capabilities. Integrating the Blackbox Exporter allows for external service monitoring (e.g., checking if an HTTP endpoint inside a container is reachable and responsive), while Pushgateway enables short-lived jobs to expose metrics to Prometheus. This enhances the monitoring scope beyond basic internal metrics.
Key Features:
External endpoint monitoring (HTTP, HTTPS, TCP, ICMP) for containerized applications.
Metrics collection from ephemeral and batch jobs that don’t expose HTTP endpoints.
Comprehensive time-series data storage and querying.
Flexible dashboarding and visualization via Grafana.
Highly customizable alerting.
Pros:
Extends Prometheus’s pull-based model for broader monitoring scenarios.
Increases the observability of short-lived and externally exposed services.
Still entirely open-source and highly configurable.
Excellent for specific use cases where traditional Prometheus pull isn’t sufficient.
Cons:
Adds complexity to the Prometheus setup and maintenance.
Requires careful management of the Pushgateway for cleanup and data freshness.
Still requires additional components for logs and traces.
What is Docker monitoring and why is it important?
Docker monitoring is the process of collecting, analyzing, and visualizing data (metrics, logs, traces) from Docker containers, hosts, and the applications running within them. It’s crucial for understanding container health, performance, resource utilization, and application behavior in dynamic, containerized environments, helping to prevent outages, optimize resources, and troubleshoot issues quickly.
What’s the difference between open-source and commercial Docker monitoring tools?
Open-source tools like Prometheus, Grafana, and cAdvisor are free to use and offer high flexibility and community support, but often require significant effort for setup, configuration, and maintenance. Commercial tools (e.g., Datadog, New Relic, Dynatrace) are typically SaaS-based, offer out-of-the-box comprehensive features, automated setup, dedicated support, and advanced AI-powered capabilities, but come with a recurring cost.
Can I monitor Docker containers with existing infrastructure monitoring tools?
While some traditional infrastructure monitoring tools might provide basic host-level metrics, they often lack the granular, container-aware insights needed for effective Docker monitoring. They may struggle with the ephemeral nature of containers, dynamic service discovery, and the specific metrics (like container-level CPU/memory limits and usage) that modern container monitoring tools provide. Specialized tools offer deeper integration with Docker and orchestrators like Kubernetes.
How do I choose the best Docker monitoring tool for my organization?
Consider your organization’s specific needs, budget, and existing infrastructure. Evaluate tools based on:
Features: Do you need logs, metrics, traces, APM, security?
Scalability: How many containers/hosts do you need to monitor now and in the future?
Ease of Use: How much time and expertise can you dedicate to setup and maintenance?
Integration: Does it integrate with your existing tech stack (Kubernetes, cloud providers, CI/CD)?
Cost: Compare pricing models (open-source effort vs. SaaS subscription).
Support: Is community or vendor support crucial for your team?
For small setups, open-source options are great. For complex, enterprise-grade needs, comprehensive SaaS platforms are often preferred.
Conclusion
The proliferation of Docker and containerization has undeniably transformed the landscape of software development and deployment. However, the benefits of agility and scalability come with the inherent complexity of managing highly dynamic, distributed environments. Robust Docker monitoring tools are no longer a luxury but a fundamental necessity for any organization leveraging containers in production.
The tools discussed in this guide – ranging from versatile open-source solutions like Prometheus and Grafana to comprehensive enterprise platforms like Datadog and Dynatrace – offer a spectrum of capabilities to address diverse monitoring needs. Whether you prioritize deep APM, granular log analysis, real-time metrics, or automated full-stack observability, there’s a tool tailored for your specific requirements.
Ultimately, the “best” Docker monitoring tool is one that aligns perfectly with your team’s expertise, budget, infrastructure complexity, and specific observability goals. We encourage you to evaluate several options, perhaps starting with a proof of concept, to determine which solution provides the most actionable insights and helps you maintain the health, performance, and security of your containerized applications efficiently. Thank you for reading the DevopsRoles page!
In today’s dynamic cloud landscape, organizations are constantly seeking ways to accelerate innovation while maintaining stringent governance, compliance, and cost control. As enterprises scale their adoption of AWS, the challenge of standardizing infrastructure provisioning, ensuring adherence to best practices, and empowering development teams with self-service capabilities becomes increasingly complex. This is where the synergy between AWS Service Catalog and Terraform Cloud shines, offering a powerful solution to streamline cloud resource deployment and enforce organizational policies.
This in-depth guide will explore how to master AWS Service Catalog integration with Terraform Cloud, providing you with the knowledge and practical steps to build a robust, governed, and automated cloud provisioning framework. We’ll delve into the core concepts, demonstrate practical implementation with code examples, and uncover advanced strategies to elevate your cloud infrastructure management.
Understanding AWS Service Catalog: The Foundation of Governed Self-Service
What is AWS Service Catalog?
AWS Service Catalog is a service that allows organizations to create and manage catalogs of IT services that are approved for use on AWS. These IT services can include everything from virtual machine images, servers, software, databases, and complete multi-tier application architectures. Service Catalog helps organizations achieve centralized governance and ensure compliance with corporate standards while enabling users to quickly deploy only the pre-approved IT services they need.
The primary problems AWS Service Catalog solves include:
Governance: Ensures that only approved AWS resources and architectures are provisioned.
Compliance: Helps meet regulatory and security requirements by enforcing specific configurations.
Self-Service: Empowers end-users (developers, data scientists) to provision resources without direct intervention from central IT.
Standardization: Promotes consistency in deployments across teams and projects.
Cost Control: Prevents the provisioning of unapproved, potentially costly resources.
Key Components of AWS Service Catalog
To effectively utilize AWS Service Catalog, it’s crucial to understand its core components:
Products: A product is an IT service that you want to make available to end-users. It can be a single EC2 instance, a configured RDS database, or a complex application stack. Products are defined by a template, typically an AWS CloudFormation template, but crucially for this article, they can also be defined by Terraform configurations.
Portfolios: A portfolio is a collection of products. It allows you to organize products, control access to them, and apply constraints to ensure proper usage. For example, you might have separate portfolios for “Development,” “Production,” or “Data Science” teams.
Constraints: Constraints define how end-users can deploy a product. They can be of several types:
Launch Constraints: Specify an IAM role that AWS Service Catalog assumes to launch the product. This decouples the end-user’s permissions from the permissions required to provision the resources, enabling least privilege.
Template Constraints: Apply additional rules or modifications to the underlying template during provisioning, ensuring compliance (e.g., specific instance types allowed).
TagOption Constraints: Automate the application of tags to provisioned resources, aiding in cost allocation and resource management.
Provisioned Products: An instance of a product that an end-user has launched.
Introduction to Terraform Cloud
What is Terraform Cloud?
Terraform Cloud is a managed service offered by HashiCorp that provides a collaborative platform for infrastructure as code (IaC) using Terraform. While open-source Terraform excels at provisioning and managing infrastructure, Terraform Cloud extends its capabilities with a suite of features designed for team collaboration, governance, and automation in production environments.
Key features of Terraform Cloud include:
Remote State Management: Securely stores and manages Terraform state files, preventing concurrency issues and accidental deletions.
Remote Operations: Executes Terraform runs remotely, reducing the need for local installations and ensuring consistent environments.
Version Control System (VCS) Integration: Automatically triggers Terraform runs on code changes in integrated VCS repositories (GitHub, GitLab, Bitbucket, Azure DevOps).
Team & Governance Features: Provides role-based access control (RBAC), policy as code (Sentinel), and cost estimation tools.
Private Module Registry: Allows organizations to share and reuse Terraform modules internally.
API-Driven Workflow: Enables programmatic interaction and integration with CI/CD pipelines.
Why Terraform for AWS Service Catalog?
Traditionally, AWS Service Catalog relied heavily on CloudFormation templates for defining products. While CloudFormation is powerful, Terraform offers several advantages that make it an excellent choice for defining AWS Service Catalog products, especially for organizations already invested in the Terraform ecosystem:
Multi-Cloud/Hybrid Cloud Consistency: Terraform’s provider model supports various cloud providers, allowing a consistent IaC approach across different environments if needed.
Mature Ecosystem: A vast community, rich module ecosystem, and strong tooling support.
Declarative and Idempotent: Ensures that your infrastructure configuration matches the desired state, making deployments predictable.
State Management: Terraform’s state file precisely maps real-world resources to your configuration.
Advanced Resource Management: Offers powerful features like `count`, `for_each`, and data sources that can simplify complex configurations.
Using Terraform Cloud further enhances this by providing a centralized, secure, and collaborative environment to manage these Terraform-defined Service Catalog products.
The Synergistic Benefits: AWS Service Catalog and Terraform Cloud
Combining AWS Service Catalog with Terraform Cloud creates a powerful synergy that addresses many challenges in modern cloud infrastructure management:
Enhanced Governance and Compliance
Policy as Code (Sentinel): Terraform Cloud’s Sentinel policies can enforce pre-provisioning checks, ensuring that proposed infrastructure changes comply with organizational security, cost, and operational standards before they are even submitted to Service Catalog.
Launch Constraints: Service Catalog’s launch constraints ensure that products are provisioned with specific, high-privileged IAM roles, while end-users only need permission to launch the product, adhering to the principle of least privilege.
Standardized Modules: Using private Terraform modules in Terraform Cloud ensures that all Service Catalog products are built upon approved, audited, and version-controlled infrastructure patterns.
Standardized Provisioning and Self-Service
Consistent Deployments: Terraform’s declarative nature, managed by Terraform Cloud, ensures that every time a user provisions a product, it’s deployed consistently according to the defined template.
Developer Empowerment: Developers and other end-users can provision their required infrastructure through a user-friendly Service Catalog interface, without needing deep AWS or Terraform expertise.
Version Control: Terraform Cloud’s VCS integration means that all infrastructure definitions are versioned, auditable, and easily revertible.
Accelerated Deployment and Reduced Operational Overhead
Automation: Automated Terraform runs via Terraform Cloud eliminate manual steps, speeding up the provisioning process.
Reduced Rework: Standardized products reduce the need for central IT to manually configure resources for individual teams.
Auditing and Transparency: Terraform Cloud provides detailed logs of all runs, and AWS Service Catalog tracks who launched which product, offering complete transparency.
Prerequisites and Setup
Before diving into implementation, ensure you have the following:
AWS Account Configuration
An active AWS account with administrative access for initial setup.
An IAM user or role with permissions to create and manage AWS Service Catalog resources (servicecatalog:*), IAM roles, S3 buckets, and any other resources your products will provision. It’s recommended to follow the principle of least privilege.
Terraform Cloud Workspace Setup
A Terraform Cloud account. You can sign up for a free tier.
An organization within Terraform Cloud.
A new workspace for your Service Catalog products. Connect this workspace to a VCS repository (e.g., GitHub) where your Terraform configurations will reside.
Configure AWS credentials in your Terraform Cloud workspace. This can be done via environment variables (e.g., AWS_ACCESS_KEY_ID, AWS_SECRET_ACCESS_KEY, AWS_SESSION_TOKEN) or by using AWS assumed roles directly within Terraform Cloud.
Example of setting environment variables in Terraform Cloud workspace:
Go to your workspace settings.
Navigate to “Environment Variables”.
Add AWS_ACCESS_KEY_ID and AWS_SECRET_ACCESS_KEY as sensitive variables.
Optionally, add AWS_REGION.
IAM Permissions for Service Catalog
You’ll need specific IAM permissions:
For the Terraform User/Role: Permissions to create/manage Service Catalog resources, IAM roles, and the resources provisioned by your products.
For the Service Catalog Launch Role: This is an IAM role that AWS Service Catalog assumes to provision resources. It needs permissions to create all resources defined in your product’s Terraform configuration. This role will be specified in the “Launch Constraint” for your portfolio.
For the End-User: Permissions to access and provision products from the Service Catalog UI. Typically, this involves servicecatalog:List*, servicecatalog:Describe*, and servicecatalog:ProvisionProduct.
Step-by-Step Implementation: Creating a Simple Product
Let’s walk through creating a simple S3 bucket product in AWS Service Catalog using Terraform Cloud. This will involve defining the S3 bucket in Terraform, packaging it as a Service Catalog product, and making it available through a portfolio.
Defining the Product in Terraform (Example: S3 Bucket)
First, we’ll create a reusable Terraform module for our S3 bucket. This module will be the “product” that users can provision.
Terraform Module for S3 Bucket
Create a directory structure like this in your VCS repository:
variable "bucket_name" {
  description = "Desired name of the S3 bucket."
  type        = string
}

variable "acl" {
  description = "Canned ACL to apply to the S3 bucket. Private is recommended."
  type        = string
  default     = "private"
  validation {
    condition     = contains(["private", "public-read", "public-read-write", "aws-exec-read", "authenticated-read", "bucket-owner-read", "bucket-owner-full-control", "log-delivery-write"], var.acl)
    error_message = "Invalid ACL provided. Must be one of the AWS S3 canned ACLs."
  }
}

variable "tags" {
  description = "A map of tags to assign to the bucket."
  type        = map(string)
  default     = {}
}
Now, we need a root Terraform configuration that will define the Service Catalog product and portfolio. This will reside in the main directory.
my-service-catalog-products/versions.tf:
terraform {
  required_version = ">= 1.0.0"
  required_providers {
    aws = {
      source  = "hashicorp/aws"
      version = "~> 5.0"
    }
  }
  cloud {
    organization = "your-tfc-org-name" # Replace with your Terraform Cloud organization name
    workspaces {
      name = "service-catalog-products-workspace" # Replace with your Terraform Cloud workspace name
    }
  }
}

provider "aws" {
  region = "us-east-1" # Or your desired region
}
my-service-catalog-products/main.tf (This is where the Service Catalog resources will be defined):
# IAM Role for Service Catalog to launch products
resource "aws_iam_role" "servicecatalog_launch_role" {
  name = "ServiceCatalogLaunchRole"

  assume_role_policy = jsonencode({
    Version = "2012-10-17"
    Statement = [
      {
        Action = "sts:AssumeRole"
        Effect = "Allow"
        Principal = {
          Service = "servicecatalog.amazonaws.com"
        }
      },
      {
        Action = "sts:AssumeRole"
        Effect = "Allow"
        Principal = {
          AWS = data.aws_caller_identity.current.account_id # Allows current account to assume this role for testing
        }
      }
    ]
  })
}

resource "aws_iam_role_policy" "servicecatalog_launch_policy" {
  name = "ServiceCatalogLaunchPolicy"
  role = aws_iam_role.servicecatalog_launch_role.id

  policy = jsonencode({
    Version = "2012-10-17"
    Statement = [
      {
        Action   = ["s3:*", "iam:GetRole", "iam:PassRole"], # Grant necessary permissions for S3 product
        Effect   = "Allow",
        Resource = "*"
      },
      # Add other permissions as needed for more complex products
    ]
  })
}

data "aws_caller_identity" "current" {}
Creating an AWS Service Catalog Product in Terraform Cloud
Now, let’s define the AWS Service Catalog product using Terraform. This product will point to our S3 bucket module.
Add the following to my-service-catalog-products/main.tf:
resource "aws_servicecatalog_product" "s3_bucket_product" {
  name          = "Standard S3 Bucket"
  owner         = "IT Operations"
  type          = "CLOUD_FORMATION_TEMPLATE" # Service Catalog still requires this type, but it provisions Terraform-managed resources via CloudFormation
  description   = "Provisions a private S3 bucket with public access blocked."
  distributor   = "Cloud Engineering"
  support_email = "cloud-support@example.com"
  support_url   = "https://wiki.example.com/s3-bucket-product"

  provisioning_artifact_parameters {
    template_type = "TERRAFORM_OPEN_SOURCE" # This is the crucial part for Terraform
    name          = "v1.0"
    description   = "Initial version of the S3 Bucket product."
    # The INFO property defines how Service Catalog interacts with Terraform Cloud
    info = {
      "CloudFormationTemplate" = jsonencode({
        AWSTemplateFormatVersion = "2010-09-09"
        Description              = "AWS Service Catalog product for a Standard S3 Bucket (managed by Terraform Cloud)"
        Parameters = {
          BucketName = {
            Type        = "String"
            Description = "Desired name for the S3 bucket (must be globally unique)."
          }
          BucketAcl = {
            Type        = "String"
            Description = "Canned ACL to apply to the S3 bucket. (e.g., private, public-read)"
            Default     = "private"
          }
          TagsJson = {
            Type        = "String"
            Description = "JSON string of tags for the S3 bucket (e.g., {\"Project\":\"MyProject\"})"
            Default     = "{}"
          }
        }
        Resources = {
          TerraformProvisioner = {
            Type       = "Community::Terraform::TFEProduct" # This is a placeholder type. In reality, you'd use a custom resource for TFC integration
            Properties = {
              WorkspaceId = "ws-xxxxxxxxxxxxxxxxx" # Placeholder: You would dynamically get this or embed it from TFC API
              BucketName  = { "Ref" : "BucketName" }
              BucketAcl   = { "Ref" : "BucketAcl" }
              TagsJson    = { "Ref" : "TagsJson" }
              # ... other Terraform variables passed as parameters
            }
          }
        }
        Outputs = {
          BucketId = {
            Description = "The name of the provisioned S3 bucket."
            Value       = { "Fn::GetAtt" : ["TerraformProvisioner", "BucketId"] }
          }
          BucketArn = {
            Description = "The ARN of the provisioned S3 bucket."
            Value       = { "Fn::GetAtt" : ["TerraformProvisioner", "BucketArn"] }
          }
        }
      })
    }
  }
}
Important Note on `Community::Terraform::TFEProduct` and `info` property:
The above code snippet for `aws_servicecatalog_product` illustrates the *concept* of how Service Catalog interacts with Terraform. In a real-world scenario, the `info` property’s `CloudFormationTemplate` would point to an AWS CloudFormation template that contains a Custom Resource (e.g., using Lambda) or a direct integration that calls the Terraform Cloud API to perform the `terraform apply`. AWS provides official documentation and reference architectures for integrating with Terraform Open Source which also applies to Terraform Cloud via its API. This typically involves:
A CloudFormation template that defines the parameters.
A Lambda function that receives these parameters, interacts with the Terraform Cloud API (e.g., by creating a new run for a specific workspace, passing variables), and reports back the status to CloudFormation.
For simplicity and clarity of the core Terraform Cloud integration, the provided `info` block above uses a conceptual `Community::Terraform::TFEProduct` type. In a full implementation, you would replace this with the actual CloudFormation template that invokes your Terraform Cloud workspace via an intermediary Lambda function.
Creating an AWS Service Catalog Portfolio
Next, define a portfolio to hold our S3 product.
Add the following to my-service-catalog-products/main.tf:
resource "aws_servicecatalog_portfolio" "dev_portfolio" {
  name          = "Dev Team Portfolio"
  description   = "Products approved for Development teams"
  provider_name = "Cloud Engineering"
}
Associating Product with Portfolio
Link the product to the portfolio.
Add the following to my-service-catalog-products/main.tf:
This is critical for security. We’ll use a Launch Constraint to specify the IAM role AWS Service Catalog will assume to provision the S3 bucket.
Add the following to my-service-catalog-products/main.tf:
resource "aws_servicecatalog_service_action" "s3_provision_action" {
  name        = "Provision S3 Bucket"
  description = "Action to provision a standard S3 bucket."
  definition {
    name = "TerraformRun" # This should correspond to a TFC run action
    # The actual definition here would involve a custom action that
    # triggers a Terraform Cloud run or an equivalent mechanism.
    # For a fully managed setup, this would be part of the Custom Resource logic.
    # For now, we'll keep it simple and assume the Lambda-backed CFN handles it.
  }
}

resource "aws_servicecatalog_constraint" "s3_launch_constraint" {
  description          = "Launch constraint for S3 Bucket product"
  portfolio_id         = aws_servicecatalog_portfolio.dev_portfolio.id
  product_id           = aws_servicecatalog_product.s3_bucket_product.id
  type                 = "LAUNCH"
  parameters           = jsonencode({
    RoleArn = aws_iam_role.servicecatalog_launch_role.arn
  })
}

# Grant end-user access to the portfolio
resource "aws_servicecatalog_portfolio_share" "dev_portfolio_share" {
  portfolio_id = aws_servicecatalog_portfolio.dev_portfolio.id
  account_id   = data.aws_caller_identity.current.account_id # Share with the same account for testing
  # Optionally, you can add an OrganizationNode for sharing across AWS Organizations
}

# Example of an IAM role for an end-user to access the portfolio and launch products
resource "aws_iam_role" "end_user_role" {
  name = "ServiceCatalogEndUserRole"
  assume_role_policy = jsonencode({
    Version = "2012-10-17"
    Statement = [
      {
        Action = "sts:AssumeRole"
        Effect = "Allow"
        Principal = {
          AWS = data.aws_caller_identity.current.account_id
        }
      }
    ]
  })
}

resource "aws_iam_role_policy_attachment" "end_user_sc_access" {
  role       = aws_iam_role.end_user_role.name
  policy_arn = "arn:aws:iam::aws:policy/AWSServiceCatalogEndUserFullAccess" # Use full access for demo, restrict in production
}
Commit these Terraform files to your VCS repository. Terraform Cloud, configured with the correct workspace and VCS integration, will detect the changes and initiate a plan. Once approved and applied, your AWS Service Catalog will be populated with the defined product and portfolio.
When an end-user navigates to the AWS Service Catalog console, they will see the “Dev Team Portfolio” and the “Standard S3 Bucket” product. When they provision it, the Service Catalog will trigger the underlying CloudFormation stack, which in turn calls Terraform Cloud (via the custom resource/Lambda function) to execute the Terraform configuration defined in your S3 module, provisioning the S3 bucket.
Advanced Scenarios and Best Practices
Versioning Products
Infrastructure evolves. AWS Service Catalog and Terraform Cloud handle this gracefully:
Terraform Cloud Modules: Maintain different versions of your Terraform modules in a private module registry or by tagging your Git repository.
Service Catalog Provisioning Artifacts: When your Terraform module changes, create a new provisioning artifact (e.g., v2.0) for your AWS Service Catalog product. This allows users to choose which version to deploy and enables seamless updates of existing provisioned products.
Using Launch Constraints
Always use launch constraints. This is a fundamental security practice. The IAM role specified in the launch constraint should have only the minimum necessary permissions to create the resources defined in your product’s Terraform configuration. This ensures that end-users, who only have permission to provision a product, cannot directly perform privileged actions in AWS.
Parameterization with Terraform Variables
Leverage Terraform variables to make your Service Catalog products flexible. For example, the S3 bucket product had `bucket_name` and `acl` as variables. These translate into input parameters that users see when provisioning the product in AWS Service Catalog. Carefully define variable types, descriptions, and validations to guide users.
Integrating with CI/CD Pipelines
Terraform Cloud is designed for CI/CD integration:
VCS-Driven Workflow: Any pull request or merge to your main branch (connected to a Terraform Cloud workspace) can trigger a `terraform plan` for review. Merges can automatically trigger `terraform apply`.
Terraform Cloud API: For more complex scenarios, use the Terraform Cloud API to programmatically trigger runs, check statuses, and manage workspaces, allowing custom CI/CD pipelines to manage your Service Catalog products and their underlying Terraform code.
Tagging and Cost Allocation
Implement a robust tagging strategy. Use Service Catalog TagOption constraints to automatically apply standardized tags (e.g., CostCenter, Project, Owner) to all resources provisioned through Service Catalog. Combine this with Terraform’s ability to propagate tags throughout resources to ensure comprehensive cost allocation and resource management.
This is the most frequent source of errors. Ensure that:
The Terraform Cloud user/role has permissions to create/manage Service Catalog, IAM roles, and all target resources.
The Service Catalog Launch Role has permissions for all actions required by your product’s Terraform configuration (e.g., `s3:CreateBucket`, `ec2:RunInstances`).
End-users have `servicecatalog:ProvisionProduct` and necessary `servicecatalog:List*` permissions.
Always review AWS CloudTrail logs and Terraform Cloud run logs for specific permission denied errors.
Product Provisioning Failures
If a provisioned product fails, check:
Terraform Cloud Run Logs: Access the specific run in Terraform Cloud that was triggered by Service Catalog. This will show `terraform plan` and `terraform apply` output, including any errors.
AWS CloudFormation Stack Events: In the AWS console, navigate to CloudFormation. Each provisioned product creates a stack. The events tab will show the failure reason, often indicating issues with the custom resource or the Lambda function integrating with Terraform Cloud.
Input Parameters: Verify that the parameters passed from Service Catalog to your Terraform configuration are correct and in the expected format.
Terraform State Management
Ensure that each Service Catalog product instance corresponds to a unique and isolated Terraform state file. Terraform Cloud workspaces inherently provide this isolation. Avoid sharing state files between different provisioned products, as this can lead to conflicts and unexpected changes.
Frequently Asked Questions
What is the difference between AWS Service Catalog and AWS CloudFormation?
AWS CloudFormation is an Infrastructure as Code (IaC) service for defining and provisioning AWS infrastructure resources using templates. AWS Service Catalog is a service that allows organizations to create and manage catalogs of IT services (which can be defined by CloudFormation templates or Terraform configurations) approved for use on AWS. Service Catalog sits on top of IaC tools like CloudFormation or Terraform to provide governance, self-service, and standardization for end-users.
Can I use Terraform Open Source directly with AWS Service Catalog without Terraform Cloud?
Yes, it’s possible, but it requires more effort to manage state, provide execution environments, and integrate with Service Catalog. You would typically use a custom resource in a CloudFormation template that invokes a Lambda function. This Lambda function would then run Terraform commands (e.g., using a custom-built container with Terraform) and manage its state (e.g., in S3). Terraform Cloud simplifies this significantly by providing a managed service for remote operations, state, and VCS integration.
How does AWS Service Catalog handle updates to provisioned products?
When you update your Terraform configuration (e.g., create a new version of your S3 bucket module), you create a new “provisioning artifact” (version) for your AWS Service Catalog product. End-users can then update their existing provisioned products to this new version directly from the Service Catalog UI. Service Catalog will trigger the underlying update process via CloudFormation/Terraform Cloud.
What are the security best practices when integrating Service Catalog with Terraform Cloud?
Key best practices include:
Least Privilege: Ensure the Service Catalog Launch Role has only the minimum necessary permissions.
Secrets Management: Use AWS Secrets Manager or Parameter Store for any sensitive data, and reference them in your Terraform configuration. Do not hardcode secrets.
VCS Security: Protect your Terraform code repository with branch protections and code reviews.
Terraform Cloud Permissions: Implement RBAC within