Tag Archives: Linux

Mastering the Netstat Command in Linux: A Comprehensive Guide with Examples

Introduction

Welcome to this tutorial where I’ll guide you through the basics to advanced uses of the netstat command in Linux, with practical examples to help you master this tool.

What is Netstat?

Netstat is a command-line utility used to display all active network connections, both incoming and outgoing, on Unix, Linux, and Windows NT-based systems. It’s invaluable for network administration and monitoring.

Details can be found on the netstat command manual page:

[root@DevopsRoles ~]# man netstat | more

Detailed Usage of the Netstat Command in Linux

Here’s how you can use the netstat command in Linux to explore various network statistics:

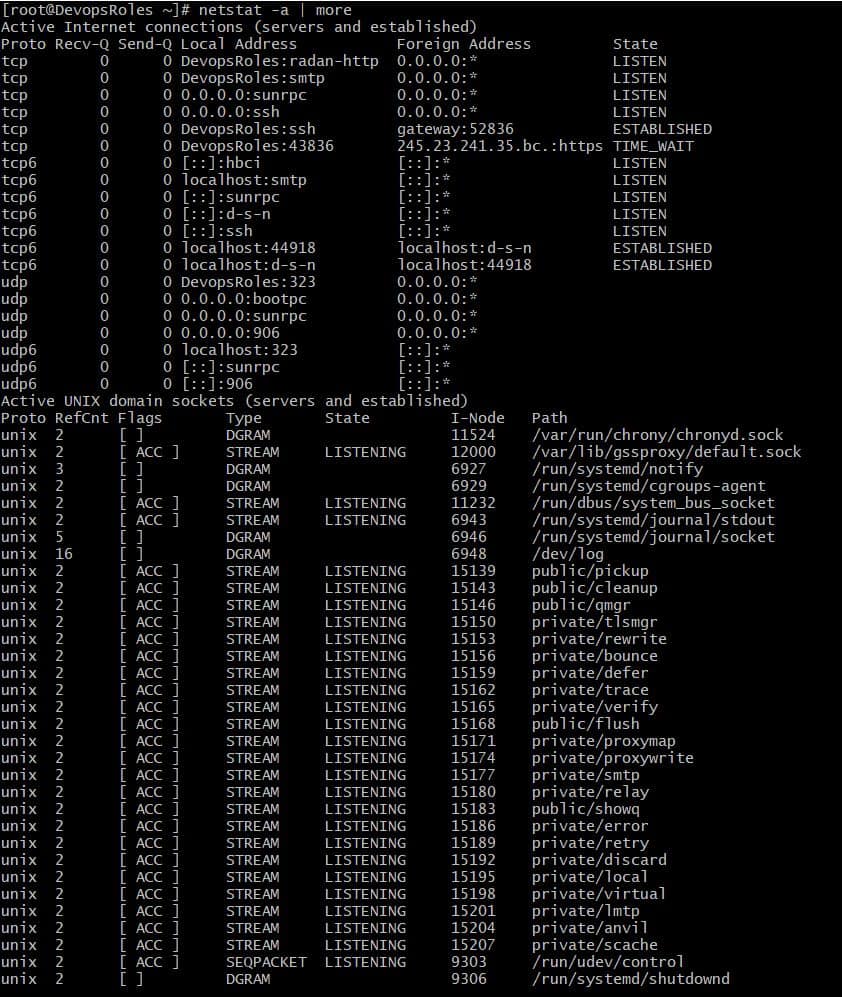
1. List all LISTENING Ports of TCP and UDP connections using netstat -a option

2. Viewing Open TCP Socket Connections

This displays all active TCP connections. Execute this command to see detailed socket information.

[root@DevopsRoles ~]# netstat -nplt
Active Internet connections (only servers)
Proto Recv-Q Send-Q Local Address           Foreign Address         State       PID/Program name
tcp        0      0 127.0.0.1:8088          0.0.0.0:*               LISTEN      659/influxd
tcp        0      0 127.0.0.1:25            0.0.0.0:*               LISTEN      792/master
tcp        0      0 0.0.0.0:111             0.0.0.0:*               LISTEN      319/rpcbind
tcp        0      0 0.0.0.0:22              0.0.0.0:*               LISTEN      655/sshd
tcp6       0      0 :::3000                 :::*                    LISTEN      662/grafana-server
tcp6       0      0 ::1:25                  :::*                    LISTEN      792/master
tcp6       0      0 :::111                  :::*                    LISTEN      319/rpcbind
tcp6       0      0 :::8086                 :::*                    LISTEN      659/influxd
tcp6       0      0 :::22                   :::*                    LISTEN      655/sshd

3. Viewing Open UDP Socket Connections

Similar to TCP, this command shows all UDP connections currently open and active.

[root@DevopsRoles ~]# netstat -nplu
Active Internet connections (only servers)
Proto Recv-Q Send-Q Local Address           Foreign Address         State       PID/Program name
udp        0      0 127.0.0.1:323           0.0.0.0:*                           313/chronyd
udp        0      0 0.0.0.0:68              0.0.0.0:*                           464/dhclient
udp        0      0 0.0.0.0:111             0.0.0.0:*                           319/rpcbind
udp        0      0 0.0.0.0:906             0.0.0.0:*                           319/rpcbind
udp6       0      0 ::1:323                 :::*                                313/chronyd
udp6       0      0 :::111                  :::*                                319/rpcbind
udp6       0      0 :::906                  :::*                                319/rpcbind

4. List all TCP Listening Ports

[root@DevopsRoles ~]# netstat -lt
Active Internet connections (only servers)
Proto Recv-Q Send-Q Local Address           Foreign Address         State
tcp        0      0 DevopsRoles:radan-http  0.0.0.0:*               LISTEN
tcp        0      0 DevopsRoles:smtp        0.0.0.0:*               LISTEN
tcp        0      0 0.0.0.0:sunrpc          0.0.0.0:*               LISTEN
tcp        0      0 0.0.0.0:ssh             0.0.0.0:*               LISTEN
tcp6       0      0 [::]:hbci               [::]:*                  LISTEN
tcp6       0      0 localhost:smtp          [::]:*                  LISTEN
tcp6       0      0 [::]:sunrpc             [::]:*                  LISTEN
tcp6       0      0 [::]:d-s-n              [::]:*                  LISTEN
tcp6       0      0 [::]:ssh                [::]:*                  LISTEN

4. List all UDP Listening Ports

[root@DevopsRoles ~]# netstat -lu
Active Internet connections (only servers)
Proto Recv-Q Send-Q Local Address           Foreign Address         State
udp        0      0 DevopsRoles:323         0.0.0.0:*
udp        0      0 0.0.0.0:bootpc          0.0.0.0:*
udp        0      0 0.0.0.0:sunrpc          0.0.0.0:*
udp        0      0 0.0.0.0:906             0.0.0.0:*
udp6       0      0 localhost:323           [::]:*
udp6       0      0 [::]:sunrpc             [::]:*
udp6       0      0 [::]:906                [::]:*

5. Show Statistics by Protocol

[root@DevopsRoles ~]# netstat -s
Ip:
    9607 total packets received
    0 forwarded
    0 incoming packets discarded
    9605 incoming packets delivered
    4614 requests sent out
    7 outgoing packets dropped
Icmp:
    16 ICMP messages received
    0 input ICMP message failed.
    ICMP input histogram:
        destination unreachable: 16
    16 ICMP messages sent
    0 ICMP messages failed
    ICMP output histogram:
        destination unreachable: 16
IcmpMsg:
        InType3: 16
        OutType3: 16
Tcp:
    267 active connections openings
    412 passive connection openings
    2 failed connection attempts
    3 connection resets received
    3 connections established
    20699 segments received
    19546 segments send out
    66 segments retransmited
    0 bad segments received.
    13 resets sent
Udp:
    184 packets received
    16 packets to unknown port received.
    0 packet receive errors
    200 packets sent
    0 receive buffer errors
    0 send buffer errors
UdpLite:
TcpExt:
    255 TCP sockets finished time wait in fast timer
    245 delayed acks sent
    16 delayed acks further delayed because of locked socket
    Quick ack mode was activated 66 times
    6400 packet headers predicted
    2503 acknowledgments not containing data payload received
    8067 predicted acknowledgments
    TCPLossProbes: 66
    TCPLossProbeRecovery: 65
    66 DSACKs sent for old packets
    66 DSACKs received
    TCPDSACKIgnoredNoUndo: 65
    TCPRcvCoalesce: 3322
    TCPOrigDataSent: 14558
    TCPHystartTrainDetect: 7
    TCPHystartTrainCwnd: 124
IpExt:
    InNoRoutes: 2
    InOctets: 1806054
    OutOctets: 7957156
    InNoECTPkts: 9899

6. Displaying Service name with PID

[root@DevopsRoles ~]# netstat -tp
Active Internet connections (w/o servers)
Proto Recv-Q Send-Q Local Address           Foreign Address         State       PID/Program name
tcp        0      0 DevopsRoles:ssh         gateway:52836           ESTABLISHED 2434/sshd: vagrant
tcp6       0      0 localhost:44918         localhost:d-s-n         ESTABLISHED 654/telegraf
tcp6       0      0 localhost:d-s-n         localhost:44918         ESTABLISHED 659/influxd

7. Displaying Promiscuous Mode

[root@DevopsRoles ~]# netstat -ac 6 | grep tcp
tcp        0      0 DevopsRoles:radan-http  0.0.0.0:*               LISTEN
tcp        0      0 DevopsRoles:smtp        0.0.0.0:*               LISTEN
tcp        0      0 0.0.0.0:sunrpc          0.0.0.0:*               LISTEN
tcp        0      0 0.0.0.0:ssh             0.0.0.0:*               LISTEN
tcp        0      0 DevopsRoles:ssh         gateway:52836           ESTABLISHED
tcp6       0      0 [::]:hbci               [::]:*                  LISTEN
tcp6       0      0 localhost:smtp          [::]:*                  LISTEN
tcp6       0      0 [::]:sunrpc             [::]:*                  LISTEN
tcp6       0      0 [::]:d-s-n              [::]:*                  LISTEN
tcp6       0      0 [::]:ssh                [::]:*                  LISTEN
tcp6       0      0 localhost:44918         localhost:d-s-n         ESTABLISHED
tcp6       0      0 localhost:d-s-n         localhost:44918         ESTABLISHED

8. Show Network Interface Transactions

[root@DevopsRoles ~]# netstat -i
Kernel Interface table
Iface             MTU    RX-OK RX-ERR RX-DRP RX-OVR    TX-OK TX-ERR TX-DRP TX-OVR Flg
eth0             1500    10190      0      0 0          8724      0      0      0 BMRU
lo              65536    12237      0      0 0         12237      0      0      0 LRU

9. Find Listening Programs

[root@DevopsRoles ~]# netstat -ap | grep grafana
tcp6       0      0 [::]:hbci               [::]:*                  LISTEN      662/grafana-server
unix  3      [ ]         STREAM     CONNECTED     14247    662/grafana-server

Conclusion

By following the netstat examples provided, you can effectively leverage the netstat command in Linux to gain insights into your system’s network connections. This guide aims to be a practical resource for both new and seasoned users. Thank you for choosing DevopsRoles for your learning needs!

Influxdb getting started

Introduction

In this tutorial, we get started with InfluxDB. we can use commands with InfluxDB. In the latter-mentioned post, I created a “telegraf” database in InfluxDB.

Let’s know if InfluxDB getting started

Now jump into InfluxDB.

[root@devopsroles.localhost ~]# influx
Connected to http://localhost:8086 version 1.7.4
InfluxDB shell version: 1.7.4
Enter an InfluxQL query
> 

View a list of all the databases using the “show databases” command.

> show databases                                                                                                                                                                                                                             
name: databases
name
----
_internal
netdata
monitoring
telegraf
opentsdb
> 

“_internal” is an internal InfluxDB database. To use telegraf database the “use telegraf” command:

> use telegraf                                                                                                                                                                                                                               
Using database telegraf

Now we are inside of the telegraf database. using the “show measurements” command:

> show measurements                                                                                                                                                                                                                          
name: measurements
name
----
cpu
disk
diskio
kernel
mem
processes
swap
system

Field Keys in the telegraf database.

> show field keys                                                                                                                                                                                                                            
name: cpu
fieldKey         fieldType
--------         ---------
usage_guest      float
usage_guest_nice float
usage_idle       float
usage_iowait     float
usage_irq        float
usage_nice       float
usage_softirq    float
usage_steal      float
usage_system     float
usage_user       float

name: disk
fieldKey     fieldType
--------     ---------
free         integer
inodes_free  integer
inodes_total integer
inodes_used  integer
total        integer
used         integer
used_percent float

name: diskio
fieldKey         fieldType
--------         ---------
io_time          integer
iops_in_progress integer
read_bytes       integer
read_time        integer
reads            integer
weighted_io_time integer
write_bytes      integer
write_time       integer
writes           integer

name: kernel
fieldKey         fieldType
--------         ---------
boot_time        integer
context_switches integer
entropy_avail    integer
interrupts       integer
processes_forked integer

name: mem
fieldKey          fieldType
--------          ---------
active            integer
available         integer
available_percent float
buffered          integer
cached            integer
commit_limit      integer
committed_as      integer
dirty             integer
free              integer
high_free         integer
high_total        integer
huge_page_size    integer
huge_pages_free   integer
huge_pages_total  integer
inactive          integer
low_free          integer
low_total         integer
mapped            integer
page_tables       integer
shared            integer
slab              integer
swap_cached       integer
swap_free         integer
swap_total        integer
total             integer
used              integer
used_percent      float
vmalloc_chunk     integer
vmalloc_total     integer
vmalloc_used      integer
wired             integer
write_back        integer
write_back_tmp    integer

name: processes
fieldKey      fieldType
--------      ---------
blocked       integer
dead          integer
idle          integer
paging        integer
running       integer
sleeping      integer
stopped       integer
total         integer
total_threads integer
unknown       integer
zombies       integer

name: swap
fieldKey     fieldType
--------     ---------
free         integer
in           integer
out          integer
total        integer
used         integer
used_percent float

name: system
fieldKey      fieldType
--------      ---------
load1         float
load15        float
load5         float
n_cpus        integer
n_users       integer
uptime        integer
uptime_format string

Tag Keys in the telegraf database.

> show tag keys                                                                                                                                                                                                                              
name: cpu
tagKey
------
cpu
host

name: disk
tagKey
------
device
fstype
host
mode
path

name: diskio
tagKey
------
host
name

name: kernel
tagKey
------
host

name: mem
tagKey
------
host

name: processes
tagKey
------
host

name: swap
tagKey
------
host

name: system
tagKey
------
host

InfluxDB Queries

How fields and tags work together. For example as below

> select * from cpu where time > now() - 10s                                                                                                                                                                                                 
name: cpu
time                cpu       host                         usage_guest usage_guest_nice usage_idle       usage_iowait      usage_irq usage_nice usage_softirq usage_steal usage_system        usage_user
----                ---       ----                         ----------- ---------------- ----------       ------------      --------- ---------- ------------- ----------- ------------        ----------
1557722520000000000 cpu-total devopsroles.localhost 0           0                92.4924924924855 6.106106106081209 0         0          0             0           0.30030030030030713 1.10110110109885
1557722520000000000 cpu0      devopsroles.localhost 0           0                92.4924924924855 6.106106106081209 0         0          0             0           0.30030030030030713 1.10110110109885

> select * from cpu where cpu='cpu-total' and host='devopsroles.localhost' and time > now() - 10s                                                                                                                                     
name: cpu
time                cpu       host                         usage_guest usage_guest_nice usage_idle       usage_iowait      usage_irq usage_nice usage_softirq usage_steal usage_system        usage_user
----                ---       ----                         ----------- ---------------- ----------       ------------      --------- ---------- ------------- ----------- ------------        ----------
1557727830000000000 cpu-total devopsroles.localhost 0           0                96.7967967967239 2.402402402420665 0         0          0             0           0.20020020020020476 0.6006006006006143

> select usage_user,cpu,host from cpu where cpu='cpu-total' and host='devopsroles.localhost' and time > now() - 20s                                                                                                                   
name: cpu
time                usage_user         cpu       host
----                ----------         ---       ----
1557727930000000000 1.6016016016016381 cpu-total devopsroles.localhost

Series is a “collection of data in InfluxDB’s data structure that share a measurement, tag set, and retention policy.” Thank you for reading the DevopsRoles page!

Influxdb getting started. Influxdb getting started. Influxdb getting started.

How to install Telegraf on Linux

Introduction

Telegraf is a versatile and efficient agent for collecting and reporting metrics. It supports a wide array of data stores such as InfluxDB, Graphite, OpenTSDB, Datadog, and many more. This guide will walk you through the process of installing Telegraf on various Linux distributions, including Ubuntu and CentOS, ensuring you can get started with minimal hassle. How to install Telegraf on Linux is a step below.

Features of Telegraf

  • Supports Multiple Datastores: Compatible with InfluxDB, Graphite, OpenTSDB, Datadog, and many others.
  • Plugin-Driven: Easily extendable through numerous input and output plugins.
  • Small Memory Footprint: Designed to be lightweight and efficient.

Prerequisites

Before proceeding with the installation, ensure your system meets the following requirements:

  • A Linux distribution (Ubuntu, CentOS, Debian, etc.)
  • Root or sudo access to the system
  • Internet connection for downloading Telegraf packages

Installation Steps

RedHat & CentOS

To install Telegraf on RedHat and CentOS systems, follow these steps:

Download the Telegraf RPM package.

wget https://dl.influxdata.com/telegraf/releases/telegraf-1.10.3-1.x86_64.rpm

Install the downloaded package using yum.

sudo yum localinstall telegraf-1.10.3-1.x86_64.rpm

Verify the installation by checking the Telegraf version.

telegraf -version The output should be similar to:lessCopy codeTelegraf 1.10.3 (git: HEAD 294bb666)

Ubuntu & Debian

For Debian-based systems such as Ubuntu, follow these steps:

Download the Telegraf DEB package.

wget https://dl.influxdata.com/telegraf/releases/telegraf_1.10.3-1_amd64.deb

Install the downloaded package using dpkg.

sudo dpkg -i telegraf_1.10.3-1_amd64.deb

OS X (via Homebrew)

For macOS users, Telegraf can be installed using Homebrew:

  1. Update Homebrew. brew update
  2. Install Telegraf. brew install telegraf

Starting the Telegraf Service

After installing Telegraf, you need to start and enable the service.

  1. Start the Telegraf service. sudo systemctl start telegraf
  2. Enable the Telegraf service to start on boot. sudo systemctl enable telegraf

Configuration

Telegraf’s configuration file is located at /etc/telegraf/telegraf.conf. This file defines how Telegraf collects and outputs data.

Basic Configuration

Open the configuration file in your preferred text editor.

sudo nano /etc/telegraf/telegraf.conf

Input Plugins

Enable the CPU input plugin by adding the following configuration:

[[inputs.cpu]]
percpu = true
totalcpu = true
collect_cpu_time = false
report_active = false

Output Plugins

To output data to InfluxDB, configure the output plugin as follows:

[[outputs.influxdb]]
urls = ["http://localhost:8086"]
database = "telegraf"
retention_policy = ""
write_consistency = "any"
timeout = "5s"

Advanced Configuration

Adding Custom Plugins

You can extend Telegraf’s functionality by adding custom plugins. Place your custom plugin scripts in the appropriate directory and reference them in the configuration file.

Using Environment Variables

Telegraf supports environment variables, which can be useful for managing configurations in different environments.

Securing Telegraf

Ensure Telegraf is secure by:

  • Running it with the least privileges necessary.
  • Using HTTPS for data transmission.
  • Regularly updating to the latest version.

Troubleshooting

Common Issues

  • Service not starting: Check the system logs for errors using journalctl -u telegraf.
  • Data not collected: Ensure the input plugins are correctly configured.
  • Data not sent: Verify the output plugin configuration and network connectivity.

Useful Commands

  • Check the configuration: telegraf --config /etc/telegraf/telegraf.conf --test
  • View logs: sudo journalctl -u telegraf

Frequently Asked Questions (FAQs)

What is Telegraf used for?

Telegraf is used for collecting, processing, and writing metrics and events from various sources to various outputs.

Can Telegraf run on Windows?

Yes, Telegraf is cross-platform and can run on Windows, macOS, and Linux.

How do I update Telegraf?

To update Telegraf, simply follow the installation steps again, as the package manager will handle the upgrade process.

Is Telegraf free to use?

Yes, Telegraf is open-source and free to use under the MIT license.

Conclusion

Installing Telegraf on Linux is a straightforward process when you follow the right steps. From basic installation to advanced configuration, this guide has covered everything you need to get started with Telegraf. By leveraging its powerful features, you can efficiently collect and manage metrics for your infrastructure. Whether you’re a beginner or an advanced user, Telegraf offers the flexibility and scalability needed for effective monitoring.

Start your journey with Telegraf today and ensure your system’s performance is always at its peak! Thank you for reading the DevopsRoles page!

Install nslookup on Linux

Introduction

In this tutorial, How to install on Linux. is part of the bind-utils package. The package bind-utils is not yet installed on Linux, then you type command not found on Linux.

To install nslookup on Linux, you need to install the dnsutils package, which contains the nslookup utility. The process for installing the package can vary depending on the Linux distribution you are using. Here are the commands for some popular distributions:

How to Install nslookup on Linux

Install nslookup for Centos

[vagrant@DevopsRoles ~]$ sudo yum install bind-utils

Install nslookup for Ubuntu

Use apt-cache to search the package for nslookup command.

[vagrant@DevopsRoles ~]$ apt-cache search nslookup

The result found 2 packages that are related to nslookup.

dnsutils - Clients provided with BIND
libnet-nslookup-perl - simple DNS lookup module for perl

so install nslookup

[vagrant@DevopsRoles ~]$ sudo apt-get install dnsutils

Once the installation is complete, you can use nslookup from the command line.

[vagrant@DevopsRoles ~]$ nslookup x.x.x.x

Conclusion

In this guide, we have covered how to install and use the nslookup command on Linux, specifically for CentOS and Ubuntu. Whether you’re troubleshooting DNS issues or simply querying domain name records, nslookup is a powerful and essential tool for network administrators and IT professionals.

By following the simple installation steps, you can quickly enable nslookup on your system and start resolving domain names with ease. If you encounter any issues, ensure that your system’s package manager is up to date and that you have the necessary permissions to install packages.

We hope this guide has been helpful! If you have any questions or need further assistance, feel free to leave a comment or check out our other Linux tutorials. Thank you for reading the DevopsRoles page!

Mastering the gunzip command in Linux: A Comprehensive Guide with Examples

Introduction

gunzip command in Linux, compressing and decompressing files are essential skills for users. One of the most popular commands for decompressing files in Linux is gunzip. This command helps decompress files that have been compressed using gzip, a common compression format in Unix-like systems. In this article, we will delve into the details of the gunzip command, how to use it, and provide practical examples that you can apply in your daily tasks.

Syntax

gunzip [ -acfhlLnNrtvV ] [-S suffix] [ name … ]

According to the man page, the gunzip command is used to compress or expand files.

To get more detailed information about the gunzip command, you can use:

man gunzip

gunzip command in Linux with Examples

$ gunzip devopsroles.txt.gz

Keep both the compressed and Decompressed files.

$ gunzip -k devopsroles.txt.gz

Display compressed within it without decompressing first.

$ gunzip -c devopsroles.txt.gz

Test Whether a Compressed File Is Valid before Decompressing it.

$ gunzip -t devopsroles.txt.gz

Show verbose information when you decompress the file.

$ gunzip -v devopsroles.txt.gz

Decompress Multiple Files at Once

gunzip file1.gz file2.gz file3.gz

To decompress a file while keeping the original compressed file, use the -c option and redirect the output:

gunzip -c file.gz > file

Conclusion

The gunzip command is a powerful and easy-to-use tool in Linux for decompressing gzip files. By mastering its options and syntax, you can save time and effort in file management. Hopefully, this article has provided you with a clearer understanding of how to use gunzip command in Linux effectively in your daily tasks. Keep exploring and leveraging the powerful tools of Linux to enhance your work efficiency and system management. Thank you for reading the DevopsRoles page!

Mastering the unzip command in Linux: A Comprehensive Guide with Examples

Introduction

unzip command in Linux means list, test, and extract compressed files in a ZIP archive. In the Linux operating system, compressing and decompressing files are essential skills for users. One of the most popular commands for decompressing ZIP files is unzip. This command not only helps to extract ZIP files but also provides many useful options for effective file management. In this article, we will explore the unzip command in detail, how to use it, and provide practical examples that you can apply in your daily tasks.

unzip syntax

unzip [-Z] [-cflptTuvz[abjnoqsCDKLMUVWX$/:^]] file[.zip] [file(s) …] [-x xfile(s) …] [-d exdir]

According to the man page, the unzip command is used to list, test, and extract compressed files in a ZIP archive.

To get more detailed information about the unzip command, you can use:

man unzip

unzip command in Linux with Examples

$ unzip devopsroles.zip

List all files from a .zip file

[vagrant@DevopsRoles ~]$ ll
 total 4
 -rw-rw-r--. 1 vagrant vagrant 638 Oct  1 06:46 Devops.zip
 [vagrant@DevopsRoles ~]$ unzip -l Devops.zip 
 Archive:  Devops.zip
   Length      Date    Time    Name
 ---------  ---------- -----   ----
         0  10-01-2019 06:45   Devops/
         0  10-01-2019 06:45   Devops/DevopsRoles/
         0  10-01-2019 06:45   Devops/huupv.csv
         0  10-01-2019 06:45   Devops/xxx
 ---------                     -------
         0                     4 files

Test a .zip file validity

[vagrant@DevopsRoles ~]$ unzip -tq Devops.zip 
 No errors detected in compressed data of Devops.zip.

How to extract unzip all files/folders into a certain directory

[vagrant@DevopsRoles ~]$ ll
 total 4
 -rw-rw-r--. 1 vagrant vagrant 638 Oct  1 06:46 Devops.zip
 [vagrant@DevopsRoles ~]$ unzip Devops.zip -d DevopsRoles
 Archive:  Devops.zip
    creating: DevopsRoles/Devops/
    creating: DevopsRoles/Devops/DevopsRoles/
  extracting: DevopsRoles/Devops/huupv.csv  
  extracting: DevopsRoles/Devops/xxx  
 [vagrant@DevopsRoles ~]$ ll
 total 4
 drwxrwxr-x. 3 vagrant vagrant  20 Oct  1 06:51 DevopsRoles
 -rw-rw-r--. 1 vagrant vagrant 638 Oct  1 06:46 Devops.zip

Conclusion

The unzip command is a powerful and flexible tool in Linux for extracting ZIP files. By mastering its options and syntax, you can improve your work efficiency and manage files more effectively. Hopefully, this article has given you a clearer understanding of how to use the unzip command and how to apply it to your daily tasks. Keep exploring and leveraging the powerful tools of Linux to enhance your work efficiency and system management. Thank you for reading the DevopsRoles page!

Mastering the expr command in Linux: A Comprehensive Guide with Examples

Introduction

expr command in Linux means Evaluate expressions. In the Linux operating system, performing arithmetic and string operations is a common requirement, especially when writing shell scripts. The expr command is a versatile and powerful tool that allows users to evaluate expressions, including arithmetic operations, string manipulations, and logical comparisons.

In this article, we will explore the expr command in detail, learn how to use it, and provide practical examples that demonstrate its capabilities in real-world scenarios.

Syntax

expr EXPRESSION
expr OPTION

According to the man page, the expr command in Linux is used to evaluate expressions.

For more detailed information about the expr command, you can use:

man expr

expr command in Linux with Examples

You can combine multiple expressions using logical operators:

expr \( 5 + 3 \) \* 2
# Output: 16

Less Than Comparison

expr 3 \< 5
# Output: 1 (true)

Greater Than Comparison

expr 5 \> 3
# Output: 1 (true)

Not Equal Comparison

expr 5 != 3
# Output: 1 (true)

Equal Comparison

expr 5 = 5
# Output: 1 (true)

Conclusion

The expr command is a powerful and versatile tool in Linux, essential for performing arithmetic operations, string manipulations, and logical comparisons in shell scripts. By mastering the expr command, you can enhance your scripting capabilities and manage tasks more efficiently.

This article has provided an overview of the expr command, its syntax, and practical examples to help you apply it in real-world scenarios. Keep exploring and utilizing the expr command to improve your Linux command-line skills and script automation.

expr command is a simple command in Linux. It is the most popular in-use terminal Linux evaluation expression. Thank you for reading the DevopsRoles page!

Mastering the touch command in Linux: A Comprehensive Guide with Examples

Introduction

touch command means Change file timestamps. The touch command in Linux is used to create empty files or update the timestamp of existing files.

In the Linux operating system, the ability to create and manipulate files is essential for effective file management and scripting. One of the most fundamental commands for this purpose is the touch command.

The touch command is primarily used to create new empty files and update file timestamps. In this article, we will explore the touch command in detail, learn how to use it, and provide practical examples that demonstrate its capabilities in real-world scenarios.

Syntax

touch [OPTION]… FILE…

According to the man page, the touch command is used to change file timestamps.

For more detailed information about the touch command examples, you can use:

man touch

touch command in Linux with Examples

Create a new file:

$ touch devopsroles.txt

Create multiple files at once:

touch file1.txt file2.txt file3.txt

Set a specific timestamp:

touch -t 202306151200.00 filename.txt

Create a new file with specific permissions:

touch -m 644 filename.txt

Update the timestamp of a file

touch filename.txt

To set the timestamp of a file based on the timestamp of another file, use the -r option followed by the reference file:

touch -r referencefile.txt targetfile.txt

To create a file only if it does not already exist (and do nothing if it does), use the -c option:

touch -c existingfile.txt

Conclusion

touch command in Linux is a simple command in Linux. It is the most popular in-use terminal Linux change file timestamps.

The touch command is a versatile and essential tool in Linux for creating files and modifying timestamps. By mastering its options and syntax, you can enhance your file management skills and streamline your shell scripting tasks. Hopefully, this article has provided you with a clearer understanding of how to use the touch command effectively and apply it in your daily activities.

Keep exploring and leveraging the powerful commands in Linux to improve your efficiency and productivity in managing systems and automating tasks. Thank you for reading the DevopsRoles page!

join command in Linux with Examples

Introduction

join command in Linux means Join lines of two files on a common field. In the Linux operating system, processing and merging text files are common tasks that are essential for effective data management and manipulation.

The join command is a powerful tool that allows users to combine lines of two files based on a common field. This command is particularly useful for merging data sets and performing relational database-like operations on text files. In this article, we will explore the join command in detail, learn how to use it, and provide practical examples that demonstrate its capabilities in real-world scenarios.

Syntax join command in Linux

join [OPTION]… FILE1 FILE2

According to the man page, the join command merges lines of two files based on a common field. For more detailed information about the join command, you can use:

man join

join command in Linux with Examples

To join two files on the first field by default, use:

$ join huuphan.txt devopsroles.txt

To join files on a specific field, use the -1 and -2 options to specify the field numbers in the first and second files, respectively:

join -1 2 -2 3 file1.txt file2.txt

To include lines from both files that do not have a matching join field, use the -a option:

join -a 1 -a 2 file1.txt file2.txt

To change the output field separator, use the -t option:

join -t ',' file1.csv file2.csv

To suppress the output of unpaired fields, use the -o option:

join -o 1.1 1.2 2.3 file1.txt file2.txt

To perform a case-insensitive join, use the -i option:

join -i file1.txt file2.txt

Basic Usage of join Command

Let’s start with the basics of the join command. Consider two files, file1.txt and file2.txt.

Example Files:

file1.txt

1 Apple
2 Banana
3 Cherry

file2.txt

1 Red
2 Yellow
3 Red

Basic Command:

To join these files based on the first field:

join file1.txt file2.txt

Output:

1 Apple Red
2 Banana Yellow
3 Cherry Red

Options and Their Usage

Specifying a Different Field

By default, join uses the first field for matching. To specify a different field, use the -1 and -2 options.

join -1 1 -2 1 file1.txt file2.txt

Including Unpaired Lines

To include lines that do not have a matching pair, use the -a option.

join -a 1 -a 2 file1.txt file2.txt

Specifying Delimiters

If the fields in the files are separated by a delimiter other than a space, use the -t option.

join -t ',' file1.csv file2.csv

Advanced Usage of join Command

Combining Files with Multiple Fields

Consider two files with multiple fields:

file1.txt

1 Apple 5
2 Banana 10
3 Cherry 7

file2.txt

1 Red
2 Yellow
3 Red

To join based on the first field and include multiple fields from the first file:

join -1 1 -2 1 file1.txt file2.txt

Output with Multiple Fields:

1 Apple 5 Red
2 Banana 10 Yellow
3 Cherry 7 Red

Ignoring Case Differences

To perform a case-insensitive join, use the -i option.

join -i file1.txt file2.txt

Customizing Output Format

To customize the output format, use the -o option followed by the field specifiers.

join -o 1.1,1.2,2.2 file1.txt file2.txt

Handling Missing Fields

To handle missing fields gracefully, use the -e option to provide a default value.

join -e 'N/A' file1.txt file2.txt

Common Errors and Troubleshooting

Mismatched Delimiters

Ensure that the delimiters in both files match when using the -t option. Mismatched delimiters can cause unexpected results.

Non-Sorted Files

The join command requires input files to be sorted based on the join field. Use the sort command to sort the files beforehand.

sort file1.txt -o file1.txt
sort file2.txt -o file2.txt
join file1.txt file2.txt

Different Number of Fields

Ensure that both files have the same number of fields if you are using the -o option to specify output format.

Frequently Asked Questions (FAQs)

What is the join the command used for in Linux?

The join command is used to merge lines from two files based on a common field, typically for data processing and analysis tasks.

How do I join files with a different delimiter?

Use the -t option followed by the delimiter character to specify a different delimiter.

Can I join files on fields other than the first field?

Yes, use the -1 and -2 options to specify the fields in the first and second files, respectively.

How do I include unmatched lines in the output?

Use the -a option to include unmatched lines from either or both files.

How do I handle case differences in the join field?

Use the -i option to perform a case-insensitive join.

Conclusion

join command is a simple command in Linux.The join command is a versatile and powerful tool in Linux for merging lines of text files based on a common field. By mastering its options and syntax, you can enhance your data processing skills and streamline your file management tasks.

Hopefully, this article has provided you with a clearer understanding of how to use the join command examples effectively and apply them in your daily activities. Keep exploring and leveraging the powerful commands in Linux to improve your efficiency and productivity in managing data and automating tasks. Thank you for reading the DevopsRoles page!

Refer to:

Mastering the ps command in Linux: A Comprehensive Guide with Examples

Introduction

ps command in Linux means ps displays information about a selection of the active processes. In the Linux operating system, managing and monitoring processes is a crucial task for system administrators and users alike. The ps command is an essential tool for viewing the currently running processes on a system.

It provides detailed information about each process, including its process ID (PID), the user who owns the process, and the resources it is consuming. In this article, we will explore the ps command in detail, learn how to use it effectively and provide practical examples to demonstrate its capabilities in real-world scenarios.

Syntax

ps [options]

According to the man page, the ps the command provides a snapshot of the current processes.

For more detailed information about the ps command, you can use:

man ps

ps command in Linux with Examples

$ ps

Display User Running Processes

[vagrant@DevopsRoles ~]$ ps -X
#To display a user’s processes by real user ID (RUID) 
[vagrant@DevopsRoles ~]$ ps -fU vagrant

Display Group Processes

[vagrant@DevopsRoles ~]$ ps -fG vagrant

print a process tree for a given process

[vagrant@DevopsRoles ~]$ ps -ef --forest | grep -v grep | grep sshd 
 root      2414     1  0 06:38 ?        00:00:00 /usr/sbin/sshd -D -u0
 root      4087  2414  0 06:39 ?        00:00:00  _ sshd: vagrant [priv]
 vagrant   4090  4087  0 06:39 ?        00:00:00      _ sshd: vagrant@pts/0

Print Process Threads

[vagrant@DevopsRoles ~]$ ps -fL -C sshd
 UID        PID  PPID   LWP  C NLWP STIME TTY          TIME CMD
 root      2414     1  2414  0    1 06:38 ?        00:00:00 /usr/sbin/sshd -D -u0
 root      4087  2414  4087  0    1 06:39 ?        00:00:00 sshd: vagrant [priv]
 vagrant   4090  4087  4090  0    1 06:39 ?        00:00:00 sshd: vagrant@pts/0
 root      4730  2414  4730  3    1 07:17 ?        00:00:00 sshd: vagrant [priv]
 vagrant   4733  4730  4733  0    1 07:17 ?        00:00:00 sshd: vagrant@pts/1

To view the PID, PPID, user name, and command of a process.

[vagrant@DevopsRoles ~]$ ps -eo pid,ppid,user,cmd | grep vagrant
  4087  2414 root     sshd: vagrant [priv]
  4090  4087 vagrant  sshd: vagrant@pts/0
  4091  4090 vagrant  -bash
  4730  2414 root     sshd: vagrant [priv]
  4733  4730 vagrant  sshd: vagrant@pts/1
  4734  4733 vagrant  -bash
  4770  4091 vagrant  ps -eo pid,ppid,user,cmd
  4771  4091 vagrant  grep --color=auto vagrant

Find the top running processes by highest memory and CPU usage in Linux.

[vagrant@DevopsRoles ~]$ ps -eo pid,ppid,cmd,%mem,%cpu --sort=-%mem | head
   PID  PPID CMD                         %MEM %CPU
  2413     1 /usr/bin/python2 -Es /usr/s  3.4  0.0
  1666     1 /usr/sbin/NetworkManager --  1.7  0.0
  1502     1 /usr/lib/polkit-1/polkitd -  1.6  0.0
     1     0 /usr/lib/systemd/systemd --  1.2  0.0
  4730  2414 sshd: vagrant [priv]         1.1  0.0
  4087  2414 sshd: vagrant [priv]         1.1  0.0
  2359  1666 /sbin/dhclient -d -q -sf /u  1.0  0.0
  1076     1 /usr/lib/systemd/systemd-ud  0.9  0.0
  2418     1 /usr/sbin/rsyslogd -n        0.9  0.0
 [vagrant@DevopsRoles ~]$ ps -eo pid,ppid,cmd,%mem,%cpu --sort=-%cpu | head
   PID  PPID CMD                         %MEM %CPU
     1     0 /usr/lib/systemd/systemd --  1.2  0.0
     2     0 [kthreadd]                   0.0  0.0
     3     2 [ksoftirqd/0]                0.0  0.0
     5     2 [kworker/0:0H]               0.0  0.0
     6     2 [kworker/u2:0]               0.0  0.0
     7     2 [migration/0]                0.0  0.0
     8     2 [rcu_bh]                     0.0  0.0
     9     2 [rcu_sched]                  0.0  0.0
    10     2 [lru-add-drain]              0.0  0.0

Conclusion

ps command in Linux is a simple command in Linux. The ps command is a powerful and versatile tool in Linux for monitoring and managing system processes. By mastering its options and syntax, you can gain valuable insights into the processes running on your system, diagnose issues, and optimize performance.

Hopefully, this article has provided you with a clearer understanding of how to use the ps command effectively and apply it in your daily tasks. Keep exploring and leveraging the powerful commands in Linux to enhance your efficiency and productivity in system administration and process management. Thank you for reading the DevopsRoles page!