For years, Kubernetes Platform Engineers and SREs have operated under a rigid constraint: the Device Plugin API. While it served the initial wave of containerization well, its integer-based resource counting (e.g., nvidia.com/gpu: 1) is fundamentally insufficient for modern, high-performance AI/ML workloads. It lacks the nuance to handle topology awareness, arbitrary constraints, or flexible device sharing at the scheduler level.
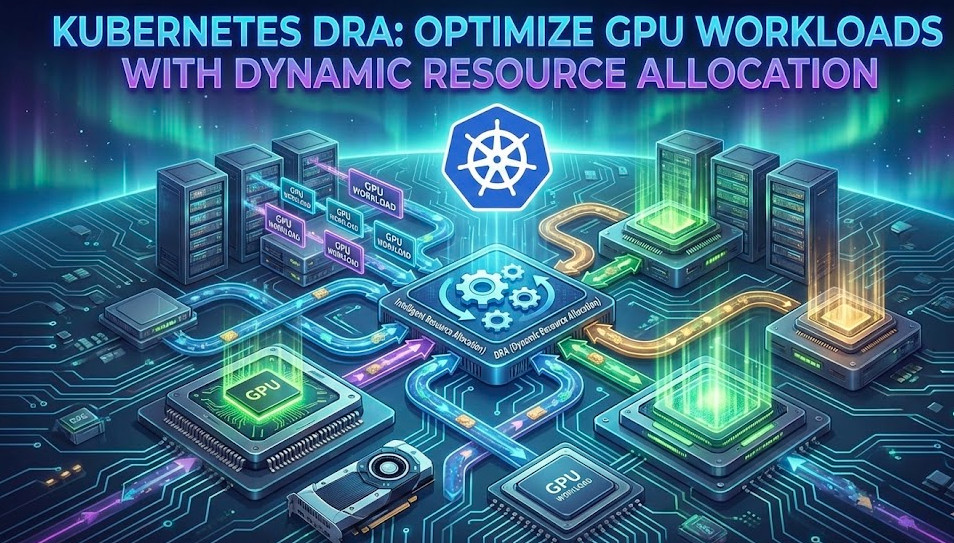
Enter Kubernetes DRA (Dynamic Resource Allocation). This is not just a patch; it is a paradigm shift in how Kubernetes requests and manages hardware accelerators. By moving resource allocation logic out of the Kubelet and into the control plane (via the Scheduler and Resource Drivers), DRA allows for complex claim lifecycles, structured parameters, and significantly improved cluster utilization.
The Latency of Legacy: Why Device Plugins Are Insufficient
To understand the value of Kubernetes DRA, we must first acknowledge the limitations of the standard Device Plugin framework. In the “classic” model, the Scheduler is essentially blind. It sees nodes as bags of counters (Capacity/Allocatable). It does not know which specific GPU it is assigning, nor its topology (PCIe switch locality, NVLink capabilities) relative to other requested devices.
Pro-Tip: In the classic model, the actual device assignment happens at the Kubelet level, long after scheduling. If a Pod lands on a node that has free GPUs but lacks the specific topology required for efficient distributed training, you incur a silent performance penalty or a runtime failure.
The Core Limitations
- Opaque Integers: You cannot request “A GPU with 24GB VRAM.” You can only request “1 Unit” of a device, requiring complex node labeling schemes to separate hardware tiers.
- Late Binding: Allocation happens at container creation time (StartContainer), making it impossible for the scheduler to make globally optimal decisions based on device attributes.
- No Cross-Pod Sharing: Device Plugins generally assume exclusive access or rigid time-slicing, lacking native API support for dynamic sharing of a specific device instance across Pods.
Architectural Deep Dive: How Kubernetes DRA Works
Kubernetes DRA decouples the resource definition from the Pod spec. It introduces a new API group, resource.k8s.io, and a set of Custom Resource Definitions (CRDs) that treat hardware requests similarly to Persistent Volume Claims (PVCs).
1. The Shift to Control Plane Allocation
Unlike Device Plugins, DRA involves the Scheduler directly. When utilizing the new Structured Parameters model (promoted in K8s 1.30+), the scheduler can make decisions based on the actual attributes of the devices without needing to call out to an external driver for every Pod decision, dramatically reducing scheduling latency compared to early alpha DRA implementations.
2. Core API Objects
If you are familiar with PVCs and StorageClasses, the DRA mental model will feel intuitive.
| API Object | Role | Analogy |
|---|---|---|
ResourceClass |
Defines the driver and common parameters for a type of hardware. | StorageClass |
ResourceClaim |
A request for a specific device instance satisfying certain constraints. | PVC (Persistent Volume Claim) |
ResourceSlice |
Published by the driver; advertises available resources and their attributes to the cluster. | PV (but dynamic and granular) |
DeviceClass |
(New in Structured Parameters) Defines a set of configuration presets or hardware selectors. | Hardware Profile |
Implementing DRA: A Practical Workflow
Let’s look at how to implement Kubernetes DRA for a GPU workload. We assume a cluster running Kubernetes 1.30+ with the DynamicResourceAllocation feature gate enabled.
Step 1: The ResourceClass
First, the administrator defines a class that points to the specific DRA driver (e.g., the NVIDIA DRA driver).
apiVersion: resource.k8s.io/v1alpha2
kind: ResourceClass
metadata:
  name: nvidia-gpu
driverName: dra.nvidia.com
structuredParameters: true  # Enabling the high-performance scheduler path
Step 2: The ResourceClaimTemplate
Instead of embedding requests in the Pod spec, we create a template. This allows the Pod to generate a unique ResourceClaim upon creation. Notice how we can now specify arbitrary selectors, not just counts.
apiVersion: resource.k8s.io/v1alpha2
kind: ResourceClaimTemplate
metadata:
  name: gpu-claim-template
spec:
  metadata:
    labels:
      app: deep-learning
  spec:
    resourceClassName: nvidia-gpu
    parametersRef:
      kind: GpuConfig
      name: v100-high-mem
      apiGroup: dra.nvidia.com
Step 3: The Pod Specification
The Pod references the claim template. The Kubelet ensures the container is not started until the claim is “Allocated” and “Reserved.”
apiVersion: v1
kind: Pod
metadata:
  name: model-training-pod
spec:
  containers:
  - name: trainer
    image: nvidia/cuda:12.0-base
    command: ["/bin/sh", "-c", "nvidia-smi; sleep 3600"]
    resources:
      claims:
      - name: gpu-access
  resourceClaims:
  - name: gpu-access
    source:
      resourceClaimTemplateName: gpu-claim-template
Advanced Concept: Unlike PVCs,
ResourceClaimshave aallocationMode. Setting this toWaitForFirstConsumer(similar to storage) ensures that the GPU is not locked to a node until the Pod is actually scheduled, preventing resource fragmentation.
Structured Parameters: The “Game Changer” for Scheduler Performance
Early iterations of DRA had a major flaw: the Scheduler had to communicate with a sidecar controller via gRPC for every pod to check if a claim could be satisfied. This was too slow for large clusters.
Structured Parameters (introduced in KEP-3063) solves this.
- How it works: The Driver publishes
ResourceSliceobjects containing the device inventory and opaque parameters. However, the constraints are defined in a standardized format that the Scheduler understands natively. - The Result: The generic Kubernetes Scheduler can calculate which node satisfies a
ResourceClaimentirely in-memory, without network round-trips to external drivers. It only calls the driver for the final “Allocation” confirmation.
Best Practices for Production DRA
As you migrate from Device Plugins to DRA, keep these architectural constraints in mind:
- Namespace Isolation: Unlike device plugins which are node-global,
ResourceClaimsare namespaced. This provides better multi-tenancy security but requires stricter RBAC management for theresource.k8s.ioAPI group. - CDI Integration: DRA relies heavily on the Container Device Interface (CDI) for the actual injection of device nodes into containers. Ensure your container runtime (containerd/CRI-O) is updated to a version that supports CDI injection fully.
- Monitoring: The old metric
kubelet_device_plugin_allocationswill no longer tell the full story. You must monitor `ResourceClaim` statuses. A claim stuck inPendingoften indicates that no `ResourceSlice` satisfies the topology constraints.
Frequently Asked Questions (FAQ)
Is Kubernetes DRA ready for production?
As of Kubernetes 1.30, DRA is in Beta. While the API is stabilizing, the ecosystem of drivers (Intel, NVIDIA, AMD) is still maturing. For critical, high-uptime production clusters, a hybrid approach is recommended: keep critical workloads on Device Plugins and experiment with DRA for batch AI jobs.
Can I use DRA and Device Plugins simultaneously?
Yes. You can run the NVIDIA Device Plugin and the NVIDIA DRA Driver on the same node. However, you must ensure they do not manage the same physical devices to avoid conflicts. Typically, this is done by using node labels to segregate “Legacy Nodes” from “DRA Nodes.”
Does DRA support GPU sharing (MIG/Time-Slicing)?
Yes, and arguably better than before. DRA allows drivers to expose “Shared” claims where multiple Pods reference the same `ResourceClaim` object, or where the driver creates multiple slices representing fractions of a physical GPU (e.g., MIG instances) with distinct attributes.

Conclusion
Kubernetes DRA represents the maturation of Kubernetes as a platform for high-performance computing. By treating devices as first-class schedulable resources rather than opaque counters, we unlock the ability to manage complex topologies, improve cluster density, and standardize how we consume hardware.
While the migration requires learning new API objects like ResourceClaim and ResourceSlice, the control it offers over GPU workloads makes it an essential upgrade for any serious AI/ML platform team. Thank you for reading the DevopsRoles page!