Tag Archives: Kubernetes

Kubernetes Cost Monitoring: Mastering Cost Efficiency in Kubernetes Clusters

Introduction

Kubernetes has revolutionized the way organizations deploy and manage containerized applications. However, as powerful as Kubernetes is, it comes with its own set of challenges, particularly in cost management. For organizations running large-scale Kubernetes clusters, the costs can spiral out of control without proper monitoring and optimization.

This guide explores the intricacies of Kubernetes cost monitoring, equipping you with tools, techniques, and best practices to maintain budget control while leveraging Kubernetes’ full potential.

Why Kubernetes Cost Monitoring Matters

Efficient Kubernetes cost monitoring ensures that your cloud expenses align with your organization’s budget. Without visibility into usage and spending, businesses risk:

  • Overspending on underutilized resources.
  • Misallocation of budget across teams or projects.
  • Inefficiencies due to unoptimized workloads.

Effective cost monitoring empowers businesses to:

  • Reduce unnecessary expenses.
  • Allocate resources more efficiently.
  • Enhance transparency and accountability in cloud spending.

Key Concepts in Kubernetes Cost Monitoring

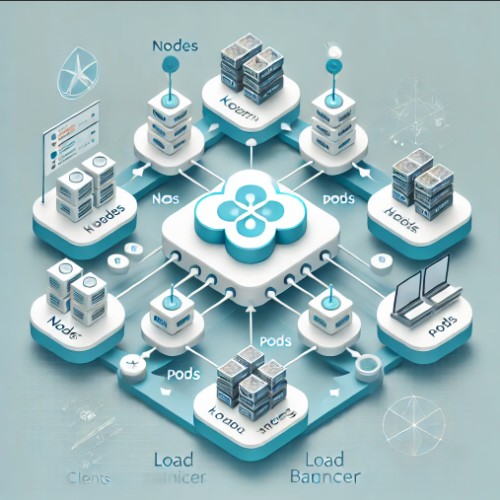
Kubernetes Cluster Resources

To understand costs in Kubernetes, it’s essential to grasp the core components that drive expenses:

  1. Compute Resources: CPU and memory allocated to pods and nodes.
  2. Storage: Persistent volumes and ephemeral storage.
  3. Networking: Data transfer costs between services or external endpoints.

Cost Drivers in Kubernetes

Key factors influencing Kubernetes costs include:

  • Cluster Size: Number of nodes and their specifications.
  • Workload Characteristics: Resource demands of running applications.
  • Cloud Provider Pricing: Variations in pricing for compute, storage, and networking.

Tools for Kubernetes Cost Monitoring

Several tools simplify cost monitoring in Kubernetes clusters. Here are the most popular ones:

1. Kubecost

Kubecost provides real-time cost visibility and insights for Kubernetes environments. Key features include:

  • Cost allocation for namespaces, deployments, and pods.
  • Integration with cloud billing APIs for accurate tracking.
  • Alerts for budget thresholds.

2. Cloud Provider Native Tools

Most cloud providers offer native tools for cost monitoring:

  • AWS Cost Explorer: Helps analyze AWS Kubernetes (EKS) costs.
  • Google Cloud Billing Reports: Monitors GKE costs.
  • Azure Cost Management: Tracks AKS expenses.

3. OpenCost

OpenCost is an open-source project designed to provide detailed cost tracking in Kubernetes environments. Features include:

  • Support for multi-cluster monitoring.
  • Open-source community contributions.
  • Transparent cost allocation algorithms.

4. Prometheus and Grafana

While not dedicated cost monitoring tools, Prometheus and Grafana can be configured to visualize cost metrics when integrated with custom exporters or billing data.

Implementing Kubernetes Cost Monitoring

Step 1: Understand Your Resource Usage

  • Use tools like kubectl top to monitor real-time CPU and memory usage.
  • Analyze historical usage data with Prometheus.

Step 2: Set Up Cost Monitoring Tools

  1. Deploy Kubecost:
    • Install Kubecost using Helm:
      • helm repo add kubecost https://kubecost.github.io/cost-analyzer/
      • helm install kubecost kubecost/cost-analyzer -n kubecost --create-namespace
    • Access the Kubecost dashboard for real-time insights.
  2. Integrate Cloud Billing APIs:
    • Link your Kubernetes monitoring tools with cloud provider APIs for accurate cost tracking.

Step 3: Optimize Resource Usage

  • Right-size your pods using Vertical Pod Autoscaler (VPA).
  • Implement Horizontal Pod Autoscaler (HPA) for dynamic scaling.
  • Leverage spot instances or preemptible VMs for cost savings.

Advanced Kubernetes Cost Monitoring Strategies

Granular Cost Allocation

  • Tag resources by team or project for detailed billing.
  • Use annotations in Kubernetes manifests to assign cost ownership:
metadata:
  annotations:
    cost-center: "team-A"

Multi-Cluster Cost Analysis

For organizations running multiple clusters:

  • Aggregate data from all clusters into a centralized monitoring tool.
  • Use OpenCost for open-source multi-cluster support.

Predictive Cost Management

  • Implement machine learning models to predict future costs based on historical data.
  • Automate scaling policies to prevent over-provisioning.

Frequently Asked Questions

1. What is Kubernetes cost monitoring?

Kubernetes cost monitoring involves tracking and optimizing expenses associated with running Kubernetes clusters, including compute, storage, and networking resources.

2. Which tools are best for Kubernetes cost monitoring?

Popular tools include Kubecost, OpenCost, AWS Cost Explorer, Google Cloud Billing Reports, and Prometheus.

3. How can I reduce Kubernetes costs?

Optimize costs by right-sizing pods, using autoscaling features, leveraging spot instances, and monitoring usage regularly.

4. Can I monitor costs for multiple clusters?

Yes, tools like OpenCost and cloud-native solutions support multi-cluster cost analysis.

5. Is cost monitoring available for on-premises Kubernetes clusters?

Yes, tools like Kubecost and Prometheus can be configured for on-premises environments.

External Links

Conclusion

Kubernetes cost monitoring is essential for maintaining financial control and optimizing resource usage. By leveraging tools like Kubecost and OpenCost and implementing best practices such as granular cost allocation and predictive analysis, businesses can achieve efficient and cost-effective Kubernetes operations. Stay proactive in monitoring, and your Kubernetes clusters will deliver unparalleled value without overshooting your budget.Thank you for reading the DevopsRoles page!

Kubernetes HPA: A Comprehensive Guide to Horizontal Pod Autoscaling

Introduction

Kubernetes Horizontal Pod Autoscaler (HPA) is a powerful feature designed to dynamically scale the number of pods in a deployment or replication controller based on observed CPU, memory usage, or other custom metrics. By automating the scaling process, Kubernetes HPA ensures optimal resource utilization and application performance, making it a crucial tool for managing workloads in production environments.

In this guide, we’ll explore how Kubernetes HPA works, its configuration, and how you can leverage it to optimize your applications. Let’s dive into the details of Kubernetes HPA with examples, best practices, and frequently asked questions.

What is Kubernetes HPA?

The Kubernetes Horizontal Pod Autoscaler (HPA) adjusts the number of pods in a replication controller, deployment, or replica set based on metrics such as:

  • CPU Utilization: Scale up/down based on average CPU consumption.
  • Memory Utilization: Adjust pod count based on memory usage.
  • Custom Metrics: Leverage application-specific metrics through integrations.

HPA continuously monitors your workload’s resource consumption, ensuring that your application scales efficiently under varying loads.

How Does Kubernetes HPA Work?

HPA Components

Kubernetes HPA relies on the following components:

  1. Metrics Server: A lightweight aggregator that collects resource metrics (e.g., CPU, memory) from the kubelet on each node.
  2. Controller Manager: Houses the HPA controller, which evaluates scaling requirements based on specified metrics.
  3. Custom Metrics Adapter: Enables the use of custom application metrics for scaling.

Key Features

  • Dynamic Scaling: Automatic adjustment of pods based on defined thresholds.
  • Resource Optimization: Ensures efficient resource allocation by scaling workloads.
  • Extensibility: Supports custom metrics for complex scaling logic.

Setting Up Kubernetes HPA

Prerequisites

  1. A running Kubernetes cluster (v1.18 or later recommended).
  2. The Metrics Server installed and operational.
  3. Resource requests and limits defined for your workloads.

Step-by-Step Guide

Step 1: Verify Metrics Server

Ensure that the Metrics Server is deployed:

kubectl get deployment metrics-server -n kube-system

If it’s not present, install it using:

kubectl apply -f https://github.com/kubernetes-sigs/metrics-server/releases/latest/download/components.yaml

Step 2: Define Resource Requests and Limits

HPA relies on resource requests to calculate scaling. Define these in your deployment manifest:

resources:
  requests:
    cpu: 100m
    memory: 128Mi
  limits:
    cpu: 200m
    memory: 256Mi

Step 3: Create an HPA Object

Use the kubectl autoscale command or a YAML manifest. For example, to scale based on CPU utilization:

kubectl autoscale deployment my-app --cpu-percent=50 --min=2 --max=10

Or define it in a YAML file:

apiVersion: autoscaling/v2
kind: HorizontalPodAutoscaler
metadata:
  name: my-app-hpa
spec:
  scaleTargetRef:
    apiVersion: apps/v1
    kind: Deployment
    name: my-app
  minReplicas: 2
  maxReplicas: 10
  metrics:
    - type: Resource
      resource:
        name: cpu
        target:
          type: Utilization
          averageUtilization: 50

Apply the configuration:

kubectl apply -f hpa.yaml

Advanced Scenarios

Scaling Based on Memory Usage

Modify the metrics section to target memory utilization:

metrics:
  - type: Resource
    resource:
      name: memory
      target:
        type: Utilization
        averageUtilization: 70

Using Custom Metrics

Integrate Prometheus or a similar monitoring tool for custom metrics:

1.Install Prometheus Adapter:

helm install prometheus-adapter prometheus-community/prometheus-adapter

2.Update the HPA configuration to include custom metrics:

metrics:
  - type: Pods
    pods:
      metricName: http_requests_per_second
      target:
        type: AverageValue
        averageValue: "100"

Scaling Multiple Metrics

Combine CPU and custom metrics for robust scaling:

metrics:
  - type: Resource
    resource:
      name: cpu
      target:
        type: Utilization
        averageUtilization: 60
  - type: Pods
    pods:
      metricName: custom_metric
      target:
        type: AverageValue
        averageValue: "200"

Best Practices for Kubernetes HPA

  1. Define Accurate Resource Requests: Ensure pods have well-calibrated resource requests and limits for optimal scaling.
  2. Monitor Metrics Regularly: Use tools like Prometheus and Grafana for real-time insights.
  3. Avoid Over-Scaling: Set realistic minimum and maximum replica counts.
  4. Test Configurations: Validate HPA behavior under different loads in staging environments.
  5. Use Multiple Metrics: Combine resource and custom metrics for robust scaling logic.

FAQs

What is the minimum Kubernetes version required for HPA v2?

HPA v2 requires Kubernetes v1.12 or later, with enhancements available in newer versions.

How often does the HPA controller evaluate metrics?

By default, the HPA controller evaluates metrics and scales pods every 15 seconds.

Can HPA work without the Metrics Server?

No, the Metrics Server is a prerequisite for resource-based autoscaling. For custom metrics, you’ll need additional tools like Prometheus Adapter.

What happens if resource limits are not defined?

HPA won’t function properly without resource requests, as it relies on these metrics to calculate scaling thresholds.

External Resources

  1. Kubernetes Official Documentation on HPA
  2. Metrics Server Installation Guide
  3. Prometheus Adapter for Kubernetes

Conclusion

Kubernetes HPA is a game-changer for managing dynamic workloads, ensuring optimal resource utilization, and maintaining application performance. By mastering its configuration and leveraging advanced features like custom metrics, you can scale your applications efficiently to meet the demands of modern cloud environments.

Implement the practices and examples shared in this guide to unlock the full potential of Kubernetes HPA and keep your cluster performing at its peak. Thank you for reading the DevopsRoles page!

Kubernetes Autoscaling: A Comprehensive Guide

Introduction

Kubernetes autoscaling is a powerful feature that optimizes resource utilization and ensures application performance under varying workloads. By dynamically adjusting the number of pods or the resource allocation, Kubernetes autoscaling helps maintain seamless operations and cost efficiency in cloud environments.

This guide delves into the mechanisms, configurations, and best practices for Kubernetes autoscaling, equipping you with the knowledge to harness its full potential.

What is Kubernetes Autoscaling?

Kubernetes autoscaling refers to the capability of Kubernetes to automatically adjust the scale of resources to meet application demand. The main types of autoscaling in Kubernetes include:

  • Horizontal Pod Autoscaler (HPA): Adjusts the number of pods in a deployment or replica set based on CPU, memory, or custom metrics.
  • Vertical Pod Autoscaler (VPA): Modifies the CPU and memory requests/limits for pods to optimize their performance.
  • Cluster Autoscaler: Scales the number of nodes in a cluster based on pending pods and resource needs.

Why is Kubernetes Autoscaling Important?

  • Cost Efficiency: Avoid over-provisioning by scaling resources only when necessary.
  • Performance Optimization: Meet application demands during traffic spikes or resource constraints.
  • Operational Simplicity: Automate resource adjustments without manual intervention.

Types of Kubernetes Autoscaling

Horizontal Pod Autoscaler (HPA)

The HPA adjusts the number of pods in a deployment, replica set, or stateful set based on observed metrics. Common use cases include scaling web servers during traffic surges or batch processing workloads.

Key Features:

  • Metrics-based scaling (e.g., CPU, memory, or custom metrics via the Metrics Server).
  • Configurable thresholds to define scaling triggers.

How to Configure HPA:

  1. Install Metrics Server: Ensure that Metrics Server is running in your cluster.
  2. Define an HPA Resource: Create an HPA resource using kubectl or YAML files.
  3. Apply Configuration: Deploy the HPA configuration to the cluster.

Example: YAML configuration for HPA:

apiVersion: autoscaling/v2
kind: HorizontalPodAutoscaler
metadata:
  name: my-app-hpa
spec:
  scaleTargetRef:
    apiVersion: apps/v1
    kind: Deployment
    name: my-app
  minReplicas: 2
  maxReplicas: 10
  metrics:
  - type: Resource
    resource:
      name: cpu
      target:
        type: Utilization
        averageUtilization: 50

Vertical Pod Autoscaler (VPA)

The VPA adjusts the resource requests and limits for pods to ensure optimal performance under changing workloads.

Key Features:

  • Automatic adjustments for CPU and memory.
  • Three update modes: Off, Initial, and Auto.

How to Configure VPA:

  1. Install VPA Components: Deploy the VPA controller to your cluster.
  2. Define a VPA Resource: Specify the VPA configuration using YAML.
  3. Apply Configuration: Deploy the VPA resource to the cluster.

Example: YAML configuration for VPA:

apiVersion: autoscaling.k8s.io/v1
kind: VerticalPodAutoscaler
metadata:
  name: my-app-vpa
spec:
  targetRef:
    apiVersion: apps/v1
    kind: Deployment
    name: my-app
  updatePolicy:
    updateMode: "Auto"

Cluster Autoscaler

The Cluster Autoscaler scales the number of nodes in a cluster to accommodate pending pods or free up unused nodes.

Key Features:

  • Works with major cloud providers like AWS, GCP, and Azure.
  • Automatically removes underutilized nodes to save costs.

How to Configure Cluster Autoscaler:

  1. Install Cluster Autoscaler: Deploy the Cluster Autoscaler to your cloud provider’s Kubernetes cluster.
  2. Set Node Group Parameters: Configure min/max node counts and scaling policies.
  3. Monitor Scaling Events: Use logs and metrics to track scaling behavior.

Examples of Kubernetes Autoscaling in Action

Example 1: Scaling a Web Application with HPA

Imagine a scenario where your web application experiences sudden traffic spikes during promotional events. By using HPA, you can ensure that additional pods are deployed to handle the increased load.

  1. Deploy the application:
    • kubectl apply -f web-app-deployment.yaml
  2. Configure HPA:
    • kubectl autoscale deployment web-app --cpu-percent=60 --min=2 --max=10
  3. Verify scaling:
    • kubectl get hpa

Example 2: Optimizing Resource Usage with VPA

For resource-intensive applications like machine learning models, VPA can adjust resource allocations based on usage patterns.

  1. Deploy the application:
    • kubectl apply -f ml-app-deployment.yaml
  2. Configure VPA:
    • kubectl apply -f ml-app-vpa.yaml
  3. Monitor scaling events:
    • kubectl describe vpa ml-app

Example 3: Adjusting Node Count with Cluster Autoscaler

For clusters running on GCP:

  1. Enable autoscaling:
    • gcloud container clusters update my-cluster --enable-autoscaling --min-nodes=1 --max-nodes=10
  2. Deploy workload:
    • kubectl apply -f batch-job.yaml
  3. Monitor node scaling:
    • kubectl get nodes

Frequently Asked Questions

1. What metrics can be used with HPA?

HPA supports CPU, memory, and custom application metrics (e.g., request latency).

2. How does VPA handle resource conflicts?

VPA ensures resource allocation is optimized but does not override user-defined limits.

3. Is Cluster Autoscaler available for on-premise clusters?

Cluster Autoscaler primarily supports cloud-based environments but can work with custom on-prem setups.

4. Can HPA and VPA be used together?

Yes, HPA and VPA can work together, but careful configuration is required to avoid conflicts.

5. What tools are needed to monitor autoscaling?

Popular tools include Prometheus, Grafana, and Kubernetes Dashboard.

External Resources

Conclusion

Kubernetes autoscaling is a vital feature for maintaining application performance and cost efficiency. By leveraging HPA, VPA, and Cluster Autoscaler, you can dynamically adjust resources to meet workload demands. Implementing these tools with best practices ensures your applications run seamlessly in any environment. Start exploring Kubernetes autoscaling today to unlock its full potential! Thank you for reading the DevopsRoles page!

Kubernetes Load Balancing: A Comprehensive Guide

Introduction

Kubernetes has revolutionized the way modern applications are deployed and managed. Among its many features, Kubernetes load balancing stands out as a critical mechanism for ensuring that application traffic is efficiently distributed across containers, enhancing scalability, availability, and performance. Whether you’re managing a microservices architecture or deploying a high-traffic web application, understanding Kubernetes load balancing is essential.

In this article, we’ll delve into the fundamentals of Kubernetes load balancing, explore its types, and provide practical examples to help you leverage this feature effectively.

What Is Kubernetes Load Balancing?

Kubernetes load balancing refers to the process of distributing network traffic across multiple pods or services in a Kubernetes cluster. It ensures that application workloads are evenly spread, preventing overloading of any single pod and improving system resilience.

Why Is Load Balancing Important?

  • Scalability: Efficiently manage increasing traffic.
  • High Availability: Reduce downtime by rerouting traffic to healthy pods.
  • Performance Optimization: Minimize latency by balancing requests.
  • Fault Tolerance: Automatically redirect traffic away from failing components.

Types of Kubernetes Load Balancing

1. Internal Load Balancing

Internal load balancing occurs within the Kubernetes cluster. It manages traffic between services and pods.

Examples:

  • Service-to-Service communication.
  • Redistributing traffic among pods in a Deployment.

2. External Load Balancing

External load balancing handles traffic from outside the Kubernetes cluster, directing it to appropriate services within the cluster.

Examples:

  • Exposing a web application to external users.
  • Managing client requests through a cloud-based load balancer.

3. Client-Side Load Balancing

In this approach, the client directly determines which pod to send requests to, typically using libraries like gRPC.

4. Server-Side Load Balancing

Here, the server-or Kubernetes service-manages the distribution of requests among pods.

Key Components of Kubernetes Load Balancing

1. Services

Kubernetes Services abstract pod endpoints and provide stable networking. Types include:

  • ClusterIP: Default, internal-only access.
  • NodePort: Exposes service on each node’s IP.
  • LoadBalancer: Integrates with external cloud load balancers.

2. Ingress

Ingress manages HTTP and HTTPS traffic routing, providing advanced load balancing features like TLS termination and path-based routing.

3. Endpoints

Endpoints map services to specific pod IPs and ports, forming the backbone of traffic routing.

Implementing Kubernetes Load Balancing

1. Setting Up a ClusterIP Service

ClusterIP is the default service type for internal load balancing.

Example:

apiVersion: v1
kind: Service
metadata:
  name: my-clusterip-service
spec:
  selector:
    app: my-app
  ports:
  - protocol: TCP
    port: 80
    targetPort: 8080
  type: ClusterIP

This configuration distributes internal traffic among pods labeled app: my-app.

2. Configuring a NodePort Service

NodePort exposes a service to external traffic.

Example:

apiVersion: v1
kind: Service
metadata:
  name: my-nodeport-service
spec:
  selector:
    app: my-app
  ports:
  - protocol: TCP
    port: 80
    targetPort: 8080
    nodePort: 30001
  type: NodePort

This allows access via <NodeIP>:30001.

3. Using a LoadBalancer Service

LoadBalancer integrates with cloud providers for external load balancing.

Example:

apiVersion: v1
kind: Service
metadata:
  name: my-loadbalancer-service
spec:
  selector:
    app: my-app
  ports:
  - protocol: TCP
    port: 80
    targetPort: 8080
  type: LoadBalancer

This setup creates a cloud-based load balancer and routes traffic to the appropriate pods.

4. Configuring Ingress for HTTP/HTTPS Routing

Ingress provides advanced traffic management.

Example:

apiVersion: networking.k8s.io/v1
kind: Ingress
metadata:
  name: my-ingress
spec:
  rules:
  - host: example.com
    http:
      paths:
      - path: /
        pathType: Prefix
        backend:
          service:
            name: my-service
            port:
              number: 80

This configuration routes example.com traffic to my-service.

Best Practices for Kubernetes Load Balancing

  • Use Labels and Selectors: Ensure accurate traffic routing.
  • Monitor Load Balancers: Use tools like Prometheus for observability.
  • Configure Health Checks: Detect and reroute failing pods.
  • Optimize Autoscaling: Combine load balancing with Horizontal Pod Autoscaler (HPA).
  • Secure Ingress: Implement TLS/SSL for encrypted communication.

FAQs

1. What is the difference between NodePort and LoadBalancer?

NodePort exposes a service on each node’s IP, while LoadBalancer integrates with external cloud load balancers to provide a single IP address for external access.

2. Can Kubernetes load balancing handle SSL termination?

Yes, Kubernetes Ingress can terminate SSL/TLS connections, simplifying secure communication.

3. How does Kubernetes handle failover?

Kubernetes automatically reroutes traffic away from unhealthy pods using health checks and endpoint updates.

4. What tools can enhance load balancing?

Tools like Traefik, NGINX Ingress Controller, and HAProxy provide advanced features for Kubernetes load balancing.

5. Is manual intervention required for scaling?

No, Kubernetes autoscaling features like HPA dynamically adjust pod replicas based on traffic and resource usage.

External Resources

Conclusion

Kubernetes load balancing is a cornerstone of application performance and reliability. By understanding its mechanisms, types, and implementation strategies, you can optimize your Kubernetes deployments for scalability and resilience. Explore further with hands-on experimentation to unlock its full potential for your applications. Thank you for reading the DevopsRoles page!

Local Kubernetes Cluster: A Comprehensive Guide to Getting Started

Introduction

Kubernetes has revolutionized the way we manage and deploy containerized applications. While cloud-based Kubernetes clusters like Amazon EKS, Google GKE, or Azure AKS dominate enterprise environments, a local Kubernetes cluster is invaluable for developers who want to test, debug, and prototype applications in an isolated environment.

Setting up Kubernetes locally can also save costs and simplify workflows for smaller-scale projects.

This guide will walk you through everything you need to know about using a local Kubernetes cluster effectively.

Why Use a Local Kubernetes Cluster?

Benefits of a Local Kubernetes Cluster

  1. Cost Efficiency: No need for cloud subscriptions or additional resources.
  2. Fast Prototyping: Test configurations and code changes without delays caused by remote clusters.
  3. Offline Development: Work without internet connectivity.
  4. Complete Control: Experiment with Kubernetes features without restrictions imposed by managed services.
  5. Learning Tool: A perfect environment for understanding Kubernetes concepts.

Setting Up Your Local Kubernetes Cluster

Tools for Local Kubernetes Clusters

Several tools can help you set up a local Kubernetes cluster:

  1. Minikube: Lightweight and beginner-friendly.
  2. Kind (Kubernetes IN Docker): Designed for testing Kubernetes itself.
  3. K3s: A lightweight Kubernetes distribution.
  4. Docker Desktop: Includes built-in Kubernetes support.

Comparison Table

ToolProsCons
MinikubeEasy setup, wide adoptionResource-intensive
KindGreat for CI/CD testingLimited GUI tools
K3sLightweight, minimal setupRequires additional effort for GUI
Docker DesktopAll-in-one, simple interfaceLimited customization

Installing Minikube (Step-by-Step)

Follow these steps to install and configure Minikube on your local machine:

Prerequisites

  • A system with at least 4GB RAM.
  • Installed package managers (e.g., Homebrew for macOS, Chocolatey for Windows).
  • Virtualization enabled in your BIOS/UEFI.

Installation Guide

  1. Download Minikube:
    • curl -LO https://storage.googleapis.com/minikube/releases/latest/minikube-linux-amd64
    • sudo install minikube-linux-amd64 /usr/local/bin/minikube
  2. Start Minikube:
    • minikube start --driver=docker
  3. Verify Installation:
    • kubectl get nodes
    • You should see your Minikube node listed.

Customizing Minikube

  • Add CPU and memory resources:
    • minikube start --cpus=4 --memory=8192
  • Enable Add-ons:minikube addons enable dashboard

Advanced Scenarios

Using Persistent Storage

Persistent storage ensures data survives pod restarts:

1.Create a PersistentVolume (PV) and PersistentVolumeClaim (PVC):

apiVersion: v1
kind: PersistentVolume
metadata:
  name: local-pv
spec:
  capacity:
    storage: 1Gi
  accessModes:
    - ReadWriteOnce
  hostPath:
    path: "/mnt/data"
---
apiVersion: v1
kind: PersistentVolumeClaim
metadata:
  name: local-pvc
spec:
  accessModes:
    - ReadWriteOnce
  resources:
    requests:
      storage: 1Gi

2.Apply the configuration:

kubectl apply -f pv-pvc.yaml

Testing Multi-Node Clusters

Minikube supports multi-node setups for testing advanced scenarios:

minikube start --nodes=3

Testing Multi-Node Clusters

Minikube supports multi-node setups for testing advanced scenarios:

minikube start --nodes=3

FAQ: Local Kubernetes Cluster

Frequently Asked Questions

What are the hardware requirements for running a local Kubernetes cluster?

At least 4GB of RAM and 2 CPUs are recommended for a smooth experience, though requirements may vary based on the tools used.

Can I simulate a production environment locally?

Yes, tools like Kind or K3s can help simulate production-like setups, including multi-node clusters and advanced networking.

How can I troubleshoot issues with my local cluster?

  • Use kubectl describe to inspect resource configurations.
  • Check Minikube logs:minikube logs

Is a local Kubernetes cluster secure?

Local clusters are primarily for development and are not hardened for production. Avoid using them for sensitive workloads.

External Resources

Conclusion

A local Kubernetes cluster is a versatile tool for developers and learners to experiment with Kubernetes features, test applications, and save costs. By leveraging tools like Minikube, Kind, or Docker Desktop, you can efficiently set up and manage Kubernetes environments on your local machine. Whether you’re a beginner or an experienced developer, a local cluster offers the flexibility and control needed to enhance your Kubernetes expertise.

Start setting up your local Kubernetes cluster today and unlock endless possibilities for containerized application development!Thank you for reading the DevopsRoles page!

Kubernetes Secret YAML: Comprehensive Guide

Introduction

Kubernetes Secrets provide a secure way to manage sensitive data, such as passwords, API keys, and tokens, in your Kubernetes clusters. Unlike ConfigMaps, Secrets are specifically designed to handle confidential information securely. In this article, we explore the Kubernetes Secret YAML, including its structure, creation process, and practical use cases. By the end, you’ll have a solid understanding of how to manage Secrets effectively.

What Is a Kubernetes Secret YAML?

A Kubernetes Secret YAML file is a declarative configuration used to create Kubernetes Secrets. These Secrets store sensitive data in your cluster securely, enabling seamless integration with applications without exposing the data in plaintext. Kubernetes encodes the data in base64 format and provides restricted access based on roles and policies.

Why Use Kubernetes Secrets?

  • Enhanced Security: Protect sensitive information by storing it separately from application code.
  • Role-Based Access Control (RBAC): Limit access to Secrets using Kubernetes policies.
  • Centralized Management: Manage sensitive data centrally, improving scalability and maintainability.
  • Data Encryption: Optionally enable encryption at rest for Secrets.

How to Create Kubernetes Secrets Using YAML

1. Basic Structure of a Secret YAML

Here is a simple structure of a Kubernetes Secret YAML file:

apiVersion: v1
kind: Secret
metadata:
  name: my-secret
type: Opaque
data:
  username: dXNlcm5hbWU=  # Base64 encoded 'username'
  password: cGFzc3dvcmQ=  # Base64 encoded 'password'

Key Components:

  • apiVersion: Specifies the Kubernetes API version.
  • kind: Defines the object type as Secret.
  • metadata: Contains metadata such as the name of the Secret.
  • type: Defines the Secret type (e.g., Opaque for generic use).
  • data: Stores key-value pairs with values encoded in base64.

2. Encoding Data in Base64

Before adding sensitive information to the Secret YAML, encode it in base64 format:

echo -n 'username' | base64  # Outputs: dXNlcm5hbWU=
echo -n 'password' | base64  # Outputs: cGFzc3dvcmQ=

3. Applying the Secret YAML

Use the kubectl command to apply the Secret YAML:

kubectl apply -f my-secret.yaml

4. Verifying the Secret

Check if the Secret was created successfully:

kubectl get secrets
kubectl describe secret my-secret

Advanced Use Cases

1. Using Secrets with Pods

To use a Secret in a Pod, mount it as an environment variable or volume.

Example: Environment Variable

apiVersion: v1
kind: Pod
metadata:
  name: secret-env-pod
spec:
  containers:
  - name: my-container
    image: nginx
    env:
    - name: SECRET_USERNAME
      valueFrom:
        secretKeyRef:
          name: my-secret
          key: username
    - name: SECRET_PASSWORD
      valueFrom:
        secretKeyRef:
          name: my-secret
          key: password

Example: Volume Mount

apiVersion: v1
kind: Pod
metadata:
  name: secret-volume-pod
spec:
  containers:
  - name: my-container
    image: nginx
    volumeMounts:
    - name: secret-volume
      mountPath: "/etc/secret-data"
      readOnly: true
  volumes:
  - name: secret-volume
    secret:
      secretName: my-secret

2. Encrypting Secrets at Rest

Enable encryption at rest for Kubernetes Secrets using a custom encryption provider.

  1. Edit the API server configuration:
--encryption-provider-config=/path/to/encryption-config.yaml
  1. Example Encryption Configuration File:
apiVersion: apiserver.config.k8s.io/v1
kind: EncryptionConfiguration
encryption:
  resources:
  - resources:
      - secrets
    providers:
    - aescbc:
        keys:
        - name: key1
          secret: c2VjcmV0LWtleQ==  # Base64-encoded key
    - identity: {}

3. Automating Secrets Management with Helm

Use Helm charts to simplify and standardize the deployment of Secrets:

apiVersion: v1
kind: Secret
metadata:
  name: {{ .Values.secretName }}
type: Opaque
data:
  username: {{ .Values.username | b64enc }}
  password: {{ .Values.password | b64enc }}

Define the values in values.yaml:

secretName: my-secret
username: admin
password: secret123

FAQ: Kubernetes Secret YAML

1. What are the different Secret types in Kubernetes?

  • Opaque: Default type for storing arbitrary data.
  • kubernetes.io/dockerconfigjson: Used for Docker registry credentials.
  • kubernetes.io/tls: For storing TLS certificates and keys.

2. How to update a Kubernetes Secret?

Edit the Secret using kubectl:

kubectl edit secret my-secret

3. Can Secrets be shared across namespaces?

No, Secrets are namespace-scoped. To share across namespaces, you must replicate them manually or use a tool like Crossplane.

4. Are Secrets secure in Kubernetes?

By default, Secrets are base64-encoded but not encrypted. To enhance security, enable encryption at rest and implement RBAC.

External Links

Conclusion

Kubernetes Secrets play a vital role in managing sensitive information securely in your clusters. By mastering the Kubernetes Secret YAML, you can ensure robust data security while maintaining seamless application integration. Whether you are handling basic credentials or implementing advanced encryption, Kubernetes provides the flexibility and tools needed to manage sensitive data effectively.

Start using Kubernetes Secrets today to enhance the security and scalability of your applications! Thank you for reading the DevopsRoles page!

Troubleshoot Kubernetes: A Comprehensive Guide

Introduction

Kubernetes is a robust container orchestration platform, enabling developers to manage, scale, and deploy applications effortlessly. However, with great power comes complexity, and troubleshooting Kubernetes can be daunting. Whether you’re facing pod failures, resource bottlenecks, or networking issues, understanding how to diagnose and resolve these problems is essential for smooth operations.

In this guide, we’ll explore effective ways to troubleshoot Kubernetes, leveraging built-in tools, best practices, and real-world examples to tackle both common and advanced challenges.

Understanding the Basics of Kubernetes Troubleshooting

Why Troubleshooting Matters

Troubleshooting Kubernetes is critical to maintaining the health and availability of your applications. Identifying root causes quickly ensures minimal downtime and optimal performance.

Common Issues in Kubernetes

  • Pod Failures: Pods crash due to misconfigured resources or code errors.
  • Node Issues: Overloaded or unreachable nodes affect application stability.
  • Networking Problems: Connectivity issues between services or pods.
  • Persistent Volume Errors: Storage misconfigurations disrupt data handling.
  • Authentication and Authorization Errors: Issues with Role-Based Access Control (RBAC).

Tools for Troubleshooting Kubernetes

Built-in Kubernetes Commands

  • kubectl describe: Provides detailed information about Kubernetes objects.
  • kubectl logs: Fetches logs for a specific pod.
  • kubectl exec: Executes commands inside a running container.
  • kubectl get: Lists objects like pods, services, and nodes.
  • kubectl events: Shows recent events in the cluster.

External Tools

  • K9s: Simplifies Kubernetes cluster management with an interactive terminal UI.
  • Lens: A powerful IDE for visualizing and managing Kubernetes clusters.
  • Prometheus and Grafana: Monitor and visualize cluster metrics.
  • Fluentd and Elasticsearch: Collect and analyze logs for insights.

Step-by-Step Guide to Troubleshoot Kubernetes

1. Diagnosing Pod Failures

Using kubectl describe

kubectl describe pod <pod-name>

This command provides detailed information, including events leading to the failure.

Checking Logs

kubectl logs <pod-name>
  • Use -c <container-name> to specify a container in a multi-container pod.
  • Analyze errors or warnings for root causes.

Example:

A pod fails due to insufficient memory:

  • Output: OOMKilled (Out of Memory Killed)
  • Solution: Adjust resource requests and limits in the pod specification.

2. Resolving Node Issues

Check Node Status

kubectl get nodes
  • Statuses like NotReady indicate issues.

Inspect Node Events

kubectl describe node <node-name>
  • Analyze recent events for hardware or connectivity problems.

3. Debugging Networking Problems

Verify Service Connectivity

kubectl get svc
  • Ensure the service is correctly exposing the application.

Test Pod-to-Pod Communication

kubectl exec -it <pod-name> -- ping <target-pod-ip>
  • Diagnose networking issues at the pod level.

4. Persistent Volume Troubleshooting

Verify Volume Attachments

kubectl get pvc
  • Ensure the PersistentVolumeClaim (PVC) is bound to a PersistentVolume (PV).

Debug Storage Errors

kubectl describe pvc <pvc-name>
  • Inspect events for allocation or access issues.

Advanced Troubleshooting Scenarios

Monitoring Resource Utilization

  • Use Prometheus to track CPU and memory usage.
  • Analyze trends and set alerts for anomalies.

Debugging Application-Level Issues

  • Leverage kubectl port-forward for local debugging:
kubectl port-forward pod/<pod-name> <local-port>:<pod-port>
  • Access the application via localhost to troubleshoot locally.

Identifying Cluster-Level Bottlenecks

  • Inspect etcd health using etcdctl:
etcdctl endpoint health
  • Monitor API server performance metrics.

Frequently Asked Questions

1. What are the best practices for troubleshooting Kubernetes?

  • Use namespaces to isolate issues.
  • Employ centralized logging and monitoring solutions.
  • Automate repetitive diagnostic tasks with scripts or tools like K9s.

2. How do I troubleshoot Kubernetes DNS issues?

  • Check the kube-dns or CoreDNS pod logs:
kubectl logs -n kube-system <dns-pod-name>
  • Verify DNS resolution within a pod:
kubectl exec -it <pod-name> -- nslookup <service-name>

3. How can I improve my troubleshooting skills?

  • Familiarize yourself with Kubernetes documentation and tools.
  • Practice in a test environment.
  • Stay updated with community resources and webinars.

Additional Resources

Conclusion

Troubleshooting Kubernetes effectively requires a combination of tools, best practices, and hands-on experience. By mastering kubectl commands, leveraging external tools, and understanding common issues, you can maintain a resilient and efficient Kubernetes cluster. Start practicing these techniques today and transform challenges into learning opportunities for smoother operations. Thank you for reading the DevopsRoles page!

Using Docker and Kubernetes Together

Introduction

Docker and Kubernetes have revolutionized the world of containerized application deployment and management. While Docker simplifies the process of creating, deploying, and running applications in containers, Kubernetes orchestrates these containers at scale.

Using Docker and Kubernetes together unlocks a powerful combination that ensures efficiency, scalability, and resilience in modern application development. This article explores how these two technologies complement each other, practical use cases, and step-by-step guides to get started.

Why Use Docker and Kubernetes Together?

Key Benefits

Enhanced Scalability

  • Kubernetes’ orchestration capabilities allow you to scale containerized applications seamlessly, leveraging Docker’s efficient container runtime.

Simplified Management

  • Kubernetes automates the deployment, scaling, and management of Docker containers, reducing manual effort and errors.

Improved Resource Utilization

  • By using Docker containers with Kubernetes, you can ensure optimal resource utilization across your infrastructure.

Getting Started with Docker and Kubernetes

Setting Up Docker

Install Docker

  1. Download the Docker installer from Docker’s official website.
  2. Follow the installation instructions for your operating system (Windows, macOS, or Linux).
  3. Verify the installation by running:docker --version

Build and Run a Container

Create a Dockerfile for your application:

FROM node:14
WORKDIR /app
COPY . .
RUN npm install
CMD ["node", "app.js"]

Build the Docker image:

docker build -t my-app .

Run the container:

docker run -d -p 3000:3000 my-app

Setting Up Kubernetes

Install Kubernetes (Minikube or Kind)

  • Minikube: A local Kubernetes cluster for testing.
  • Kind: Kubernetes in Docker, ideal for CI/CD pipelines.

Install Minikube:

curl -LO https://storage.googleapis.com/minikube/releases/latest/minikube-linux-amd64 \
&& sudo install minikube-linux-amd64 /usr/local/bin/minikube

Start Minikube:

minikube start

Install kubectl

Download kubectl for managing Kubernetes clusters:

curl -LO "https://dl.k8s.io/release/$(curl -L -s https://dl.k8s.io/release/stable.txt)/bin/linux/amd64/kubectl"
chmod +x kubectl
sudo mv kubectl /usr/local/bin/

Using Docker and Kubernetes Together: Step-by-Step

Deploying a Docker Application in Kubernetes

Step 1: Create a Docker Image

Build and push your Docker image to a container registry (e.g., Docker Hub or AWS ECR):

docker tag my-app:latest my-dockerhub-username/my-app:latest
docker push my-dockerhub-username/my-app:latest

Step 2: Define a Kubernetes Deployment

Create a deployment.yaml file:

apiVersion: apps/v1
kind: Deployment
metadata:
  name: my-app-deployment
spec:
  replicas: 3
  selector:
    matchLabels:
      app: my-app
  template:
    metadata:
      labels:
        app: my-app
    spec:
      containers:
      - name: my-app
        image: my-dockerhub-username/my-app:latest
        ports:
        - containerPort: 3000

Step 3: Apply the Deployment

Deploy your application:

kubectl apply -f deployment.yaml

Step 4: Expose the Application

Expose the deployment as a service:

kubectl expose deployment my-app-deployment --type=LoadBalancer --name=my-app-service

Step 5: Verify the Deployment

List all running pods:

kubectl get pods

Check the service:

kubectl get service my-app-service

Examples: Real-World Use Cases

Basic Example: A Web Application

A Node.js application in Docker deployed to Kubernetes for high availability.

Advanced Example: Microservices Architecture

Using multiple Docker containers managed by Kubernetes for services like authentication, billing, and notifications.

FAQ

Frequently Asked Questions

Q: Can I use Docker without Kubernetes?

A: Yes, Docker can run independently. However, Kubernetes adds orchestration, scalability, and management benefits for complex systems.

Q: Is Kubernetes replacing Docker?

A: No. Kubernetes and Docker serve different purposes and are complementary. Kubernetes orchestrates containers, which Docker creates and runs.

Q: What is the difference between Docker Compose and Kubernetes?

A: Docker Compose is suitable for local multi-container setups, while Kubernetes is designed for scaling and managing containers in production.

Q: How do I monitor Docker containers in Kubernetes?

A: Tools like Prometheus, Grafana, and Kubernetes’ built-in dashboards can help monitor containers and resources.

Conclusion

Docker and Kubernetes together form the backbone of modern containerized application management. Docker simplifies container creation, while Kubernetes ensures scalability and efficiency. By mastering both, you can build robust, scalable systems that meet the demands of today’s dynamic environments. Start small, experiment with deployments, and expand your expertise to harness the full potential of these powerful technologies. Thank you for reading the DevopsRoles page!

Kubernetes Helm Chart Tutorial: A Comprehensive Guide to Managing Kubernetes Applications

Introduction

Kubernetes has become the de facto standard for container orchestration, and with its robust features, it enables developers and DevOps teams to manage and scale containerized applications seamlessly. However, managing Kubernetes resources directly can become cumbersome as applications grow in complexity. This is where Helm Chart Tutorial come into play. Helm, the package manager for Kubernetes, simplifies deploying and managing applications by allowing you to define, install, and upgrade Kubernetes applications with ease.

In this tutorial, we’ll dive deep into using Helm charts, covering everything from installation to creating your own custom charts. Whether you’re a beginner or an experienced Kubernetes user, this guide will help you master Helm to improve the efficiency and scalability of your applications.

What is Helm?

Helm is a package manager for Kubernetes that allows you to define, install, and upgrade applications and services on Kubernetes clusters. It uses a packaging format called Helm charts, which are collections of pre-configured Kubernetes resources such as deployments, services, and config maps.

With Helm, you can automate the process of deploying complex applications, manage dependencies, and configure Kubernetes resources through simple YAML files. Helm helps streamline the entire process of Kubernetes application deployment, making it easier to manage and scale applications in production environments.

How Helm Works

Helm operates by packaging Kubernetes resources into charts, which are collections of files that describe a related set of Kubernetes resources. Helm charts make it easier to deploy and manage applications by:

  • Bundling Kubernetes resources into a single package.
  • Versioning applications so that you can upgrade, rollback, or re-deploy applications as needed.
  • Enabling dependency management, allowing you to install multiple applications with shared dependencies.

Helm charts consist of several key components:

  1. Chart.yaml: Metadata about the Helm chart, such as the chart’s name, version, and description.
  2. Templates: Kubernetes resource templates written in YAML that define the Kubernetes objects.
  3. Values.yaml: Default configuration values that can be customized during chart installation.
  4. Charts/Dependencies: Any other charts that are required as dependencies.

Installing Helm

Before you can use Helm charts, you need to install Helm on your local machine or CI/CD environment. Helm supports Linux, macOS, and Windows operating systems. Here’s how you can install Helm:

1. Install Helm on Linux/MacOS/Windows

  • Linux:
    You can install Helm using a package manager such as apt or snap. Alternatively, download the latest release from the official Helm GitHub page.
    • curl https://get.helm.sh/helm-v3.9.0-linux-amd64.tar.gz -o helm.tar.gz
    • tar -zxvf helm.tar.gz
    • sudo mv linux-amd64/helm /usr/local/bin/helm
  • MacOS:
    The easiest way to install Helm on MacOS is using brew:
    • brew install helm
  • Windows:
    For Windows users, you can install Helm via Chocolatey:
    • choco install kubernetes-helm

2. Verify Helm Installation

Once installed, verify that Helm is correctly installed by running the following command:

helm version

You should see the version information for Helm.

Installing and Using Helm Charts

Now that Helm is installed, let’s dive into how you can install a Helm chart and manage your applications.

Step 1: Adding Helm Repositories

Helm repositories store charts that you can install into your Kubernetes cluster. The default Helm repository is Helm Hub, but you can add other repositories for more chart options. To add a repository:

helm repo add stable https://charts.helm.sh/stable
helm repo update

Step 2: Installing a Helm Chart

To install a chart, use the helm install command followed by a release name and chart name:

helm install my-release stable/mysql

This command installs the MySQL Helm chart from the stable repository and names the release my-release.

Step 3: Customizing Helm Chart Values

When installing a chart, you can override the default values specified in the values.yaml file by providing your own configuration file or using the --set flag:

helm install my-release stable/mysql --set mysqlRootPassword=my-secret-password

This command sets the MySQL root password to my-secret-password.

Advanced Usage: Creating Custom Helm Charts

While using pre-existing Helm charts is a common approach, sometimes you may need to create your own custom charts for your applications. Here’s a simple guide to creating a custom Helm chart:

Step 1: Create a Helm Chart

To create a new Helm chart, use the helm create command:

helm create my-chart

This creates a directory structure for your Helm chart, including default templates and values files.

Step 2: Customize Your Templates

Edit the templates in the my-chart/templates directory to define the Kubernetes resources you need. For example, you could define a deployment.yaml file for deploying your app.

Step 3: Update the Values.yaml

The values.yaml file is where you define default values for your chart. For example, you can define application-specific configuration here, such as image tags or resource limits.

image:
  repository: myapp
  tag: "1.0.0"

Step 4: Install the Custom Chart

Once you’ve customized your Helm chart, install it using the helm install command:

helm install my-release ./my-chart

This will deploy your application to your Kubernetes cluster using the custom Helm chart.

Managing Helm Releases

After deploying an application with Helm, you can manage the release in various ways, including upgrading, rolling back, and uninstalling.

Upgrade a Helm Release

To upgrade an existing release to a new version, use the helm upgrade command:

helm upgrade my-release stable/mysql --set mysqlRootPassword=new-secret-password

Rollback a Helm Release

If you need to revert to a previous version of your application, use the helm rollback command:

helm rollback my-release 1

This will rollback the release to revision 1.

Uninstall a Helm Release

To uninstall a Helm release, use the helm uninstall command:

helm uninstall my-release

This will delete the resources associated with the release.

FAQ Section: Kubernetes Helm Chart Tutorial

1. What is the difference between Helm and Kubernetes?

Helm is a tool that helps you manage Kubernetes applications by packaging them into charts. Kubernetes is the container orchestration platform that provides the environment for running containerized applications.

2. How do Helm charts improve Kubernetes management?

Helm charts provide an easier way to deploy, manage, and upgrade applications on Kubernetes. They allow you to define reusable templates for Kubernetes resources, making the process of managing applications simpler and more efficient.

3. Can I use Helm for multiple Kubernetes clusters?

Yes, you can use Helm across multiple Kubernetes clusters. You can configure Helm to point to different clusters and manage applications on each one.

4. Are there any limitations to using Helm charts?

While Helm charts simplify the deployment process, they can sometimes obscure the underlying Kubernetes configurations. Users should still have a good understanding of Kubernetes resources to effectively troubleshoot and customize their applications.

Conclusion

Helm charts are an essential tool for managing applications in Kubernetes, making it easier to deploy, scale, and maintain complex applications. Whether you’re using pre-packaged charts or creating your own custom charts, Helm simplifies the entire process. In this tutorial, we’ve covered the basics of Helm installation, usage, and advanced scenarios to help you make the most of this powerful tool.

For more detailed information on Helm charts, check out the official Helm documentation. With Helm, you can enhance your Kubernetes experience and improve the efficiency of your workflows. Thank you for reading the DevopsRoles page!

OWASP Top 10 Kubernetes: Securing Your Kubernetes Environment

Introduction

Kubernetes has become the de facto standard for container orchestration, allowing developers and IT teams to efficiently deploy and manage applications in cloud-native environments. However, as Kubernetes environments grow in complexity, they also present new security challenges. The OWASP Top 10 Kubernetes is a framework designed to highlight the most common security vulnerabilities specific to Kubernetes deployments.

In this article, we’ll explore each of the OWASP Top 10 Kubernetes risks, discuss how they can impact your environment, and provide best practices for mitigating them. Whether you’re new to Kubernetes or an experienced professional, understanding these risks and how to address them will strengthen your security posture and protect your applications.

The OWASP Top 10 Kubernetes: A Brief Overview

The OWASP (Open Web Application Security Project) Top 10 is a widely recognized list that identifies the most critical security risks to web applications and cloud-native systems. For Kubernetes, the list has been adapted to highlight threats specific to containerized environments. These risks are categorized into common attack vectors, misconfigurations, and vulnerabilities that organizations should be aware of when working with Kubernetes.

The OWASP Top 10 Kubernetes is designed to guide teams in implementing robust security measures that protect the integrity, availability, and confidentiality of Kubernetes clusters and workloads.

The OWASP Top 10 Kubernetes Risks

Let’s dive into each of the OWASP Top 10 Kubernetes risks, with a focus on understanding the potential threats and actionable strategies to mitigate them.

1. Insecure Workload Configuration

Understanding the Risk

Workload configuration in Kubernetes refers to the settings and policies applied to applications running within containers. Misconfigured workloads can expose containers to attacks, allowing unauthorized users to access resources or escalate privileges.

Mitigation Strategies

  • Use Role-Based Access Control (RBAC): Limit access to resources by assigning roles and permissions based on the principle of least privilege.
  • Set Resource Limits: Define CPU and memory limits for containers to prevent resource exhaustion.
  • Use Network Policies: Enforce network communication rules between containers to limit exposure to other services.

2. Excessive Permissions

Understanding the Risk

In Kubernetes, permissions are granted to users, services, and containers through RBAC, Service Accounts, and other mechanisms. However, over-permissioning can give attackers the ability to execute malicious actions if they compromise a resource with excessive access rights.

Mitigation Strategies

  • Principle of Least Privilege (PoLP): Grant the minimal necessary permissions to all users and workloads.
  • Audit Access Control Policies: Regularly review and audit RBAC policies and Service Account roles.
  • Use Auditing Tools: Tools like Kubernetes Audit Logs can help track who is accessing what, making it easier to spot excessive permissions.

3. Improper Secrets Management

Understanding the Risk

Kubernetes allows storing sensitive data, such as passwords and API keys, in the form of secrets. Improper handling of these secrets can lead to unauthorized access to critical infrastructure and data.

Mitigation Strategies

  • Encrypt Secrets: Ensure secrets are encrypted both at rest and in transit.
  • Use External Secrets Management: Integrate with tools like HashiCorp Vault or AWS Secrets Manager to securely store and manage secrets outside of Kubernetes.
  • Limit Access to Secrets: Restrict access to secrets based on user roles and ensure they are only available to the applications that need them.

4. Vulnerabilities in the Container Image

Understanding the Risk

Containers are built from images, and these images may contain security vulnerabilities if they are not regularly updated or come from untrusted sources. Attackers can exploit these vulnerabilities to gain access to your system.

Mitigation Strategies

  • Use Trusted Images: Only pull images from reputable sources and official repositories like Docker Hub or GitHub.
  • Regularly Scan Images: Use tools like Clair, Trivy, or Anchore to scan container images for known vulnerabilities.
  • Implement Image Signing: Sign images to ensure their integrity and authenticity before deploying them.

5. Insufficient Logging and Monitoring

Understanding the Risk

Without proper logging and monitoring, malicious activity within a Kubernetes cluster may go undetected. Security breaches and performance issues can escalate without visibility into system behavior.

Mitigation Strategies

  • Enable Audit Logs: Ensure Kubernetes audit logging is enabled to record every API request.
  • Centralized Logging: Use logging solutions like ELK Stack (Elasticsearch, Logstash, Kibana) or Splunk for centralized logging.
  • Integrate Monitoring Tools: Tools like Prometheus and Grafana can help with real-time monitoring and alerting on unusual activity.

6. Insecure Network Policies

Understanding the Risk

Kubernetes network policies define the rules governing traffic between pods and services. Without proper network segmentation, workloads may be exposed to potential attacks or unauthorized access.

Mitigation Strategies

  • Implement Network Segmentation: Use Kubernetes network policies to limit traffic to only necessary services.
  • Encrypt Traffic: Use mutual TLS (Transport Layer Security) to encrypt communication between services.
  • Implement DNS Policies: Enforce DNS-based security to block access to malicious external domains.

7. Lack of Pod Security Standards

Understanding the Risk

Kubernetes pods are the smallest deployable units, but insecure pod configurations can open the door for privilege escalation or container escape attacks.

Mitigation Strategies

  • Pod Security Policies: Use PodSecurityPolicy to define the security context for pods, enforcing secure settings like running containers with non-root users.
  • Use Security Contexts: Ensure pods use restricted security contexts to minimize privilege escalation risks.
  • Limit Host Access: Restrict pods’ access to the host system and its kernel.

8. Insecure API Server Configuration

Understanding the Risk

The Kubernetes API server is the primary entry point for interacting with a cluster. Misconfigurations or insufficient access controls can expose your entire Kubernetes environment to attackers.

Mitigation Strategies

  • Secure API Server: Ensure the API server is configured to only accept secure connections and that authentication mechanisms (e.g., RBAC, OIDC) are properly implemented.
  • Limit API Server Access: Restrict access to the API server using firewalls or other access control measures.
  • Use API Gateway: Use an API gateway for additional layer of security and monitoring for all inbound and outbound API traffic.

9. Exposed etcd

Understanding the Risk

etcd is the key-value store that holds critical Kubernetes configuration data. If etcd is not properly secured, it can become a target for attackers to gain control over the cluster’s configuration.

Mitigation Strategies

  • Encrypt etcd Data: Encrypt etcd data both at rest and in transit to protect sensitive information.
  • Limit Access to etcd: Restrict access to etcd only to trusted users and Kubernetes components.
  • Backup etcd Regularly: Ensure that etcd backups are performed regularly and stored securely.

10. Denial of Service (DoS) Vulnerabilities

Understanding the Risk

Kubernetes workloads can be vulnerable to denial of service (DoS) attacks, which can overwhelm resources, making services unavailable. These attacks may target Kubernetes API servers, workers, or network components.

Mitigation Strategies

  • Rate Limiting: Implement rate limiting for API requests to prevent DoS attacks on the Kubernetes API server.
  • Resource Quotas: Use Kubernetes resource quotas to prevent resource exhaustion by limiting the number of resources a user or pod can consume.
  • Use Ingress Controllers: Secure Kubernetes ingress controllers to prevent malicious external traffic from affecting your services.

Example: Applying OWASP Top 10 Kubernetes Best Practices

Let’s look at a practical example of securing a Kubernetes cluster by applying the OWASP Top 10 Kubernetes best practices.

  1. Configure Network Policies: To prevent unauthorized access between pods, create network policies that allow only certain pods to communicate with each other.
  2. Use Pod Security Policies: Enforce non-root user execution within pods to prevent privilege escalation.
  3. Enable API Server Auditing: Enable and configure API server auditing to keep track of all requests made to the Kubernetes API.

By implementing these practices, you ensure a more secure Kubernetes environment, reducing the likelihood of security breaches.

FAQ: OWASP Top 10 Kubernetes

1. What is the OWASP Top 10 Kubernetes?

The OWASP Top 10 Kubernetes is a list of the most critical security risks associated with Kubernetes environments. It provides guidance on how to secure Kubernetes clusters and workloads.

2. How can I secure my Kubernetes workloads?

You can secure Kubernetes workloads by using RBAC for access control, securing secrets management, configuring network policies, and regularly scanning container images for vulnerabilities.

3. What is the principle of least privilege (PoLP)?

PoLP is the practice of granting only the minimal permissions necessary for a user or service to perform its tasks, reducing the attack surface and mitigating security risks.

Conclusion

Securing your Kubernetes environment is a multi-faceted process that requires vigilance, best practices, and ongoing attention to detail. By understanding and addressing the OWASP Top 10 Kubernetes risks, you can significantly reduce the chances of a security breach in your Kubernetes deployment. Implementing robust security policies, regularly auditing configurations, and adopting a proactive approach to security will help ensure that your Kubernetes clusters remain secure, stable, and resilient.

For more detailed guidance, consider exploring official Kubernetes documentation, and security tools, and following the latest Kubernetes security updates.Thank you for reading the DevopsRoles page!

External Resources: