Table of Contents
Introduction
In this tutorial, How to monitor your system using Grafana InfluxDB and Telegraf. This article will guide you through the process of setting up and using these tools, from basic configurations to advanced monitoring techniques.
What is Monitoring with Grafana InfluxDB and Telegraf?
Monitoring with Grafana, InfluxDB, and Telegraf involves collecting, storing, and visualizing time-series data. Telegraf is responsible for gathering data from various sources, InfluxDB stores this data, and Grafana visualizes it through customizable dashboards.
Benefits of Using Grafana, InfluxDB, and Telegraf
- Real-time Monitoring: Visualize data in real-time to quickly identify and address issues.
- Scalability: Easily scale your monitoring setup to handle increased data volumes.
- Customization: Create personalized dashboards to suit your specific monitoring needs.
My example is Grafana InfluxDB, Telegraf as in the picture below:
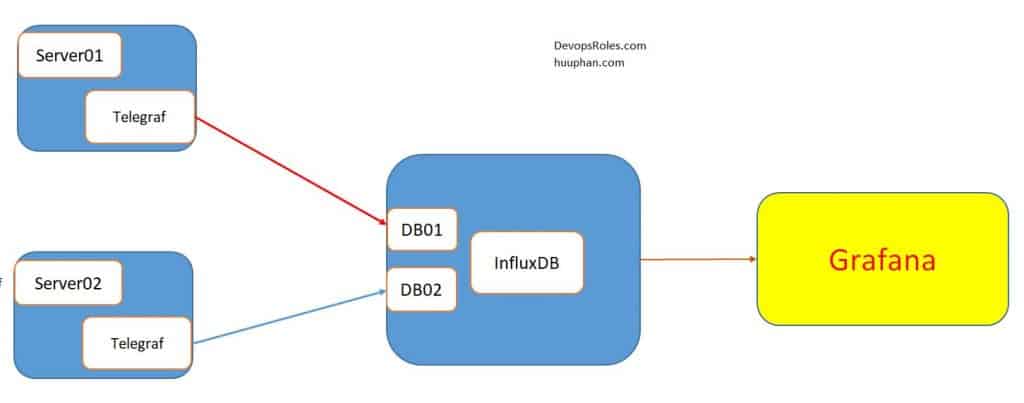
- Server01 -> 192.168.3.5
- Server02 -> 192.168.3.6
- InfluxDB and Grafana -> 192.168.3.4
Install Grafana Influxdb and Telegraf on Linux
Configure Grafana InfluxDB and Telegraf
InfluxDB configure
For my example, create 2 Databases with a 14-day retention policy.
[root@DevopsRoles ~]# influx
Connected to http://localhost:8086 version 1.7.6
InfluxDB shell version: 1.7.6
Enter an InfluxQL query
> show databases
name: databases
name
----
telegraf
mydb
_internal
> CREATE DATABASE mydb WITH DURATION 14d
> CREATE DATABASE telegraf WITH DURATION 14d
Open and edit the file /etc/influxdb/influxdb.conf as below
[[opentsdb]]
   enabled = true
   bind-address = ":4243"
   database = "mydb"
[[opentsdb]]
   enabled = true
   bind-address = ":4242"
   database = "telegraf"
Telegraf Configure
For example, create file configuration as below
$ telegraf -sample-config -input-filter cpu:mem:swap:net -output-filter influxdb > telegraf.confEdit and modify the file /etc/telegraf/telegraf.conf for server01
[[outputs.influxdb]]
urls = ["http://192.168.3.4:8086"]
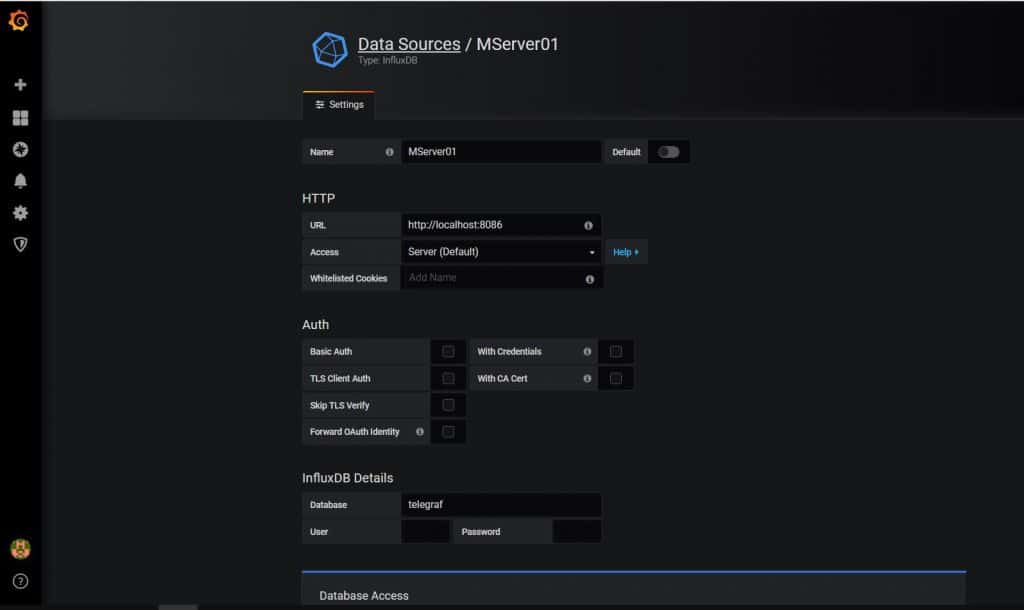
database = "telegraf" Grafana Configure
Add Data Sources for InfluxDB of Server01 as in the picture below
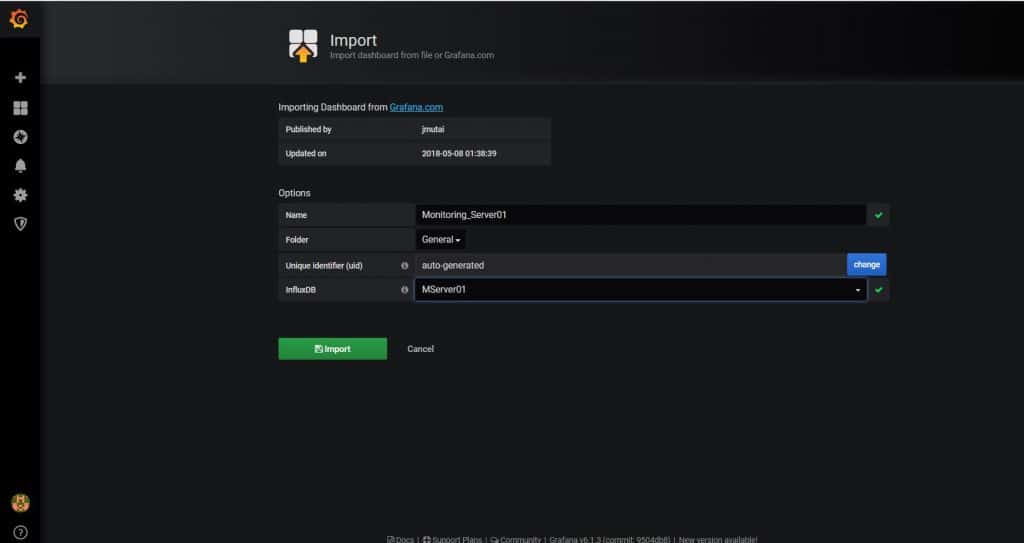
Import the Telegraf JSON template as the picture below
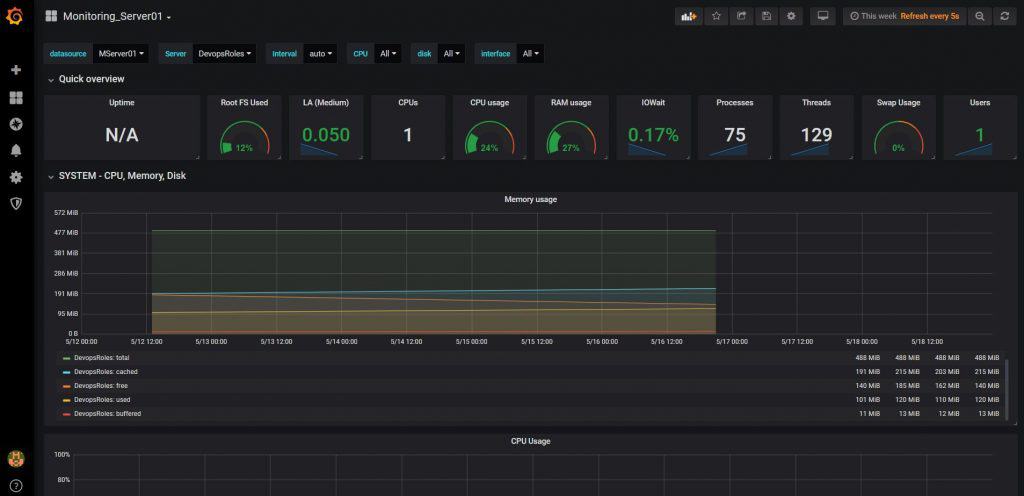
The result of Monitoring with Grafana InfluxDB Telegraf
Frequently Asked Questions (FAQs)
What is the role of Telegraf in the monitoring stack?
Telegraf collects and sends data from various sources to InfluxDB for storage.
How do I create custom dashboards in Grafana?
You can create custom dashboards by adding and configuring panels within Grafana.
Can I set up alerts in Grafana?
Yes, Grafana supports alerting, which can notify you about critical events.
How do I scale my monitoring setup?
You can scale by adding more Telegraf agents, increasing InfluxDB storage, and optimizing Grafana dashboards.
Conclusion
You have Monitored with Grafana InfluxDB and Telegraf. I hope will this your helpful. Thank you for reading the DevopsRoles page!