Grafana is tool monitoring and Data visualization with support InfluxDB, Graphite, Prometheus, Elasticsearch, and many more databases.
In this tutorial, How to install Grafana on Linux. Link download manually here
Table of Contents
Install Grafana on Centos 7
Add Grafana yum repository
[vagrant@DevopsRoles ~]$ cat <<EOF | sudo tee /etc/yum.repos.d/grafana.repo
[grafana]
name=grafana
baseurl=https://packages.grafana.com/oss/rpm
repo_gpgcheck=1
enabled=1
gpgcheck=1
gpgkey=https://packages.grafana.com/gpg.key
sslverify=1
sslcacert=/etc/pki/tls/certs/ca-bundle.crt
EOF
Update cache index as below
[vagrant@DevopsRoles ~]$ sudo yum makecache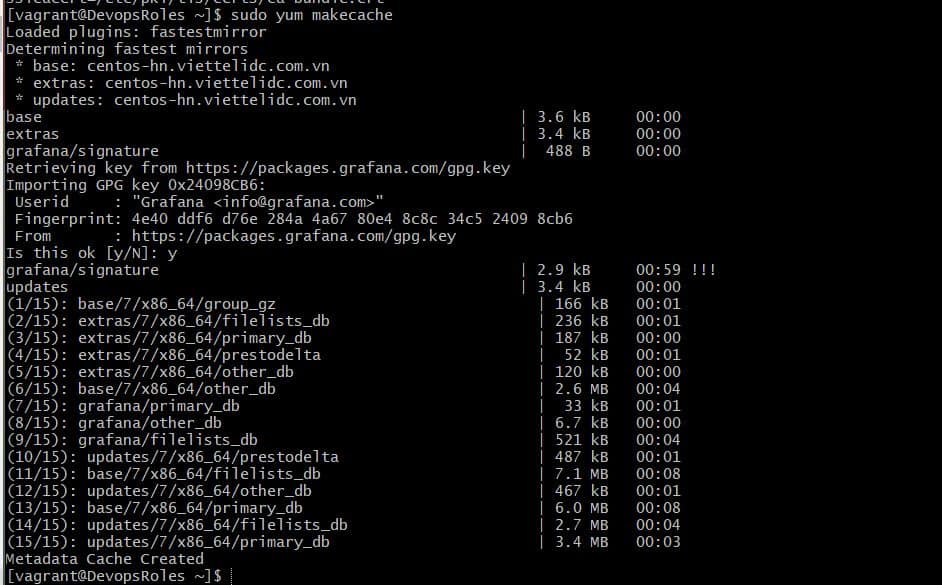
Install Grafana
[vagrant@DevopsRoles ~]$ sudo yum -y install grafanaStart Grafana service
[vagrant@DevopsRoles ~]$ sudo systemctl enable --now grafana-server.serviceThe default port of Grafana used is 3000
Grafana write logs to /var/log/grafana directory and its SQLite database is located under /var/lib/grafana/grafana.db
Open firewall port for Grafana
[vagrant@DevopsRoles ~]$ sudo firewall-cmd --add-port=3000/tcp --permanent
[vagrant@DevopsRoles ~]$ sudo firewall-cmd --reload
Access Grafana Dashboard on Centos 7
Grafana web dashboard on http://[Server IP|Hostname]:3000
The default login as below
username: admin
Password: admin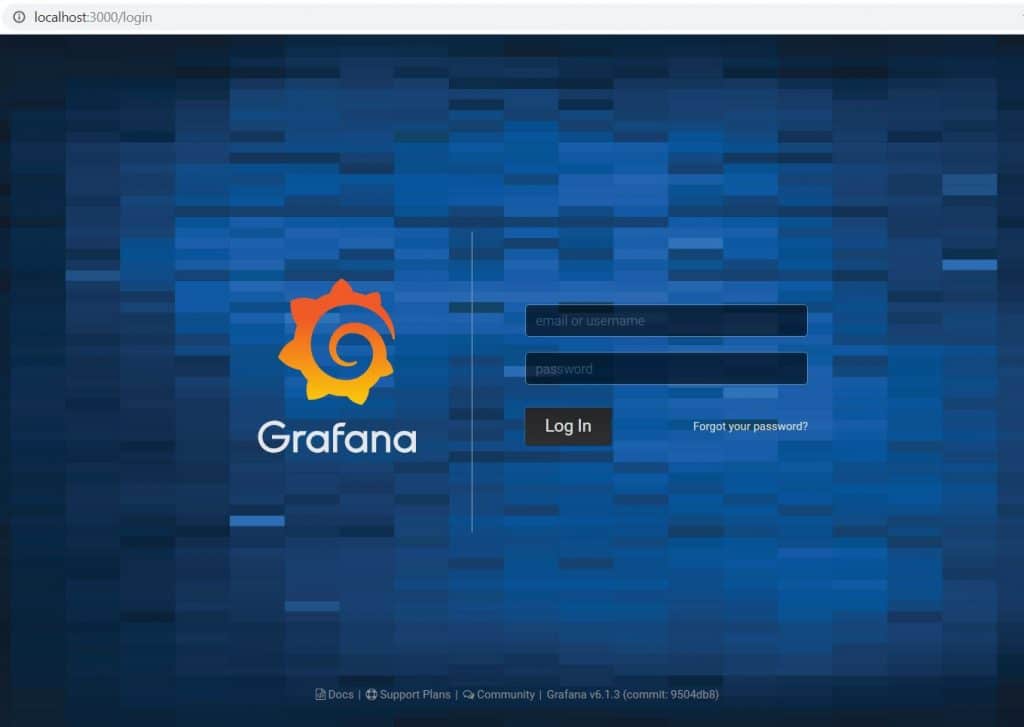
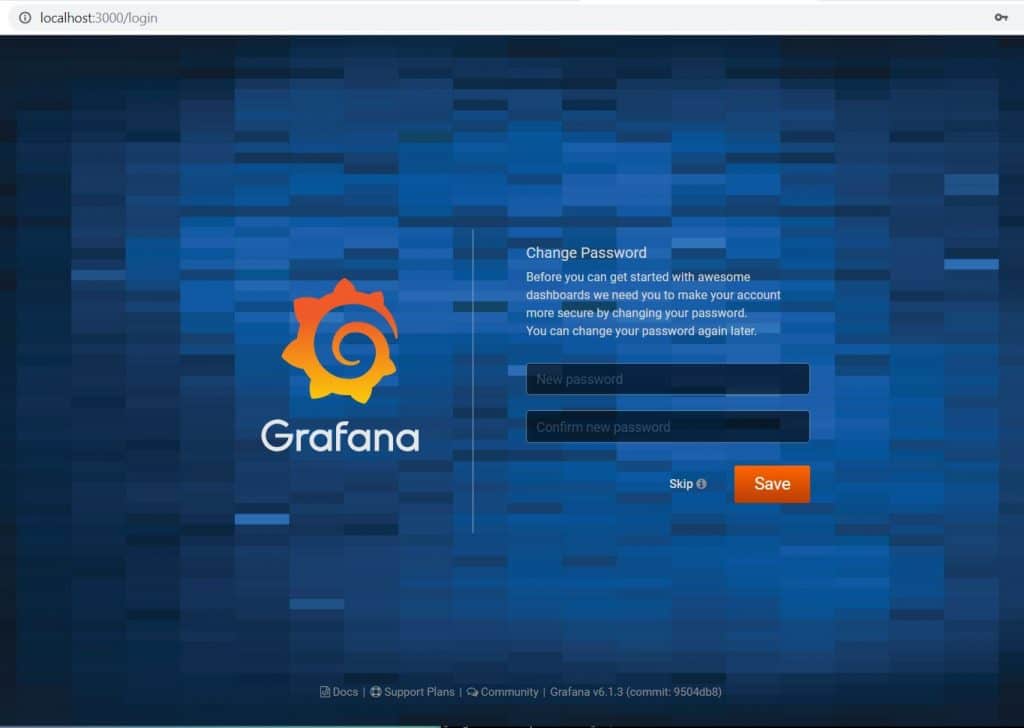
The change password first login as below
You have Installed Grafana on Centos 7. Thank you for reading the DevopsRoles page!

1 thought on “Install Grafana on Centos 7”