Managing multiple AWS accounts can quickly become a complex undertaking. Maintaining consistency, security, and compliance across a sprawling landscape of accounts requires robust automation and centralized governance. This article will demonstrate how to leverage Terraform and AWS Control Tower to efficiently manage and customize your AWS accounts, focusing on best practices for AWS Accounts Terraform deployments. We’ll cover everything from basic account creation to advanced configuration, providing you with the knowledge to streamline your multi-account AWS strategy.
Understanding the Need for Automated AWS Account Management
Manually creating and configuring AWS accounts is time-consuming, error-prone, and scales poorly. As your organization grows, so does the number of accounts needed for different environments (development, testing, production), teams, or projects. This decentralized approach leads to inconsistencies in security configurations, cost optimization strategies, and compliance adherence. Automating account provisioning and management with AWS Accounts Terraform offers several key advantages:
- Increased Efficiency: Automate repetitive tasks, saving time and resources.
- Improved Consistency: Ensure consistent configurations across all accounts.
- Enhanced Security: Implement standardized security policies and controls.
- Reduced Errors: Minimize human error through automation.
- Better Scalability: Easily manage a growing number of accounts.
Leveraging Terraform for AWS Account Management
Terraform is an Infrastructure-as-Code (IaC) tool that allows you to define and provision infrastructure resources in a declarative manner. Using Terraform for AWS Accounts Terraform management provides a powerful and repeatable way to create, configure, and manage your AWS accounts. Below is a basic example of a Terraform configuration to create an AWS account using the AWS Organizations API:
terraform {

  required_providers {

    aws = {

      source  = "hashicorp/aws"

      version = "~> 4.0"

    }

  }

}

provider "aws" {

  region = "us-west-2"

}

resource "aws_organizations_account" "example" {

  email          = "your_email@example.com"

  name           = "example-account"

}
This simple example creates a new account. However, for production environments, you’ll need more complex configurations to handle IAM roles, security groups, and other crucial components.
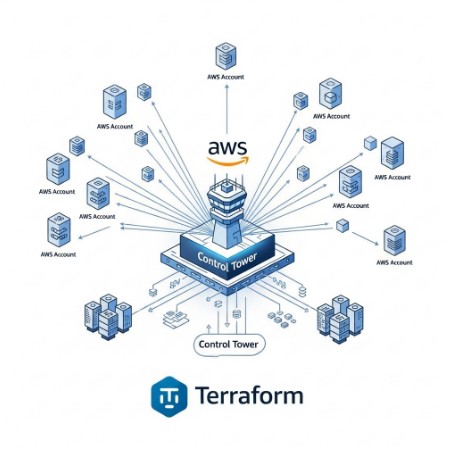
Integrating AWS Control Tower with Terraform
AWS Control Tower provides a centralized governance mechanism for managing multiple AWS accounts. Combining Terraform with Control Tower allows you to leverage the benefits of both: the automation of Terraform and the governance and security capabilities of Control Tower. Control Tower enables the creation of landing zones, which define the baseline configurations for new accounts.
Creating a Landing Zone with Control Tower
Before using Terraform to create accounts within a Control Tower-managed environment, you need to set up a landing zone. This involves configuring various AWS services like Organizations, IAM, and VPCs. Control Tower provides a guided process for this setup. This configuration ensures that each new account inherits consistent security policies and governance settings.
Provisioning Accounts with Terraform within a Control Tower Landing Zone
Once the landing zone is established, you can use Terraform to provision new accounts within that landing zone. This ensures that each new account adheres to the established governance and security standards. The exact Terraform configuration will depend on your specific landing zone settings. You might need to adjust the configuration to accommodate specific IAM roles, policies, and resource limits imposed by the landing zone.
Advanced AWS Accounts Terraform Configurations
Beyond basic account creation, Terraform can handle advanced configurations:
Customizing Account Settings
Terraform allows fine-grained control over various account settings, including:
- IAM Roles: Define custom IAM roles and policies for each account.
- Resource Limits: Set appropriate resource limits to control costs and prevent unexpected usage spikes.
- Security Groups: Configure security groups to manage network access within and between accounts.
- Service Control Policies (SCPs): Enforce granular control over allowed AWS services within the accounts.
Implementing Tagging Strategies
Consistent tagging across all AWS resources and accounts is crucial for cost allocation, resource management, and compliance. Terraform can automate the application of tags during account creation and resource provisioning. A well-defined tagging strategy will significantly improve your ability to manage and monitor your AWS infrastructure.
Integrating with Other AWS Services
Terraform’s flexibility allows you to integrate with other AWS services such as AWS Config, CloudTrail, and CloudWatch for monitoring and logging across your accounts. This comprehensive monitoring enhances security posture and operational visibility. For example, you can use Terraform to automate the setup of CloudWatch alarms to alert on critical events within your accounts.
Frequently Asked Questions
Q1: Can Terraform manage existing AWS accounts?
While Terraform excels at creating new accounts, it doesn’t directly manage existing ones. However, you can use Terraform to manage the resources *within* existing accounts, ensuring consistency across your infrastructure.
Q2: What are the security considerations when using Terraform for AWS Accounts Terraform?
Securely managing your Terraform configurations is paramount. Use appropriate IAM roles with least privilege access, store your Terraform state securely (e.g., in AWS S3 with encryption), and regularly review and update your configurations. Consider using Terraform Cloud or other remote backends to manage your state file securely.
Q3: How can I handle errors during account creation with Terraform?
Terraform provides robust error handling capabilities. You can use error checking mechanisms within your Terraform code, implement retry mechanisms, and leverage notification systems (like email or PagerDuty) to be alerted about failures during account provisioning.
Q4: How do I manage the cost of running this setup?
Careful planning and resource allocation are critical to managing costs. Using tagging strategies for cost allocation, setting resource limits, and regularly reviewing your AWS bills will help. Automated cost optimization tools can also aid in minimizing cloud spending.

Conclusion
Effectively managing multiple AWS accounts is a critical aspect of modern cloud infrastructure. By combining the power of Terraform and AWS Control Tower, you gain a robust, automated, and secure solution for provisioning, configuring, and managing your AWS accounts. Mastering AWS Accounts Terraform is key to building a scalable and reliable cloud architecture. Remember to always prioritize security best practices when working with infrastructure-as-code and ensure your configurations are regularly reviewed and updated.
For further reading and detailed documentation, refer to the official AWS documentation on Organizations and Control Tower, and the HashiCorp Terraform documentation. AWS Organizations Documentation AWS Control Tower Documentation Terraform AWS Provider Documentation. Thank you for reading the DevopsRoles page!