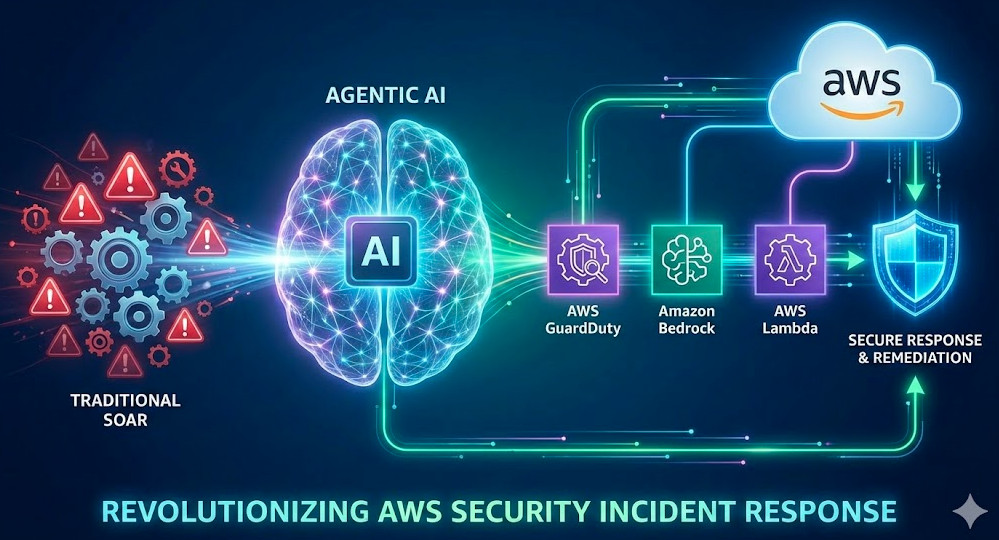
For years, the gold standard in cloud security has been defined by deterministic automation. We detect an anomaly in Amazon GuardDuty, trigger a CloudWatch Event (now EventBridge), and fire a Lambda function to execute a hard-coded remediation script. While effective for known threats, this approach is brittle. It lacks context, reasoning, and adaptability.
Enter Agentic AI. By integrating Large Language Models (LLMs) via services like Amazon Bedrock into your security stack, we are moving from static “Runbooks” to dynamic “Reasoning Engines.” AWS Security Incident Response is no longer just about automation; it is about autonomy. This guide explores how to architect Agentic workflows that can analyze forensics, reason through containment strategies, and execute remediation with human-level nuance at machine speed.
The Evolution: From SOAR to Agentic Security
Traditional Security Orchestration, Automation, and Response (SOAR) platforms rely on linear logic: If X, then Y. This works for blocking an IP address, but it fails when the threat requires investigation. For example, if an IAM role is exfiltrating data, a standard script might revoke keys immediately—potentially breaking production applications—whereas a human analyst would first check if the activity aligns with a scheduled maintenance window.
Agentic AI introduces the ReAct (Reasoning + Acting) pattern to AWS Security Incident Response. Instead of blindly firing scripts, the AI Agent:
Observes the finding (e.g., “S3 Bucket Public Access Enabled”).
Reasons about the context (Queries CloudTrail: “Who did this? Was it authorized?”).
Acts using defined tools (Calls boto3 functions to correct the policy).
Evaluates the result (Verifies the bucket is private).
GigaCode Pro-Tip:
Don’t confuse “Generative AI” with “Agentic AI.” Generative AI writes a report about the hack. Agentic AI logs into the console (via API) and fixes the hack. The differentiator is the Action Group.
Architecture: Building a Bedrock Security Agent
To modernize your AWS Security Incident Response, we leverage Amazon Bedrock Agents. This managed service orchestrates the interaction between the LLM (reasoning), the knowledge base (RAG for company policies), and the action groups (Lambda functions).
1. The Foundation: Knowledge Bases
Your agent needs context. Using Retrieval-Augmented Generation (RAG), you can index your internal Wiki, incident response playbooks, and architecture diagrams into an Amazon OpenSearch Serverless vector store connected to Bedrock. When a finding occurs, the agent first queries this base: “What is the protocol for a compromised EC2 instance in the Production VPC?”
2. Action Groups (The Hands)
Action groups map OpenAPI schemas to AWS Lambda functions. This allows the LLM to “call” Python code. Below is an example of a remediation tool that an agent might decide to use during an active incident.
Code Implementation: The Isolation Tool
This Lambda function serves as a “tool” that the Bedrock Agent can invoke when it decides an instance must be quarantined.
import boto3
import json
import logging

logger = logging.getLogger()
logger.setLevel(logging.INFO)

ec2 = boto3.client('ec2')

def lambda_handler(event, context):
    """
    Tool for Bedrock Agent: Isolates an EC2 instance by attaching a forensic SG.
    Input: {'instance_id': 'i-xxxx', 'vpc_id': 'vpc-xxxx'}
    """
    agent_params = event.get('parameters', [])
    instance_id = next((p['value'] for p in agent_params if p['name'] == 'instance_id'), None)

    if not instance_id:
        return {"response": "Error: Instance ID is required for isolation."}

    try:
        # Logic to find or create a 'Forensic-No-Ingress' Security Group
        logger.info(f"Agent requested isolation for {instance_id}")

        # 1. Get current SG for rollback context (Forensics)
        current_attr = ec2.describe_instance_attribute(
            InstanceId=instance_id, Attribute='groupSet'
        )

        # 2. Attach Isolation SG (Assuming sg-isolation-id is pre-provisioned)
        isolation_sg = "sg-0123456789abcdef0"

        ec2.modify_instance_attribute(
            InstanceId=instance_id,
            Groups=[isolation_sg]
        )

        return {
            "response": f"SUCCESS: Instance {instance_id} has been isolated. Previous SGs logged for analysis."
        }

    except Exception as e:
        logger.error(f"Failed to isolate: {str(e)}")
        return {"response": f"FAILED: Could not isolate instance. Reason: {str(e)}"}
Implementing the Workflow
Deploying this requires an Event-Driven Architecture. Here is the lifecycle of an Agentic AWS Security Incident Response:
Ingestion: EventBridge captures the finding and pushes it to an SQS queue (for throttling/buffering).
Invocation: A Lambda “Controller” picks up the finding and invokes the Bedrock Agent Alias using the invoke_agent API.
Reasoning Loop:
The Agent receives the finding details.
It checks the “Knowledge Base” and sees that Tor connections are strictly prohibited.
It decides to call the GetInstanceDetails tool to check tags.
It sees the tag Environment: Production.
It decides to call the IsolateInstance tool (code above).
Resolution: The Agent updates AWS Security Hub with the workflow status, marks the finding as RESOLVED, and emails the SOC team a summary of its actions.
Human-in-the-Loop (HITL) and Guardrails
For expert practitioners, the fear of “hallucinating” agents deleting production databases is real. To mitigate this in AWS Security Incident Response, we implement Guardrails for Amazon Bedrock.
Guardrails allow you to define denied topics and content filters. Furthermore, for high-impact actions (like terminating instances), you should design the Agent to request approval rather than execute immediately. The Agent can send an SNS notification with a standard “Approve/Deny” link. The Agent pauses execution until the approval signal is received via a callback webhook.
Pro-Tip: Use CloudTrail Lake to audit your Agents. Every API call made by the Agent (via the assumed IAM role) is logged. Create a QuickSight dashboard to visualize “Agent Remediation Success Rates” vs. “Human Intervention Required.”
Frequently Asked Questions (FAQ)
How does Agentic AI differ from AWS Lambda automation?
Lambda automation is deterministic (scripted steps). Agentic AI is probabilistic and reasoning-based. It can handle ambiguity, such as deciding not to act if a threat looks like a false positive based on cross-referencing logs, whereas a script would execute blindly.
Is it safe to let AI modify security groups automatically?
It is safe if scoped correctly using IAM Roles. The Agent’s role should adhere to the Principle of Least Privilege. Start with “Read-Only” agents that only perform forensics and suggest remediation, then graduate to “Active” agents for low-risk environments.
Which AWS services are required for this architecture?
At a minimum: Amazon Bedrock (Agents & Knowledge Bases), AWS Lambda (Action Groups), Amazon EventBridge (Triggers), Amazon GuardDuty (Detection), and AWS Security Hub (Centralized Management).
Conclusion
The landscape of AWS Security Incident Response is shifting. By adopting Agentic AI, organizations can reduce Mean Time to Respond (MTTR) from hours to seconds. However, this is not a “set and forget” solution. It requires rigorous engineering of prompts, action schemas, and IAM boundaries.
Start small: Build an agent that purely performs automated forensics—gathering logs, querying configurations, and summarizing the blast radius—before letting it touch your infrastructure. The future of cloud security is autonomous, and the architects who master these agents today will define the standards of tomorrow.
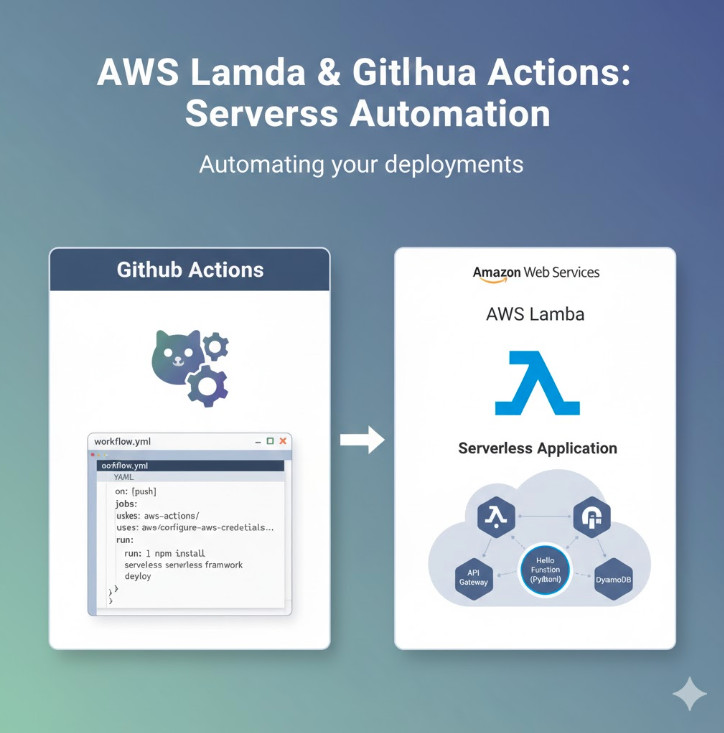
For years, the Swift-on-server community has relied on the excellent community-driven swift-server/swift-aws-lambda-runtime. Today, that hard work is officially recognized and accelerated: AWS has released an official Swift AWS Lambda Runtime, now available in AWSLabs. For expert AWS engineers, this move signals a significant new option for building high-performance, type-safe, and AOT-compiled serverless functions.
This isn’t just a “me-too” runtime. This new library is built from the ground up on SwiftNIO, providing a high-performance, non-blocking I/O foundation. In this guide, we’ll bypass the basics and dive straight into what experts need to know: how to build, deploy, and optimize Swift on Lambda.
From Community to AWSLabs: Why This Matters
The original community runtime, now stewarded by the Swift Server Work Group (SSWG), paved the way. The new AWSLabs/swift-aws-lambda-runtime builds on this legacy with a few key implications for expert users:
Official AWS Backing: While still in AWSLabs (experimental), this signals a clear path toward official support, deeper integration with AWS tools, and alignment with the official AWS SDK for Swift (preview).
Performance-First Design: Re-architecting on SwiftNIO ensures the runtime itself is a minimal, non-blocking layer, allowing your Swift code to execute with near-native performance.
Modern Swift Concurrency: The runtime is designed to integrate seamlessly with Swift’s modern structured concurrency (async/await), making asynchronous code clean and maintainable.
Architectural Note: The Runtime Interface Client (RIC)
Under the hood, this is a Custom Lambda Runtime. The swift-aws-lambda-runtime library is essentially a highly-optimized Runtime Interface Client (RIC). It implements the loop that polls the Lambda Runtime API (/2018-06-01/runtime/invocation/next), retrieves an event, passes it to your Swift handler, and POSTs the response back. Your executable, named bootstrap, is the entry point Lambda invokes.
Getting Started: Your First Swift AWS Lambda Runtime Function
We’ll skip the “Hello, World” and build a function that decodes a real event. The most robust way to build and deploy is using the AWS Serverless Application Model (SAM) with a container image, which gives you a reproducible build environment.
Prerequisites
Swift 5.7+
Docker
AWS SAM CLI
AWS CLI
1. Initialize Your Swift Package
Create a new executable package.
mkdir MySwiftLambda && cd MySwiftLambda
swift package init --type executable
2. Configure Package.swift Dependencies
Edit your Package.swift to include the new runtime and the event types library.
Replace the contents of Sources/main.swift. We’ll use modern async/await syntax to handle an API Gateway v2 HTTP request (HTTP API).
import AWSLambdaRuntime
import AWSLambdaEvents

@main
struct MyLambdaHandler: SimpleLambdaHandler {

    // This is the function that will be called for every invocation.
    // It's async, so we can perform non-blocking work.
    func handle(_ request: APIGateway.V2.Request, context: LambdaContext) async throws -> APIGateway.V2.Response {

        // Log to CloudWatch
        context.logger.info("Received request: \(request.rawPath)")

        // Example: Accessing path parameters
        let name = request.pathParameters?["name"] ?? "World"

        let responseBody = "Hello, \(name)!"

        // Return a valid APIGateway.V2.Response
        return APIGateway.V2.Response(
            statusCode: .ok,
            headers: ["Content-Type": "text/plain"],
            body: responseBody
        )
    }
}
Deployment Strategy: Container Image with SAM
While you *can* use the provided.al2 runtime by compiling and zipping a bootstrap executable, the container image flow is cleaner and more repeatable for Swift projects.
1. Create the Dockerfile
Create a Dockerfile in your root directory. We’ll use a multi-stage build to keep the final image minimal.
# --- 1. Build Stage ---
FROM swift:5.7-amazonlinux2 AS build

# Set up environment
RUN yum -y install libuuid-devel libicu-devel libedit-devel libxml2-devel sqlite-devel \
    libstdc++-static libatomic-static \
    && yum -y clean all

WORKDIR /build

# Copy and resolve dependencies
COPY Package.swift .
COPY Package.resolved .
RUN swift package resolve

# Copy full source and build
COPY . .
RUN swift build -c release --static-swift-stdlib

# --- 2. Final Lambda Runtime Stage ---
FROM amazon/aws-lambda-provided:al2

# Copy the built executable from the 'build' stage
# Lambda expects the executable to be named 'bootstrap'
COPY --from=build /build/.build/release/MySwiftLambda /var/runtime/bootstrap

# Set the Lambda entrypoint
ENTRYPOINT [ "/var/runtime/bootstrap" ]
2. Create the SAM Template
Create a template.yaml file.
AWSTemplateFormatVersion: '2010-09-09'
Transform: AWS::Serverless-2016-10-31
Description: >
  Sample SAM template for a Swift AWS Lambda Runtime function.

Globals:
  Function:
    Timeout: 10
    MemorySize: 256

Resources:
  MySwiftFunction:
    Type: AWS::Serverless::Function
    Properties:
      PackageType: Image
      Architectures:
        - x86_64 # or arm64 if you build on an M1/M2 Mac
      Events:
        HttpApiEvent:
          Type: HttpApi
          Properties:
            Path: /hello/{name}
            Method: GET
    Metadata:
      DockerTag: v1
      DockerContext: .
      Dockerfile: Dockerfile

Outputs:
  ApiEndpoint:
    Description: "API Gateway endpoint URL"
    Value: !Sub "https://${ServerlessHttpApi}.execute-api.${AWS::Region}.amazonaws.com/hello/GigaCode"
3. Build and Deploy
Now, run the standard SAM build and deploy process.
# Build the Docker image, guided by SAM
sam build

# Deploy the function to AWS
sam deploy --guided
After deployment, SAM will output the API endpoint. You can curl it (e.g., curl https://[api-id].execute-api.us-east-1.amazonaws.com/hello/SwiftDev) and get your response!
Performance & Cold Start Considerations
This is what you’re here for. How does it perform?
Cold Starts: Swift is an Ahead-of-Time (AOT) compiled language. Unlike Python or Node.js, there is no JIT or interpreter startup time. Its cold start performance profile is very similar to Go and Rust. You can expect cold starts in the sub-100ms range for simple functions, depending on VPC configuration.
Warm Invokes: Once warm, Swift is exceptionally fast. Because it’s compiled to native machine code, warm invocation times are typically single-digit milliseconds (1-5ms).
Memory Usage: Swift’s memory footprint is lean. With static linking and optimized release builds, simple functions can run comfortably in 128MB or 256MB of RAM.
Performance Insight: Static Linking
The --static-swift-stdlib flag in our Dockerfile build command is critical. It bundles the Swift standard library into your executable, creating a self-contained binary. This slightly increases the package size but significantly improves cold start time, as the Lambda environment doesn’t need to find and load shared .so libraries. It’s the recommended approach for production Lambda builds.
Frequently Asked Questions (FAQ)
How does the AWSLabs runtime differ from the swift-server community one?
The core difference is the foundation. The AWSLabs version is built on SwiftNIO 2 for its core I/O, aligning it with other modern Swift server frameworks. The community version (swift-server/swift-aws-lambda-runtime) is also excellent and stable but is built on a different internal stack. The AWSLabs version will likely see faster integration with new AWS services and SDKs.
What is the cold start performance of Swift on Lambda?
Excellent. As an AOT-compiled language, it avoids interpreter and JIT overhead. It is in the same class as Go and Rust, with typical P99 cold starts well under 200ms and P50 often under 100ms for simple functions.
Can I use async/await with the Swift AWS Lambda Runtime?
Yes, absolutely. It is the recommended way to use the runtime. The library provides both a LambdaHandler (closure-based) and a SimpleLambdaHandler (async/await-based) protocol. You should use the async/await patterns, as shown in the example, for clean, non-blocking asynchronous code.
How do I handle JSON serialization/deserialization?
Swift’s built-in Codable protocol is the standard. The swift-aws-lambda-events library provides all the Codable structs for common AWS events (API Gateway, SQS, S3, etc.). For your own custom JSON payloads, simply define your struct or class as Codable.
Conclusion
The arrival of an official Swift AWS Lambda Runtime in AWSLabs is a game-changing moment for the Swift-on-server ecosystem. For expert AWS users, it presents a compelling, high-performance, and type-safe alternative to Go, Rust, or TypeScript (Node.js).
By combining AOT compilation, a minimal memory footprint, and the power of SwiftNIO and structured concurrency, this new runtime is more than an experiment—it’s a production-ready path for building your most demanding serverless functions. Thank you for reading the DevopsRoles page!
If you’re an SRE, DevOps engineer, or cloud architect, you don’t just feel an AWS outage; you live it. Pagers scream, dashboards bleed red, and customer trust evaporates. The most recent massive outage, which brought down services from streaming platforms to financial systems, was not a simple hardware failure. It was a complex, cascading event born from the very dependencies that make the cloud powerful.
This isn’t another “the cloud is down” post. This is a technical root cause analysis (RCA) for expert practitioners. We’ll bypass the basics and dissect the specific automation and architectural flaws—focusing on the DynamoDB DNS failure in us-east-1—that triggered a system-wide collapse, and what we, as engineers, must learn from it.
Executive Summary: The TL;DR for SREs
The root cause of the October 2025 AWS outage was a DNS resolution failure for the DynamoDB API endpoint in the us-east-1 region. This was not a typical DNS issue, but a failure within AWS’s internal, automated DNS management system. This failure effectively made DynamoDB—a foundational “Layer 1” service—disappear from the network, causing a catastrophic cascading failure for all dependent services, including IAM, EC2, Lambda, and the AWS Management Console itself.
The key problem was a latent bug in an automation “Enactor” system responsible for updating DNS records. This bug, combined with a specific sequence of events (often called a “race condition”), resulted in an empty DNS record being propagated for dynamodb.us-east-1.amazonaws.com. Because countless other AWS services (and customer applications) are hard-wired with dependencies on DynamoDB in that specific region, the blast radius was immediate and global.
A Pattern of Fragility: The Legacy of US-EAST-1
To understand this outage, we must first understand us-east-1 (N. Virginia). It is AWS’s oldest, largest, and most critical region. It also hosts the global endpoints for foundational services like IAM. This unique status as “Region Zero” has made it the epicenter of AWS’s most significant historical failures.
Brief Post-Mortems of Past Failures
2017: The S3 “Typo” Outage
On February 28, 2017, a well-intentioned engineer executing a playbook to debug the S3 billing system made a typo in a command. Instead of removing a small subset of servers, the command triggered the removal of a massive number of servers supporting the S3 index and placement subsystems. Because these core subsystems had not been fully restarted in years, the recovery time was catastrophically slow, taking the internet’s “hard drive” offline for hours.
2020: The Kinesis “Thread Limit” Outage
On November 25, 2020, a “relatively small addition of capacity” to the Kinesis front-end fleet in us-east-1 triggered a long-latent bug. The fleet’s servers used an all-to-all communication mesh, with each server maintaining one OS thread per peer. The capacity addition pushed the servers over the maximum-allowed OS thread limit, causing the entire fleet to fail. This Kinesis failure cascaded to Cognito, CloudWatch, Lambda, and others, as they all feed data into Kinesis.
The pattern is clear: us-east-1 is a complex, aging system where small, routine actions can trigger non-linear, catastrophic failures due to undiscovered bugs and deep-rooted service dependencies.
Anatomy of the Latest AWS Outage: The DynamoDB DNS Failure
This latest AWS outage follows the classic pattern but with a new culprit: the internal DNS automation for DynamoDB.
The Initial Trigger: A Flaw in DNS Automation
According to AWS’s own (and admirably transparent) post-event summary, the failure originated in the automated system that manages DNS records for DynamoDB’s regional endpoint. This system, which we can call the “DNS Enactor,” is responsible for adding and removing IP addresses from the dynamodb.us-east-1.amazonaws.com record to manage load and health.
A latent defect in this automation, triggered by a specific, rare sequence of events, caused the Enactor to incorrectly remove all IP addresses associated with the DNS record. For any system attempting to resolve this_name, the answer was effectively “not found,” or an empty record. This is the digital equivalent of a building’s address being erased from every map in the world simultaneously.
The “Blast Radius” Explained: A Cascade of Dependencies
Why was this so catastrophic? Because AWS practices “dogfooding”—their own services run on their own infrastructure. This is usually a strength, but here it’s a critical vulnerability.
IAM (Identity and Access Management): The IAM service, even global operations, has a hard dependency on DynamoDB in us-east-1 for certain functions. When DynamoDB vanished, authentication and authorization requests began to fail.
EC2 Control Plane: Launching new instances or managing existing ones often requires metadata lookup and state management, which, you guessed it, leverages DynamoDB.
Lambda & API Gateway: These services heavily rely on DynamoDB for backend state, throttling rules, and metadata.
AWS Management Console: The console itself is an application that makes API calls to services like IAM (to see if you’re logged in) and EC2 (to list your instances). It was unusable because its own backend dependencies were failing.
This is a classic cascading failure. The failure of one “Layer 1” foundational service (DynamoDB) created a tidal wave that took down “Layer 2” and “Layer 3” services, which in turn took down customer applications.
Advanced Concept: The “Swiss Cheese Model” of Failure
This outage wasn’t caused by a single bug. It was a “Swiss Cheese” event, where multiple, independent layers of defense all failed in perfect alignment.
The Latent Bug: A flaw in the DNS Enactor automation (a hole in one slice).
The Trigger: A specific, rare sequence of operations (a second hole).
The Lack of Self-Repair: The system’s monitoring failed to detect or correct the “empty state” (a third hole).
The Architectural Dependency: The global reliance on us-east-1‘s DynamoDB endpoint (a fourth, massive hole).
When all four holes lined up, the disaster occurred.
Key Architectural Takeaways for Expert AWS Users
As engineers, we cannot prevent an AWS outage. We can only architect our systems to be resilient to them. Here are the key lessons.
Lesson 1: US-EAST-1 is a Single Point of Failure (Even for Global Services)
Treat us-east-1 as toxic. While it’s necessary for some global operations (like creating IAM roles or managing Route 53 zones), your runtime application traffic should have no hard dependencies on it. Avoid using the us-east-1 region for your primary workloads if you can. If you must use it, you must have an active-active or active-passive failover plan.
Lesson 2: Implement Cross-Region DNS Failover (and Test It)
The single best defense against this specific outage is a multi-region architecture with automated DNS failover using Amazon Route 53. Do not rely on a single regional endpoint. Use Route 53’s health checks to monitor your application’s endpoint in each region. If one region fails (like us-east-1), Route 53 can automatically stop routing traffic to it.
Here is a basic, production-ready example of a “Failover” routing policy in a Terraform configuration. This setup routes primary traffic to us-east-1 but automatically fails over to us-west-2 if the primary health check fails.
# 1. Define the health check for the primary (us-east-1) endpoint
resource "aws_route53_health_check" "primary_endpoint_health" {
  fqdn              = "myapp.us-east-1.example.com"
  port              = 443
  type              = "HTTPS"
  resource_path     = "/health"
  failure_threshold = 3
  request_interval  = 30

  tags = {
    Name = "primary-app-health-check"
  }
}

# 2. Define the "A" record for our main application
resource "aws_route53_record" "primary" {
  zone_id = aws_route53_zone.primary.zone_id
  name    = "app.example.com"
  type    = "A"

  # This record is for the PRIMARY (us-east-1) endpoint
  set_identifier = "primary-us-east-1"

  # Use Failover routing
  failover_routing_policy {
    type = "PRIMARY"
  }

  # Link to the health check
  health_check_id = aws_route53_health_check.primary_endpoint_health.id

  # Alias to the us-east-1 Load Balancer
  alias {
    name                   = aws_lb.primary.dns_name
    zone_id                = aws_lb.primary.zone_id
    evaluate_target_health = true
  }
}

resource "aws_route53_record" "secondary" {
  zone_id = aws_route53_zone.primary.zone_id
  name    = "app.example.com"
  type    = "A"

  # This record is for the SECONDARY (us-west-2) endpoint
  set_identifier = "secondary-us-west-2"

  # Use Failover routing
  failover_routing_policy {
    type = "SECONDARY"
  }

  # Alias to the us-west-2 Load Balancer
  # Note: No health check is needed for a SECONDARY record.
  # If the PRIMARY fails, traffic routes here.
  alias {
    name                   = aws_lb.secondary.dns_name
    zone_id                = aws_lb.secondary.zone_id
    evaluate_target_health = false
  }
}
Lesson 3: The Myth of “Five Nines” and Preparing for Correlated Failures
The “five nines” (99.999% uptime) SLA applies to a *single service*, not the complex, interconnected system you’ve built. As these outages demonstrate, failures are often *correlated*. A Kinesis outage takes down Cognito. A DynamoDB outage takes down IAM. Your resilience planning must assume that multiple, seemingly independent services will fail at the same time.
Frequently Asked Questions (FAQ)
What was the root cause of the most recent massive AWS outage?
The technical root cause was a failure in an internal, automated DNS management system for the DynamoDB service in the us-east-1 region. A bug caused this system to publish an empty DNS record, making the DynamoDB API endpoint unreachable and triggering a cascading failure across dependent services.
Why does US-EAST-1 cause so many AWS outages?
us-east-1 (N. Virginia) is AWS’s oldest, largest, and most complex region. It also uniquely hosts the control planes and endpoints for some of AWS’s global services, like IAM. Its age and central importance create a unique “blast radius,” where small failures can have an outsized, and sometimes global, impact.
What AWS services were affected by the DynamoDB outage?
The list is extensive, but key affected services included IAM, EC2 (control plane), Lambda, API Gateway, AWS Management Console, CloudWatch, and Cognito, among many others. Any service or customer application that relied on DynamoDB in us-east-1 for its operation was impacted.
How can I protect my application from an AWS outage?
You cannot prevent a provider-level outage, but you can build resilience. The primary strategy is a multi-region architecture. At a minimum, deploy your application to at least two different AWS regions (e.g., us-east-1 and us-west-2) and use Amazon Route 53 with health checks to automate DNS failover between them. Also, architect for graceful degradation—your app should still function (perhaps in a read-only mode) even if a backend dependency fails.
Conclusion: Building Resiliently in an Unreliable World
The recent massive AWS outage is not an indictment of cloud computing; it’s a doctorate-level lesson in distributed systems failure. It reinforces that “the cloud” is not a magical utility—it is a complex, interdependent machine built by humans, with automation layered on top of automation.
As expert practitioners, we must internalize the lessons from the S3 typo, the Kinesis thread limit, and now the DynamoDB DNS failure. We must abandon our implicit trust in any single region, especially us-east-1. The ultimate responsibility for resilience does not lie with AWS; it lies with us, the architects, to design systems that anticipate, and survive, the inevitable failure.
For further reading and official RCAs, we highly recommend bookmarking the AWS Post-Event Summaries page. It is an invaluable resource for understanding how these complex systems fail. Thank you for reading the DevopsRoles page!
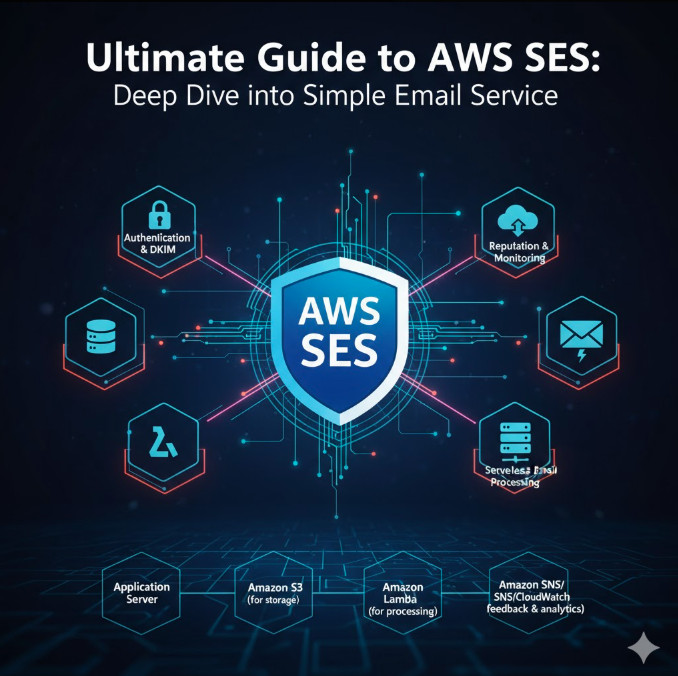
For expert AWS practitioners, email is often treated as a critical, high-risk piece of infrastructure. It’s not just about sending notifications; it’s about deliverability, reputation, authentication, and large-scale event handling. While many services offer a simple “send” API, AWS SES (Simple Email Service) provides a powerful, unmanaged, and highly scalable *email platform* that integrates directly into your cloud architecture. If you’re managing applications on AWS, using SES is a high-leverage decision for cost, integration, and control.
This deep dive assumes you’re comfortable with AWS, IAM, and DNS. We’ll skip the basics and jump straight into the architecture, production-level configurations, and advanced features you need to master AWS SES.
At its core, SES is a decoupled sending and receiving engine. As an expert, the two most important architectural decisions you’ll make upfront concern IP addressing and your sending limits.
Shared IP Pools vs. Dedicated IPs
By default, your account sends from a massive pool of IP addresses shared with other AWS SES customers.
Shared IPs (Default):
Pros: No extra cost. AWS actively monitors and manages the pool’s reputation, removing bad actors. For most workloads with good sending habits, this is a “warmed-up” and reliable option.
Cons: You are susceptible to “noisy neighbors.” A sudden spike in spam from another tenant in your shared pool *could* temporarily affect your deliverability, though AWS is very good at mitigating this.
Dedicated IPs (Add-on):
Pros: Your sending reputation is 100% your own. You have full control and are not impacted by others. This is essential for high-volume senders who need predictable deliverability.
Cons: You *must* warm them up yourself. Sending 1 million emails on day one from a “cold” IP will get you blacklisted instantly. This requires a gradual ramp-up strategy over several weeks. It also has an additional monthly cost.
Expert Pro-Tip: Don’t buy dedicated IPs unless you are a high-volume sender (e.g., 500k+ emails/day) and have an explicit warm-up strategy. For most corporate and transactional mail, the default shared pool is superior because it’s already warm and managed by AWS.
Understanding Sending Quotas & Reputation
Every new AWS SES account starts in the **sandbox**. This is a highly restricted environment designed to prevent spam. While in the sandbox, you can *only* send email to verified identities (domains or email addresses you own).
To leave the sandbox, you must open a support ticket requesting production access. You will need to explain your use case, how you manage bounces and complaints, and how you obtained your email list (e.g., “All emails are transactional for users who sign up on our platform”).
Once you’re in production, your account has two key limits:
Sending Quota: The maximum number of emails you can send in a 24-hour period.
Sending Rate: The maximum number of emails you can send per second.
These limits increase automatically *as long as you maintain a low bounce rate and a near-zero complaint rate*. Your sender reputation is the single most valuable asset you have in email. Protect it.
Production-Ready Setup: Identity & Authentication
Before you can send a single email, you must prove you own the “From” address. You do this by verifying an identity, which can be a single email address or (preferably) an entire domain.
Domain Verification
Verifying a domain allows you to send from *any* address at that domain (e.g., noreply@example.com, support@example.com). This is the standard for production systems. SES gives you two verification methods: DKIM (default) or a TXT record.
You can do this via the console, but using the AWS CLI is faster and more scriptable:
# Request verification for your domain
$ aws ses verify-domain-identity --domain example.com

# This will return a VerificationToken
# {
#    "VerificationToken": "abc123xyz789..."
# }

# You must add this token as a TXT record to your DNS
# Record: _amazonses.example.com
# Type:   TXT
# Value:  "abc123xyz789..."
Once AWS detects this DNS record (which can take minutes to hours), your domain identity will move to a “verified” state.
Mastering Email Authentication: SPF, DKIM, and DMARC
This is non-negotiable for production sending. Mail servers use these three standards to verify that you are who you say you are. Failing to implement them guarantees your mail will land in spam.
SPF (Sender Policy Framework): A DNS TXT record that lists which IP addresses are allowed to send email on behalf of your domain. When you use SES, you simply add include:amazonses.com to your existing SPF record.
DKIM (DomainKeys Identified Mail): This is the most important. DKIM adds a cryptographic signature to your email headers. SES manages the private key and signs your outgoing mail. You just need to add the public key (provided by SES) as a CNAME record in your DNS. This is what the “Easy DKIM” setup in SES configures for you.
DMARC (Domain-based Message Authentication, Reporting & Conformance): DMARC tells receiving mail servers *what to do* with emails that fail SPF or DKIM. It’s a DNS TXT record that enforces your policy (e.g., p=quarantine or p=reject) and provides an address for servers to send you reports on failures. For a deep dive, check out the official DMARC overview.
Sending Email at Scale: API vs. SMTP
AWS SES provides two distinct endpoints for sending mail, each suiting different architectures.
Method 1: The SMTP Interface
SES provides a standard SMTP endpoint (e.g., email-smtp.us-east-1.amazonaws.com). This is the “legacy” or “compatibility” option.
Use Case: Integrating with existing applications, third-party software (like Jenkins, GitLab), or older codebases that are hard-coded to use SMTP.
Authentication: You generate SMTP credentials (a username and password) from the SES console. These are *not* your standard AWS access keys. You should create a dedicated IAM user with a policy that *only* allows ses:SendRawEmail and then derive the SMTP credentials from that user.
Method 2: The SendEmail & SendRawEmail APIs
This is the modern, cloud-native way to send email. You use the AWS SDK (e.g., Boto3 for Python, AWS SDK for Go) or the AWS CLI, authenticating via standard IAM roles or keys.
You have two primary API calls:
SendEmail: A simple, structured API. You provide the From, To, Subject, and Body (Text and HTML). It’s easy to use but limited.
SendRawEmail: The expert’s choice. This API accepts a single blob: the raw, MIME-formatted email message. You are responsible for building the entire email, including headers, parts (text and HTML), and attachments.
Expert Pro-Tip: Always use SendRawEmail in production. While SendEmail is fine for a quick test, SendRawEmail is the only way to send attachments, add custom headers (like List-Unsubscribe), or create complex multipart MIME messages. Most mature email-sending libraries will build this raw message for you.
Example: Sending with SendRawEmail using Boto3 (Python)
This example demonstrates the power of SendRawEmail by using Python’s email library to construct a multipart message (with both HTML and plain-text versions) and then sending it via Boto3.
import boto3
from email.mime.multipart import MIMEMultipart
from email.mime.text import MIMEText

# Create the SES client
ses_client = boto3.client('ses', region_name='us-east-1')

# Create the root message and set headers
msg = MIMEMultipart('alternative')
msg['Subject'] = "Production-Ready Email Example"
msg['From'] = "Sender Name <sender@example.com>"
msg['To'] = "recipient@example.com"

# Define the plain-text and HTML versions
text_part = "Hello, this is the plain-text version of the email."
html_part = """
<html>
<head></head>
<body>
  <h1>Hello!</h1>
  <p>This is the <b>HTML</b> version of the email.</p>
</body>
</html>
"""

# Attach parts to the message
msg.attach(MIMEText(text_part, 'plain'))
msg.attach(MIMEText(html_part, 'html'))

try:
    # Send the email
    response = ses_client.send_raw_email(
        Source=msg['From'],
        Destinations=[msg['To']],
        RawMessage={'Data': msg.as_string()}
    )
    print(f"Email sent! Message ID: {response['MessageId']}")

except Exception as e:
    print(f"Error sending email: {e}")
Reputation Management: The Most Critical Component
Sending the email is easy. Ensuring it doesn’t get blacklisted is hard. This is where Configuration Sets come in. You should *never* send a production email without one.
Configuration Sets: Your Control Panel
A Configuration Set is a ruleset you apply to your outgoing emails (by adding a custom header or specifying it in the API call). Its primary purpose is to define **Event Destinations**.
Handling Bounces & Complaints (The Feedback Loop)
When an email bounces (hard bounce, e.g., address doesn’t exist) or a user clicks “This is Spam” (a complaint), the receiving server sends a notification back. AWS SES processes this feedback loop. If you ignore it and keep sending to bad addresses, your reputation will plummet, and AWS will throttle or even suspend your sending privileges.
Setting Up Event Destinations
An Event Destination is where SES publishes detailed events about your email’s lifecycle: sends, deliveries, bounces, complaints, opens, and clicks.
You have three main options for destinations:
Amazon SNS: The most common choice. Send all bounce and complaint notifications to an SNS topic. Subscribe an SQS queue or an AWS Lambda function to this topic. Your Lambda function should then parse the message and update your application’s database (e.g., mark the user as unsubscribed or email_invalid). This creates a critical, automated feedback loop.
Amazon CloudWatch: Useful for aggregating metrics and setting alarms. For example, “Alert SRE team if the bounce rate exceeds 5% in any 10-minute window.”
Amazon Kinesis Firehose: The high-throughput, SRE choice. This allows you to stream *all* email events (including deliveries and opens) to a destination like S3 (for long-term analysis), Redshift, or OpenSearch. This is how you build a comprehensive analytics dashboard for your email program.
SES isn’t just for sending. It’s also a powerful, serverless email *receiving* endpoint. Instead of running your own postfix or Exchange server, you can configure SES to catch all mail for your domain (or specific addresses).
How it Works: The Architecture
You create a “Receipt Rule” that defines a set of actions to take when an email is received. The typical flow is:
Email arrives at SES (e.g., inbound-support@example.com).
SES scans it for spam and viruses (and rejects it if it fails).
The Receipt Rule is triggered.
The rule specifies an action, such as:
Save to S3 Bucket: Dumps the raw email (.eml file) into an S3 bucket.
Trigger Lambda Function: Invokes a Lambda function, passing the email content as an event.
Publish to SNS Topic: Sends a notification to SNS.
Example Use Case: Automated Inbound Processing
A common pattern is SES -> S3 -> Lambda.
SES receives an email (e.g., an invoice from a vendor).
The Receipt Rule saves the raw .eml file to an S3 bucket (s3://my-inbound-emails/).
The S3 bucket has an event notification configured to trigger a Lambda function on s3:ObjectCreated:*.
The Lambda function retrieves the .eml file, parses it (using a MIME-parsing library), extracts the PDF attachment, and saves it to a separate “invoices” bucket for processing.
This serverless architecture is infinitely scalable, highly resilient, and extremely cost-effective. You’ve just built a complex mail-processing engine with no servers to manage.
AWS SES vs. The Competition (SendGrid, Mailgun)
As an expert, you’re always evaluating trade-offs. Here’s the high-level breakdown:
| Feature | AWS SES | SendGrid / Mailgun / Postmark |
| :— | :— | :— |
| **Model** | Unmanaged Infrastructure | Managed Service |
| **Cost** | **Extremely Low.** Pay-per-email. | Higher. Tiered plans based on volume. |
| **Integration** | **Deepest (AWS).** Native IAM, SNS, S3, Lambda. | Excellent. Strong APIs, but external to your VPC. |
| **Features** | A-la-carte. You build your own analytics, template management, etc. | **All-in-one.** Includes template builders, analytics dashboards, and deliverability support. |
| **Support** | AWS Support. You are the expert. | Specialized email deliverability support. They will help you warm up IPs. |
The Verdict: If you are already deep in the AWS ecosystem and have the SRE/DevOps talent to build your own reputation monitoring and analytics (using CloudWatch/Kinesis), AWS SES is almost always the right choice for cost and integration. If you are a marketing-led team with no developer support, a managed service like SendGrid is a better fit.
Frequently Asked Questions (FAQ)
How do I get out of the AWS SES sandbox?
You must open a service limit increase ticket with AWS Support. In the ticket, clearly explain your use case (e.g., transactional emails for app signups), how you will manage your lists (e.g., immediate removal of bounces/complaints via SNS), and confirm that you are not sending unsolicited mail. A clear, well-written request is usually approved within 24 hours.
What’s the difference between SendEmail and SendRawEmail?
SendEmail is a simple, high-level API for basic text or HTML emails. SendRawEmail is a low-level API that requires you to build the full, MIME-compliant raw email message. You *must* use SendRawEmail if you want to add attachments, use custom headers, or send complex multipart messages.
How does AWS SES pricing work?
It’s incredibly cheap. You are charged per 1,000 emails sent and per GB of data (for attachments). If you are sending from an EC2 instance in the same region, the first 62,000 emails sent per month are often free (as part of the AWS Free Tier, but check current pricing). This makes it one of the most cost-effective solutions on the market.
Can I use AWS SES for marketing emails?
Yes, but you must be extremely careful. SES is optimized for transactional mail. You can use it for bulk marketing, but you are 100% responsible for list management, unsubscribes (must be one-click), and reputation. If your complaint rate spikes, AWS will shut you down. For large-scale marketing, AWS offers Amazon Pinpoint, which is built on top of SES but adds campaign management and analytics features.
Conclusion
AWS SES is not a “set it and forget it” email provider. It’s a powerful, low-level infrastructure component that gives you ultimate control, scalability, and cost-efficiency. For expert AWS users, it’s the clear choice for building robust, integrated applications.
By mastering its core components—identity authentication (DKIM/DMARC), reputation management (Configuration Sets and Event Destinations), and the choice between SMTP and API sending—you can build a world-class email architecture that is both resilient and remarkably inexpensive. The real power of AWS SES is unlocked when you stop treating it as a mail server and start treating it as a serverless event source for your S3, Lambda, and Kinesis-based applications. Thank you for reading the DevopsRoles page!
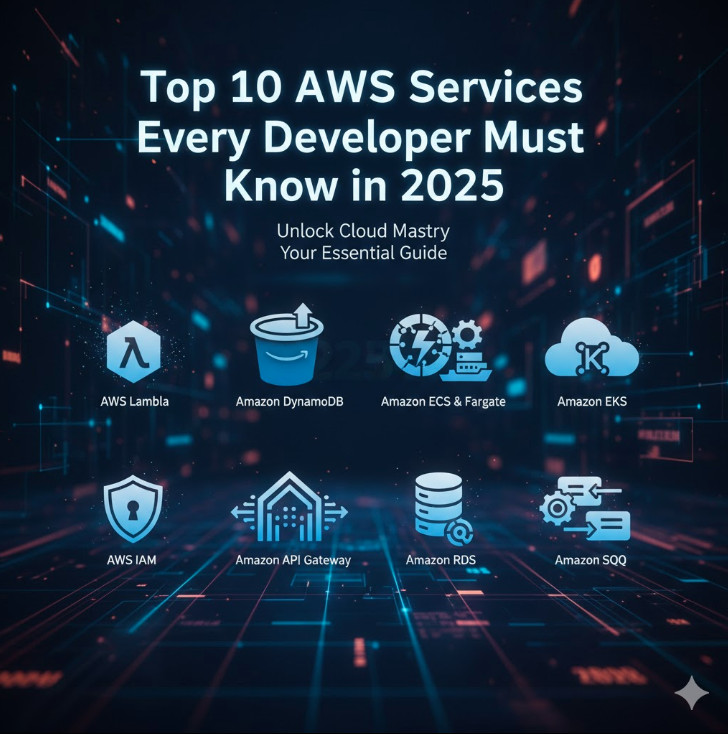
In 2025, navigating the cloud landscape is no longer an optional skill for a developer—it’s a core competency. Amazon Web Services (AWS) continues to dominate the market, with the 2024 Stack Overflow Developer Survey reporting that over 52% of professional developers use AWS. But with a portfolio of over 200 products, “learning AWS” can feel like an impossible task. The key isn’t to know every service, but to deeply understand the *right* ones. This guide focuses on the top 10 essential AWS Services that provide the most value to developers, enabling you to build, deploy, and scale modern applications efficiently.
Whether you’re building serverless microservices, container-based applications, or sophisticated AI-driven platforms, mastering this curated list will be a significant differentiator in your career. We’ll move beyond the simple definitions to explore *why* each service is critical for a developer’s workflow and how they interconnect to form the backbone of a robust, cloud-native stack.
Why Mastering AWS Services is Non-Negotiable for Developers in 2025
The “DevOps” movement has fully matured, and the lines between writing code and managing the infrastructure it runs on have blurred. Modern developers are increasingly responsible for the entire application lifecycle—a concept known as “you build it, you run it.” Understanding core AWS services is the key to fulfilling this responsibility effectively.
Here’s why this knowledge is crucial:
Architectural Fluency: You can’t write efficient, cloud-native code if you don’t understand the components you’re writing for. Knowing when to use a Lambda function versus a Fargate container, or DynamoDB versus RDS, is an architectural decision that begins at the code level.
Performance & Cost Optimization: A developer who understands AWS services can write code that leverages them optimally. This means building applications that are not only fast and scalable (e.g., using SQS to decouple services) but also cost-effective (e.g., choosing the right S3 storage tier or Lambda provisioned concurrency).
Reduced Dependencies: When you can provision your own database with RDS or define your own security rules in IAM, you reduce friction and dependency on a separate operations team. This leads to faster development cycles and more autonomous, agile teams.
Career Advancement: Proficiency in AWS is one of the most in-demand skills in tech. It opens doors to senior roles, DevOps and SRE positions, and higher-paying contracts. The AWS Certified Developer – Associate certification is a testament to this, validating that you can develop, deploy, and debug applications on the platform.
In short, the
platform is no longer just “where the app is deployed.” It is an integral part of the application itself. The services listed below are your new standard library.
The Top 10 AWS Services for Developers
This list is curated for a developer’s perspective, prioritizing compute, storage, data, and the “glue” services that connect everything. We’ll focus on services that you will interact with directly from your code or your CI/CD pipeline.
1. AWS Lambda
What it is: A serverless, event-driven compute service. Lambda lets you run code without provisioning or managing servers. You simply upload your code as a “function,” and AWS handles all the scaling, patching, and high availability.
Why it matters for Developers: Lambda is the heart of serverless architecture. As a developer, your focus shifts entirely to writing business logic. You don’t care about the underlying OS, runtime, or scaling. Your function can be triggered by dozens of other AWS services, such as an HTTP request from API Gateway, a file upload to S3, or a message in an SQS queue. This event-driven model is powerful for building decoupled microservices. You only pay for the compute time you consume, down to the millisecond, making it incredibly cost-effective for spiky or low-traffic workloads.
Practical Example (Python): A simple Lambda function that triggers when a new image is uploaded to an S3 bucket.
import json
import boto3

s3 = boto3.client('s3')

def lambda_handler(event, context):
    # 1. Get the bucket and key from the event
    bucket = event['Records'][0]['s3']['bucket']['name']
    key = event['Records'][0]['s3']['object']['key']

    print(f"New file {key} was uploaded to {bucket}.")

    # Example: Add a tag to the new object
    s3.put_object_tagging(
        Bucket=bucket,
        Key=key,
        Tagging={
            'TagSet': [
                {
                    'Key': 'processed',
                    'Value': 'false'
                },
            ]
        }
    )

    return {
        'statusCode': 200,
        'body': json.dumps('Tag added successfully!')
    }
2. Amazon S3 (Simple Storage Service)
What it is: A highly durable, scalable, and secure object storage service. Think of it as a limitless hard drive in the cloud, but with an API.
Why it matters for Developers: S3 is far more than just “storage.” It’s a foundational service that nearly every application touches. For developers, S3 is the go-to solution for:
Storing User Uploads: Images, videos, documents, etc.
Static Website Hosting: You can host an entire single-page application (SPA) like a React or Vue app directly from an S3 bucket.
Data Lakes: The primary repository for raw data used in analytics and machine learning.
Logs and Backups: A durable, low-cost target for application logs and database backups.
Your code will interact with S3 daily, using AWS SDKs to upload (PutObject) and retrieve (GetObject) files securely.
Practical Example (AWS CLI): Copying your application’s built static assets to an S3 bucket configured for website hosting.
# Build your React app
npm run build

# Sync the build directory to your S3 bucket
# The --delete flag removes old files
aws s3 sync build/ s3://my-static-website-bucket --delete
3. Amazon DynamoDB
What it is: A fully managed, serverless NoSQL key-value and document database. It’s designed for single-digit millisecond performance at any scale.
Why it matters for Developers: DynamoDB is the default database for serverless applications. Because it’s fully managed, you never worry about patching, scaling, or replication. Its key-value nature makes it incredibly fast for “hot” data access, such as user profiles, session states, shopping carts, and gaming leaderboards. For a developer, the primary challenge (and power) is in data modeling. Instead of complex joins, you design your tables around your application’s specific access patterns, which forces you to think about *how* your app will be used upfront. It pairs perfectly with Lambda, as a Lambda function can read or write to DynamoDB with extremely low latency.
What it is: ECS is a highly scalable, high-performance container orchestration service. It manages your Docker containers. Fargate is a “serverless” compute engine for containers that removes the need to manage the underlying EC2 instances (virtual servers).
Why it matters for Developers: Containers are the standard for packaging and deploying applications. ECS with Fargate gives developers the power of containers without the operational overhead of managing servers. You define your application in a Dockerfile, create a “Task Definition” (a JSON blueprint), and tell Fargate to run it. Fargate finds the compute, deploys your container, and handles scaling automatically. This is the ideal path for migrating a traditional monolithic application (e.g., a Node.js Express server or a Java Spring Boot app) to the cloud, or for running long-lived microservices that don’t fit the short-lived, event-driven model of Lambda.
Practical Example (ECS Task Definition Snippet): A simple definition for a web server container.
What it is: A fully managed Kubernetes service. Kubernetes (K8s) is the open-source industry standard for container orchestration, and EKS provides a managed, secure, and highly available K8s control plane.
Why it matters for Developers: If your company or team has standardized on Kubernetes, EKS is how you run it on AWS. While ECS is a simpler, AWS-native option, EKS provides the full, unadulterated Kubernetes API. This is crucial for portability (avoiding vendor lock-in) and for leveraging the massive open-source K8s ecosystem (tools like Helm, Prometheus, and Istio). As a developer, you’ll interact with the cluster using kubectl just as you would any other K8s cluster, but without the nightmare of managing the control plane (etcd, API server, etc.) yourself.
6. AWS IAM (Identity and Access Management)
What it is: The security backbone of AWS. IAM manages “who can do what.” It controls access to all AWS services and resources using users, groups, roles, and policies.
Why it matters for Developers: This is arguably the most critical service for a developer to understand. You *will* write insecure code if you don’t grasp IAM. The golden rule is “least privilege.” Your Lambda function doesn’t need admin access; it needs an IAM Role that gives it *only* the dynamodb:PutItem permission for a *specific* table. As a developer, you will constantly be defining these roles and policies to securely connect your services. Using IAM roles (instead of hard-coding secret keys in your app) is the non-negotiable best practice for application security on AWS.
Practical Example (IAM Policy): A policy for a Lambda function that only allows it to write to a specific DynamoDB table.
What it is: A fully managed service for creating, publishing, maintaining, and securing APIs at any scale. It acts as the “front door” for your application’s backend logic.
Why it matters for Developers: API Gateway is the bridge between the outside world (e.g., a mobile app or a web front end) and your backend compute (e.g., Lambda, ECS, or even an EC2 instance). As a developer, you use it to define your RESTful or WebSocket APIs. It handles all the undifferentiated heavy lifting: request/response transformation, throttling to prevent abuse, caching, authentication (e.g., with AWS Cognito or IAM), and monitoring. You can create a full, production-ready, serverless API by simply mapping API Gateway endpoints to Lambda functions.
8. Amazon RDS (Relational Database Service)
What it is: A managed service for relational databases. It supports popular engines like PostgreSQL, MySQL, MariaDB, SQL Server, and Oracle.
Why it matters for Developers: While DynamoDB is great for many use cases, sometimes you just need a SQL database. You might be migrating a legacy application, or your data has complex relationships and requires transactional integrity (ACID compliance). RDS gives you a SQL database without forcing you to become a Database Administrator (DBA). It automates provisioning, patching, backups, and high-availability (multi-AZ) failover. As a developer, you get a simple connection string, and you can use your favorite SQL dialect and ORM (e.g., SQLAlchemy, TypeORM, Prisma) just as you would with any other database.
9. AWS CodePipeline / CodeCommit / CodeBuild
What it is: This is a suite of fully managed CI/CD (Continuous Integration / Continuous Deployment) services.
CodeCommit: A private, managed Git repository.
CodeBuild: A managed build service that compiles your code, runs tests, and produces artifacts (like a Docker image).
CodePipeline: The “orchestrator” that defines your release process (e.g., “On push to main, run CodeBuild, then deploy to ECS”).
Why it matters for Developers: “You build it, you run it” also means “you deploy it.” As a developer, you are responsible for automating your path to production. While many companies use third-party tools like Jenkins or GitLab CI, the AWS CodeSuite provides a deeply integrated, serverless way to build and deploy your applications *natively* on AWS. You can configure a pipeline that automatically builds and deploys your Lambda function, Fargate container, or even your S3 static site on every single commit, allowing for true continuous delivery.
10. Amazon SQS (Simple Queue Service)
What it is: A fully managed message queuing service. It’s one of the oldest and most reliable AWS services.
Why it matters for Developers: SQS is the essential “glue” for building decoupled, resilient, and asynchronous microservices. Instead of one service calling another directly via an API (a synchronous call that can fail), the first service (the “producer”) sends a “job” as a message to an SQS queue. A second service (the “consumer”) then polls the queue, pulls off a message, and processes it at its own pace.
This pattern is incredibly powerful. If the consumer service crashes, the message stays safely in the queue and can be re-processed later (this is called “fault tolerance”). If the producer service sends 10,000 messages at once, the queue absorbs the spike, and the consumer can work through them steadily (this is called “smoothing” or “load leveling”). As a developer, SQS is your primary tool for moving from a fragile monolith to a robust, event-driven architecture.
Beyond the Top 10: Honorable Mentions
Once you have a handle on the services above, these are the next logical ones to explore to round out your AWS for developers toolkit:
AWS CDK (Cloud Development Kit): Stop clicking in the console. The CDK lets you define your entire infrastructure (VPCs, databases, Lambda functions, everything) in a real programming language like TypeScript, Python, or Go. This is the modern face of Infrastructure as Code (IaC).
Details
Amazon CloudWatch: You can’t run what you can’t see. CloudWatch is the native monitoring and observability service. It collects logs (CloudWatch Logs), metrics (CloudWatch Metrics), and allows you to set alarms based on them (e.g., “Alert me if my Lambda function has more than 5 errors in 1 minute”).
Amazon Cognito: A fully managed user identity and authentication service. If your app needs a “Sign Up / Sign In” page, Cognito handles the user pool, password resets, and social federation (e.g., “Login with Google”) for you.
Frequently Asked Questions
What’s the best way to start learning these AWS services?
The single best way is to build something. Take advantage of the AWS Free Tier, which gives you a generous amount of many of these services (Lambda, DynamoDB, S3, etc.) for 12 months. Pick a project—like a serverless URL shortener or a photo-sharing app—and build it. Use API Gateway + Lambda + DynamoDB. Host the frontend on S3. You’ll learn more from one weekend of building than from weeks of passive reading.
Do I need to know all 10 of these?
No, but you should know *of* them. Your daily focus will depend on your stack. If you’re a pure serverless developer, your world will be Lambda, DynamoDB, API Gateway, SQS, and IAM. If you’re on a team managing large-scale microservices, you’ll live inside EKS, RDS, and CloudWatch. The most universal services that *every* developer should know are S3 and IAM, as they are truly foundational.
How is AWS different from Azure or GCP for a developer?
All three major cloud providers (AWS, Microsoft Azure, and Google Cloud Platform) offer the same core “primitives.” They all have a serverless function service (Lambda, Azure Functions, Google Cloud Functions), a container service (ECS/EKS, Azure Kubernetes Service, Google Kubernetes Engine), and managed databases. The concepts are 100% transferable. AWS is the most mature, has the largest market share, and offers the widest breadth of services. The main difference a developer will feel is in the naming conventions, the specific SDKs/APIs, and the IAM system, which is unique to each cloud.
Conclusion
The cloud is no longer just infrastructure; it’s the new application server, the new database, and the new deployment pipeline, all rolled into one API-driven platform. For developers in 2025, fluency in these core AWS Services is not just a “nice to have” skill—it is a fundamental part of the job. By focusing on this top 10 list, you move beyond just writing code and become an architect of scalable, resilient, and powerful cloud-native applications. Start with S3 and IAM, pick a compute layer like Lambda or Fargate, add a database like DynamoDB or RDS, and you’ll have the foundation you need to build almost anything. Thank you for reading the DevopsRoles page!
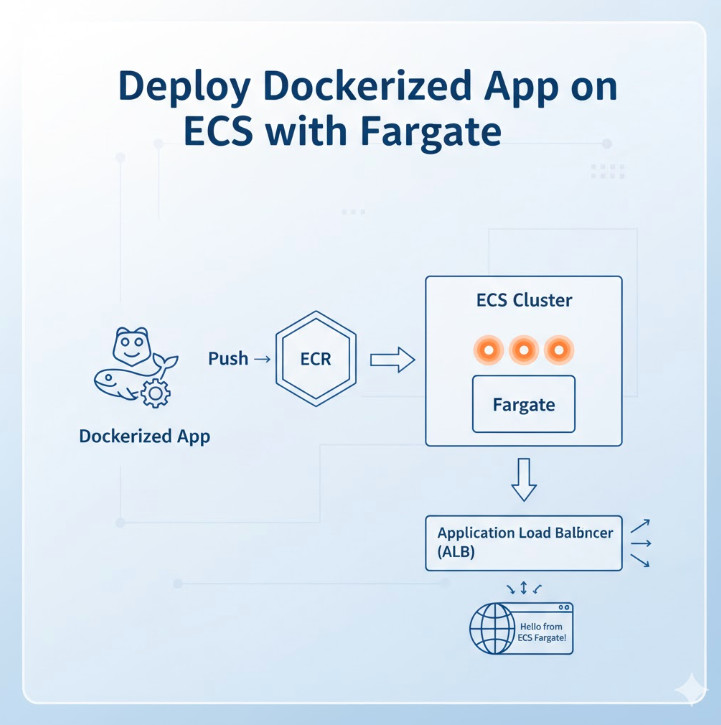
Welcome to the definitive guide for DevOps engineers, SREs, and developers looking to master container orchestration on AWS. In today’s cloud-native landscape, running containers efficiently, securely, and at scale is paramount. While Kubernetes (EKS) often grabs the headlines, Amazon’s Elastic Container Service (ECS) paired with AWS Fargate offers a powerfully simple, serverless alternative. This article provides a deep, step-by-step tutorial to Deploy Dockerized App ECS Fargate, transforming your application from a local Dockerfile to a highly available, scalable service in the AWS cloud.
We’ll move beyond simple “click-ops” and focus on the “why” behind each step, from setting up your network infrastructure to configuring task definitions and load balancers. By the end, you’ll have a production-ready deployment pattern you can replicate and automate.
Why Choose ECS with Fargate?
Before we dive into the “how,” let’s establish the “why.” Why choose ECS with Fargate over other options like ECS on EC2 or even EKS?
The Serverless Container Experience
The primary advantage is Fargate. It’s a serverless compute engine for containers. When you use the Fargate launch type, you no longer need to provision, manage, or scale a cluster of EC2 instances to run your containers. You simply define your application’s requirements (CPU, memory), and Fargate launches and manages the underlying infrastructure for you. This means:
No Patching: You are not responsible for patching or securing the underlying host OS.
Right-Sized Resources: You pay for the vCPU and memory resources your application requests, not for an entire EC2 instance.
Rapid Scaling: Fargate can scale up and down quickly, launching new container instances in seconds without waiting for EC2 instances to boot.
Security Isolation: Each Fargate task runs in its own isolated kernel environment, enhancing security.
ECS vs. Fargate vs. EC2 Launch Types
It’s important to clarify the terms. ECS is the control plane (the orchestrator), while Fargate and EC2 are launch types (the data plane where containers run).
Feature
ECS with Fargate
ECS on EC2
Infrastructure Management
None. Fully managed by AWS.
You manage the EC2 instances (patching, scaling, securing).
Pricing Model
Per-task vCPU and memory/second.
Per-EC2 instance/second (regardless of utilization).
Control
Less control over the host environment.
Full control. Can use specific AMIs, daemonsets, etc.
Use Case
Most web apps, microservices, batch jobs.
Apps with specific compliance, GPU, or host-level needs.
For most modern applications, the simplicity and operational efficiency of Fargate make it the default choice. You can learn more directly from the official AWS Fargate page.
Prerequisites for Deployment
Before we begin the deployment, let’s gather our tools and assets.
1. A Dockerized Application
You need an application containerized with a Dockerfile. For this tutorial, we’ll use a simple Node.js “Hello World” web server. If you already have an image in ECR, you can skip to Step 2.
Create a directory for your app and add these three files:
Dockerfile
# Use an official Node.js runtime as a parent image
FROM node:18-alpine

# Set the working directory in the container
WORKDIR /usr/src/app

# Copy package.json and package-lock.json
COPY package*.json ./

# Install app dependencies
RUN npm install

# Bundle app's source
COPY . .

# Expose the port the app runs on
EXPOSE 8080

# Define the command to run the app
CMD [ "node", "index.js" ]
index.js
const http = require('http');

const port = 8080;

const server = http.createServer((req, res) => {
  res.statusCode = 200;
  res.setHeader('Content-Type', 'text/plain');
  res.end('Hello from ECS Fargate!\n');
});

server.listen(port, () => {
  console.log(`Server running at http://localhost:${port}/`);
});
You’ll need an AWS account with IAM permissions to manage ECS, ECR, VPC, IAM roles, and Load Balancers. Ensure you have the AWS CLI installed and configured with your credentials.
3. Amazon ECR Repository
Your Docker image needs to live in a registry. We’ll use Amazon Elastic Container Registry (ECR).
Make a note of the repositoryUri in the output. It will look something like 123456789012.dkr.ecr.us-east-1.amazonaws.com/ecs-fargate-demo.
Step-by-Step Guide to Deploy Dockerized App ECS Fargate
This is the core of our tutorial. Follow these steps precisely to get your application running.
Step 1: Build and Push Your Docker Image to ECR
First, we build our local Dockerfile, tag it for ECR, and push it to our new repository.
# 1. Get your AWS Account ID
AWS_ACCOUNT_ID=$(aws sts get-caller-identity --query Account --output text)

# 2. Define repository variables
REPO_NAME="ecs-fargate-demo"
REGION="us-east-1"
REPO_URI="${AWS_ACCOUNT_ID}.dkr.ecr.${REGION}.amazonaws.com/${REPO_NAME}"

# 3. Log in to ECR
aws ecr get-login-password --region ${REGION} | docker login --username AWS --password-stdin ${REPO_URI}

# 4. Build the Docker image
# Make sure you are in the directory with your Dockerfile
docker build -t ${REPO_NAME} .

# 5. Tag the image for ECR
docker tag ${REPO_NAME}:latest ${REPO_URI}:latest

# 6. Push the image to ECR
docker push ${REPO_URI}:latest
Your application image is now stored in ECR, ready to be pulled by ECS.
Step 2: Set Up Your Networking (VPC)
A Fargate task *always* runs inside a VPC (Virtual Private Cloud). For a production-ready setup, we need:
A VPC.
At least two public subnets for our Application Load Balancer (ALB).
At least two private subnets for our Fargate tasks (for security).
An Internet Gateway (IGW) attached to the VPC.
A NAT Gateway in a public subnet to allow tasks in private subnets to access the internet (e.g., to pull images or talk to external APIs).
Route tables to connect everything.
Setting this up manually is tedious. The easiest way is to use the “VPC with public and private subnets” template in the AWS VPC Wizard or use an existing “default” VPC for simplicity (though not recommended for production).
For this guide, let’s assume you have a default VPC. We will use its public subnets for both the ALB and the Fargate task for simplicity. In production, always place tasks in private subnets.
We need a Security Group for our Fargate task. This acts as a virtual firewall.
# 1. Get your default VPC ID
VPC_ID=$(aws ec2 describe-vpcs --filters "Name=isDefault,Values=true" --query "Vpcs[0].VpcId" --output text)

# 2. Create a Security Group for the Fargate task
TASK_SG_ID=$(aws ec2 create-security-group \
    --group-name "fargate-task-sg" \
    --description "Allow traffic to Fargate task" \
    --vpc-id ${VPC_ID} \
    --query "GroupId" --output text)

# 3. Add a rule to allow traffic on port 8080 (our app's port)
# We will later restrict this to only the ALB's Security Group
aws ec2 authorize-security-group-ingress \
    --group-id ${TASK_SG_ID} \
    --protocol tcp \
    --port 8080 \
    --cidr 0.0.0.0/0
Step 3: Create an ECS Cluster
An ECS Cluster is a logical grouping of tasks or services. For Fargate, it’s just a namespace.
Note:cpu: "1024" (1 vCPU) and memory: "2048" (2GB RAM) are defined. You can adjust these. Fargate has specific valid CPU/memory combinations.
Now, register this task definition:
# Don't forget to replace the placeholders in the JSON file first!
# You can use sed or just manually edit it.
# Example using sed:
# sed -i "s/YOUR_ACCOUNT_ID/${AWS_ACCOUNT_ID}/g" task-definition.json
# sed -i "s/YOUR_REGION/${REGION}/g" task-definition.json
aws ecs register-task-definition --cli-input-json file://task-definition.json
Step 6: Create the ECS Service
The final step! The ECS Service is responsible for running and maintaining a specified number (the "desired count") of your tasks. It connects the Task Definition, Cluster, ALB, and Networking.
# 1. Get your public subnet IDs again (we'll use them for the task)
# In production, these should be PRIVATE subnets.
SUBNET_ID_1=$(echo ${SUBNET_IDS} | awk '{print $1}')
SUBNET_ID_2=$(echo ${SUBNET_IDS} | awk '{print $2}')
# 2. Create the service
aws ecs create-service \
--cluster "fargate-demo-cluster" \
--service-name "fargate-demo-service" \
--task-definition "fargate-demo-task" \
--desired-count 2 \
--launch-type "FARGATE" \
--network-configuration "awsvpcConfiguration={subnets=[${SUBNET_ID_1},${SUBNET_ID_2}],securityGroups=[${TASK_SG_ID}],assignPublicIp=ENABLED}" \
--load-balancers "targetGroupArn=${TG_ARN},containerName=fargate-demo-container,containerPort=8080" \
--health-check-grace-period-seconds 60
# Note: assignPublicIp=ENABLED is only needed if tasks are in public subnets.
# If in private subnets with a NAT Gateway, set this to DISABLED.
Step 7: Verify the Deployment
Your service is now deploying. It will take a minute or two for the tasks to start, pass health checks, and register with the ALB.
You can check the status in the AWS ECS Console, or get the ALB's DNS name to access your app:
# Get the ALB's public DNS name
ALB_DNS=$(aws elbv2 describe-load-balancers \
--load-balancer-arns ${ALB_ARN} \
--query "LoadBalancers[0].DNSName" --output text)
echo "Your app is available at: http://${ALB_DNS}"
# You can also check the status of your service's tasks
aws ecs list-tasks --cluster "fargate-demo-cluster" --service-name "fargate-demo-service"
Open the http://... URL in your browser. You should see "Hello from ECS Fargate!"
Advanced Configuration and Best Practices
Managing Secrets with AWS Secrets Manager
Never hardcode secrets (like database passwords) in your Dockerfile or Task Definition. Instead, store them in AWS Secrets Manager or SSM Parameter Store. You can then inject them into your container at runtime by modifying the containerDefinitions in your task definition:
This will inject the secret as an environment variable named DB_PASSWORD.
Configuring Auto Scaling for Your Service
A major benefit of ECS is auto-scaling. You can scale your service based on metrics like CPU, memory, or ALB request count.
# 1. Register the service as a scalable target
aws application-autoscaling register-scalable-target \
--service-namespace ecs \
--scalable-dimension ecs:service:DesiredCount \
--resource-id service/fargate-demo-cluster/fargate-demo-service \
--min-capacity 2 \
--max-capacity 10
# 2. Create a scaling policy (e.g., target 75% CPU utilization)
aws application-autoscaling put-scaling-policy \
--service-namespace ecs \
--scalable-dimension ecs:service:DesiredCount \
--resource-id service/fargate-demo-cluster/fargate-demo-service \
--policy-name "ecs-cpu-scaling-policy" \
--policy-type TargetTrackingScaling \
--target-tracking-scaling-policy-configuration '{"TargetValue":75.0,"PredefinedMetricSpecification":{"PredefinedMetricType":"ECSServiceAverageCPUUtilization"},"ScaleInCooldown":300,"ScaleOutCooldown":60}'
CI/CD Pipelines for Automated Deployments
Manually running these commands isn't sustainable. The next step is to automate this entire process in a CI/CD pipeline using tools like AWS CodePipeline, GitHub Actions, or Jenkins. A typical pipeline would:
Build: Run docker build.
Test: Run unit/integration tests.
Push: Push the new image to ECR.
Deploy: Create a new Task Definition revision and update the ECS Service to use it, triggering a rolling deployment.
Frequently Asked Questions
What is the difference between ECS and EKS?
ECS is Amazon's proprietary container orchestrator. It's simpler to set up and manage, especially with Fargate. EKS (Elastic Kubernetes Service) is Amazon's managed Kubernetes service. It offers the full power and portability of Kubernetes but comes with a steeper learning curve and more operational overhead (even with Fargate for EKS).
Is Fargate more expensive than EC2 launch type?
On paper, Fargate's per-vCPU/GB-hour rates are higher than an equivalent EC2 instance. However, with the EC2 model, you pay for the *entire instance* 24/7, even if it's only 30% utilized. With Fargate, you pay *only* for the resources your tasks request. For spiky or under-utilized workloads, Fargate is often cheaper and always more operationally efficient.
How do I monitor my Fargate application?
Your first stop is Amazon CloudWatch Logs, which we configured in the task definition. For metrics, ECS provides default CloudWatch metrics for service CPU and memory utilization. For deeper, application-level insights (APM), you can integrate tools like AWS X-Ray, Datadog, or New Relic.
Can I use a private ECR repository?
Yes. The ecs-task-execution-role we created grants Fargate permission to pull from your ECR repositories. If your task is in a private subnet, you'll also need to configure a VPC Endpoint for ECR (com.amazonaws.us-east-1.ecr.dkr) so it can pull the image without going over the public internet.
Conclusion
Congratulations! You have successfully mastered the end-to-end process to Deploy Dockerized App ECS Fargate. We've gone from a local Dockerfile to a secure, scalable, and publicly accessible web service running on serverless container infrastructure. We've covered networking with VPCs, image management with ECR, load balancing with ALB, and the core ECS components of Clusters, Task Definitions, and Services.
By leveraging Fargate, you've removed the undifferentiated heavy lifting of managing server clusters, allowing your team to focus on building features, not patching instances. This pattern is the foundation for building robust microservices on AWS, and you now have the practical skills and terminal-ready commands to do it yourself.
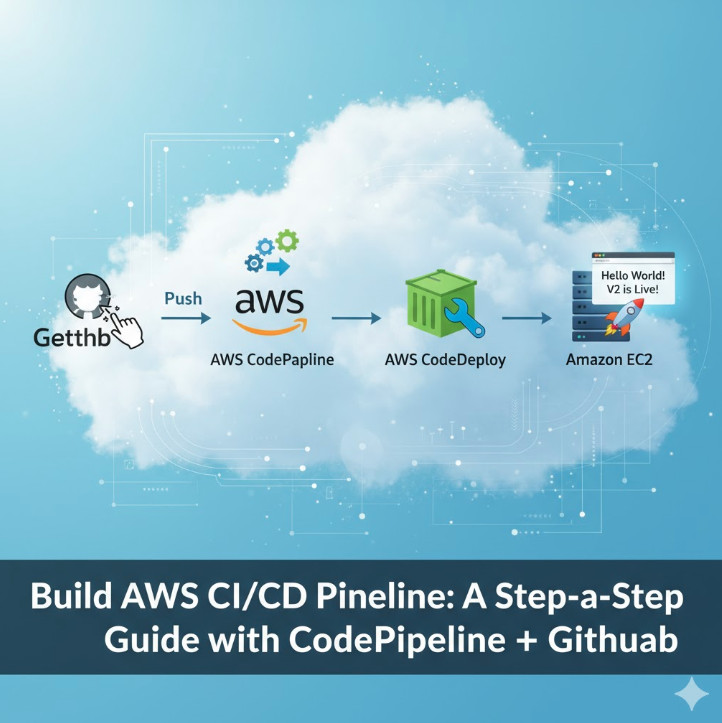
In today’s fast-paced software development landscape, automation isn’t a luxury; it’s a necessity. The ability to automatically build, test, and deploy applications allows development teams to release features faster, reduce human error, and improve overall product quality. This is the core promise of CI/CD (Continuous Integration and Continuous Delivery/Deployment). This guide will provide a comprehensive walkthrough on how to build a robust AWS CI/CD Pipeline using the powerful suite of AWS developer tools, seamlessly integrated with your GitHub repository.
We’ll go from a simple Node.js application on your local machine to a fully automated deployment onto an EC2 instance every time you push a change to your code. This practical, hands-on tutorial is designed for DevOps engineers, developers, and system administrators looking to master automation on the AWS cloud.
What is an AWS CI/CD Pipeline?
Before diving into the “how,” let’s clarify the “what.” A CI/CD pipeline is an automated workflow that developers use to reliably deliver new software versions. It’s a series of steps that code must pass through before it’s released to users.
Continuous Integration (CI): This is the practice of developers frequently merging their code changes into a central repository (like GitHub). After each merge, an automated build and test sequence is run. The goal is to detect integration bugs as quickly as possible.
Continuous Delivery/Deployment (CD): This practice extends CI. It automatically deploys all code changes that pass the CI stage to a testing and/or production environment. Continuous Delivery means the final deployment to production requires manual approval, while Continuous Deployment means it happens automatically.
An AWS CI/CD Pipeline leverages AWS-native services to implement this workflow, offering a managed, scalable, and secure way to automate your software delivery process.
Core Components of Our AWS CI/CD Pipeline
AWS provides a suite of services, often called the “CodeSuite,” that work together to create a powerful pipeline. For this tutorial, we will focus on the following key components:
AWS CodePipeline
Think of CodePipeline as the orchestrator or the “glue” for our entire pipeline. It models, visualizes, and automates the steps required to release your software. You define a series of stages (e.g., Source, Build, Deploy), and CodePipeline ensures that your code changes move through these stages automatically upon every commit.
GitHub (Source Control)
While AWS offers its own Git repository service (CodeCommit), using GitHub is incredibly common. CodePipeline integrates directly with GitHub, allowing it to automatically pull the latest source code whenever a change is pushed to a specific branch.
AWS CodeBuild
CodeBuild is a fully managed continuous integration service that compiles source code, runs tests, and produces software packages that are ready to deploy. You don’t need to provision or manage any build servers. You simply define the build commands in a buildspec.yml file, and CodeBuild executes them in a clean, containerized environment. It scales automatically to meet your build volume.
AWS CodeDeploy
CodeDeploy is a service that automates application deployments to a variety of compute services, including Amazon EC2 instances, on-premises servers, AWS Fargate, or AWS Lambda. It handles the complexity of updating your applications, helping to minimize downtime during deployment and providing a centralized way to manage and monitor the process.
Prerequisites for Building Your Pipeline
Before we start building, make sure you have the following ready:
An AWS Account with administrative privileges.
A GitHub Account where you can create a new repository.
Basic familiarity with the AWS Management Console and Git commands.
A simple application to deploy. We will provide one below.
Step-by-Step Guide: Building Your AWS CI/CD Pipeline
Let’s get our hands dirty and build the pipeline from the ground up. We will create a simple “Hello World” Node.js application and configure the entire AWS stack to deploy it.
Step 1: Preparing Your Application and GitHub Repository
First, create a new directory on your local machine, initialize a Git repository, and create the following files.
3. `buildspec.yml` – Instructions for AWS CodeBuild.
This file tells CodeBuild how to build our project. It installs dependencies and prepares the output artifacts that CodeDeploy will use.
version: 0.2

    phases:
      install:
        runtime-versions:
          nodejs: 18
        commands:
          - echo Installing dependencies...
          - npm install
      build:
        commands:
          - echo Build started on `date`
          - echo Compiling the Node.js code...
          # No actual build step needed for this simple app
      post_build:
        commands:
          - echo Build completed on `date`
    artifacts:
      files:
        - '**/*'
4. `appspec.yml` – Instructions for AWS CodeDeploy.
This file tells CodeDeploy how to deploy the application on the EC2 instance. It specifies where the files should be copied and includes “hooks” to run scripts at different stages of the deployment lifecycle.
Create a `scripts` directory and add the following files. These are referenced by `appspec.yml`.
`scripts/before_install.sh`
    #!/bin/bash
    # Install Node.js and PM2
    curl -fsSL https://deb.nodesource.com/setup_18.x | sudo -E bash -
    sudo apt-get install -y nodejs
    sudo npm install pm2 -g

    # Create deployment directory if it doesn't exist
    DEPLOY_DIR="/var/www/html/my-app"
    if [ ! -d "$DEPLOY_DIR" ]; then
      mkdir -p "$DEPLOY_DIR"
    fi
`scripts/application_start.sh`
    #!/bin/bash
    # Start the application
    cd /var/www/html/my-app
    pm2 stop index.js || true
    pm2 start index.js
`scripts/validate_service.sh`
    #!/bin/bash
    # Validate the service is running
    sleep 5 # Give the app a moment to start
    curl -f http://localhost:3000
Finally, make the scripts executable, commit all files, and push them to a new repository on your GitHub account.
Step 2: Setting Up the Deployment Environment (EC2 and IAM)
We need a server to deploy our application to. We’ll launch an EC2 instance and configure it with the necessary permissions and software.
1. Create an IAM Role for EC2:
Go to the IAM console and create a new role.
Select “AWS service” as the trusted entity type and “EC2” as the use case.
Attach the permission policy: AmazonEC2RoleforAWSCodeDeploy. This allows the CodeDeploy agent on the EC2 instance to communicate with the CodeDeploy service.
Give the role a name (e.g., EC2CodeDeployRole) and create it.
2. Launch an EC2 Instance:
Go to the EC2 console and launch a new instance.
Choose an AMI, like Ubuntu Server 22.04 LTS.
Choose an instance type, like t2.micro (Free Tier eligible).
In the “Advanced details” section, select the EC2CodeDeployRole you just created for the “IAM instance profile.”
Add a tag to the instance, e.g., Key: Name, Value: WebServer. We’ll use this tag to identify the instance in CodeDeploy.
Configure the security group to allow inbound traffic on port 22 (SSH) from your IP and port 3000 (HTTP) from anywhere (0.0.0.0/0) for our app.
In the “User data” field under “Advanced details”, paste the following script. This will install the CodeDeploy agent when the instance launches.
#!/bin/bash
    sudo apt-get update
    sudo apt-get install ruby-full wget -y
    cd /home/ubuntu
    wget https://aws-codedeploy-us-east-1.s3.us-east-1.amazonaws.com/latest/install
    chmod +x ./install
    sudo ./install auto
    sudo service codedeploy-agent start
    sudo service codedeploy-agent status
Launch the instance.
Step 3: Configuring AWS CodeDeploy
Now, we’ll set up CodeDeploy to manage deployments to our new EC2 instance.
1. Create a CodeDeploy Application:
Navigate to the CodeDeploy console.
Click “Create application.”
Give it a name (e.g., MyWebApp) and select EC2/On-premises as the compute platform.
2. Create a Deployment Group:
Inside your new application, click “Create deployment group.”
Enter a name (e.g., WebApp-Production).
Create a new service role for CodeDeploy or use an existing one. This role needs permissions to interact with AWS services like EC2. The console can create one for you with the required AWSCodeDeployRole policy.
For the environment configuration, choose “Amazon EC2 instances” and select the tag you used for your instance (Key: Name, Value: WebServer).
Ensure the deployment settings are configured to your liking (e.g., CodeDeployDefault.OneAtATime).
Disable the load balancer for this simple setup.
Create the deployment group.
Step 4: Creating the AWS CodePipeline
This is the final step where we connect everything together.
Navigate to the AWS CodePipeline console and click “Create pipeline.”
Stage 1: Pipeline settings – Give your pipeline a name (e.g., GitHub-to-EC2-Pipeline). Let AWS create a new service role.
Stage 2: Source stage – Select GitHub (Version 2) as the source provider. Click “Connect to GitHub” and authorize the connection. Select your repository and the branch (e.g., main). Leave the rest as default.
Stage 3: Build stage – Select AWS CodeBuild as the build provider. Select your region, and then click “Create project.” A new window will pop up.
Project name: e.g., WebApp-Builder.
Environment: Managed image, Amazon Linux 2, Standard runtime, and select a recent image version.
Role: Let it create a new service role.
Buildspec: Choose “Use a buildspec file”. This will use the buildspec.yml in your repository.
Click “Continue to CodePipeline.”
Stage 4: Deploy stage – Select AWS CodeDeploy as the deploy provider. Select the application name (MyWebApp) and deployment group (WebApp-Production) you created earlier.
Stage 5: Review – Review all the settings and click “Create pipeline.”
Triggering and Monitoring Your Pipeline
Once you create the pipeline, it will automatically trigger its first run, pulling the latest code from your GitHub repository. You can watch the progress as it moves from the “Source” stage to “Build” and finally “Deploy.”
If everything is configured correctly, all stages will turn green. You can then navigate to your EC2 instance’s public IP address in a web browser (e.g., http://YOUR_EC2_IP:3000) and see your “Hello World” message!
To test the automation, go back to your local `index.js` file, change the message to “Hello World! V2 is live!”, commit, and push the change to GitHub. Within a minute or two, you will see CodePipeline automatically detect the change, run the build, and deploy the new version. Refresh your browser, and you’ll see the updated message without any manual intervention.
Frequently Asked Questions (FAQs)
Can I deploy to other services besides EC2?
Absolutely. CodeDeploy and CodePipeline support deployments to Amazon ECS (for containers), AWS Lambda (for serverless functions), and even S3 for static websites. You would just configure the Deploy stage of your pipeline differently.
How do I manage sensitive information like database passwords?
You should never hardcode secrets in your repository. The best practice is to use AWS Secrets Manager or AWS Systems Manager Parameter Store. CodeBuild can be given IAM permissions to fetch these secrets securely during the build process and inject them as environment variables.
What is the cost associated with this setup?
AWS has a generous free tier. You get one active CodePipeline for free per month. CodeBuild offers 100 build minutes per month for free. Your primary cost will be the running EC2 instance, which is also covered by the free tier for the first 12 months (for a t2.micro instance).
How can I add a manual approval step?
In CodePipeline, you can add a new stage before your production deployment. In this stage, you can add an “Approval” action. The pipeline will pause at this point and wait for a user with the appropriate IAM permissions to manually approve or reject the change before it proceeds.
Conclusion
Congratulations! You have successfully built a fully functional, automated AWS CI/CD Pipeline. By integrating GitHub with CodePipeline, CodeBuild, and CodeDeploy, you’ve created a powerful workflow that dramatically improves the speed and reliability of your software delivery process. This setup forms the foundation of modern DevOps practices on the cloud. From here, you can expand the pipeline by adding automated testing stages, deploying to multiple environments (staging, production), and integrating more advanced monitoring and rollback capabilities. Mastering this core workflow is a critical skill for any cloud professional looking to leverage the full power of AWS. Thank you for reading the DevopsRoles page!
In modern cloud development, speed and reliability are paramount. Manually deploying serverless functions is a recipe for inconsistency and human error. This is where a robust CI/CD pipeline becomes essential. By integrating AWS Lambda GitHub Actions, you can create a seamless, automated workflow that builds, tests, and deploys your serverless code every time you push to your repository. This guide will walk you through every step of building a production-ready serverless deployment pipeline, transforming your development process from a manual chore into an automated, efficient system.
Why Automate Lambda Deployments with GitHub Actions?
Before diving into the technical details, let’s understand the value proposition. Automating your Lambda deployments isn’t just a “nice-to-have”; it’s a cornerstone of modern DevOps and Site Reliability Engineering (SRE) practices.
Consistency: Automation eliminates the “it worked on my machine” problem. Every deployment follows the exact same process, reducing environment-specific bugs.
Speed & Agility: Push a commit and watch it go live in minutes. This rapid feedback loop allows your team to iterate faster and deliver value to users more quickly.
Reduced Risk: Manual processes are prone to error. An automated pipeline can include testing and validation steps, catching bugs before they ever reach production.
Developer Focus: By abstracting away the complexities of deployment, developers can focus on what they do best: writing code. The CI/CD for Lambda becomes a transparent part of the development lifecycle.
Prerequisites for Integrating AWS Lambda GitHub Actions
To follow this guide, you’ll need a few things set up. Ensure you have the following before you begin:
An AWS Account: You’ll need an active AWS account with permissions to create IAM roles and Lambda functions.
A GitHub Account: Your code will be hosted on GitHub, and we’ll use GitHub Actions for our automation.
A Lambda Function: Have a simple Lambda function ready. We’ll provide an example below. If you’re new, you can create one in the AWS console to start.
Basic Git Knowledge: You should be comfortable with basic Git commands like git clone, git add, git commit, and git push.
Step-by-Step Guide to Automating Your AWS Lambda GitHub Actions Pipeline
Let’s build our automated deployment pipeline from the ground up. We will use the modern, secure approach of OpenID Connect (OIDC) to grant GitHub Actions access to AWS, avoiding the need for long-lived static access keys.
Step 1: Setting Up Your Lambda Function Code
First, let’s create a simple Node.js Lambda function. Create a new directory for your project and add the following files.
Initialize a Git repository in this directory and push it to a new repository on GitHub.
Step 2: Configuring IAM Roles for Secure Access (OIDC)
This is the most critical step for security. We will configure an IAM OIDC identity provider that allows GitHub Actions to assume a role in your AWS account temporarily.
A. Create the OIDC Identity Provider in AWS IAM
Navigate to the IAM service in your AWS Console.
In the left pane, click on Identity providers and then Add provider.
Select OpenID Connect.
For the Provider URL, enter https://token.actions.githubusercontent.com.
Click Get thumbprint to verify the server certificate.
For the Audience, enter sts.amazonaws.com.
Click Add provider.
B. Create the IAM Role for GitHub Actions
In IAM, go to Roles and click Create role.
For the trusted entity type, select Web identity.
Choose the identity provider you just created (token.actions.githubusercontent.com).
Select sts.amazonaws.com for the Audience.
Optionally, you can restrict this role to a specific GitHub repository. Add a condition:
On the permissions page, create a new policy. Click Create policy, switch to the JSON editor, and paste the following. This policy grants the minimum required permissions to update a Lambda function’s code. Replace YOUR_FUNCTION_NAME and the AWS account details.
Name the policy (e.g., GitHubActionsLambdaDeployPolicy) and attach it to your role.
Finally, give your role a name (e.g., GitHubActionsLambdaDeployRole) and create it.
Once created, copy the ARN of this role. You’ll need it in the next step.
Step 3: Storing AWS Credentials Securely in GitHub
We need to provide the Role ARN to our GitHub workflow. The best practice is to use GitHub’s encrypted secrets.
Go to your repository on GitHub and click on Settings > Secrets and variables > Actions.
Click New repository secret.
Name the secret AWS_ROLE_TO_ASSUME.
Paste the IAM Role ARN you copied in the previous step into the Value field.
Click Add secret.
Step 4: Crafting the GitHub Actions Workflow File
Now, we’ll create the YAML file that defines our CI/CD pipeline. Create the file .github/workflows/deploy.yml in your project.
name: Deploy Lambda Function

# Trigger the workflow on pushes to the main branch
on:
  push:
    branches:
      - main

jobs:
  deploy:
    runs-on: ubuntu-latest

    # These permissions are needed to authenticate with AWS via OIDC
    permissions:
      id-token: write
      contents: read

    steps:
      - name: Checkout repository
        uses: actions/checkout@v4

      - name: Configure AWS Credentials
        uses: aws-actions/configure-aws-credentials@v4
        with:
          role-to-assume: ${{ secrets.AWS_ROLE_TO_ASSUME }}
          aws-region: us-east-1 # Change to your desired AWS region

      - name: Setup Node.js
        uses: actions/setup-node@v4
        with:
          node-version: '18'

      - name: Install dependencies
        run: npm install

      - name: Create ZIP deployment package
        run: zip -r deployment-package.zip . -x ".git/*" ".github/*"

      - name: Deploy to AWS Lambda
        run: |
          aws lambda update-function-code \
            --function-name YOUR_FUNCTION_NAME \
            --zip-file fileb://deployment-package.zip
Make sure to replace YOUR_FUNCTION_NAME with the actual name of your Lambda function in AWS and update the aws-region if necessary.
Deep Dive into the GitHub Actions Workflow
Let’s break down the key sections of our deploy.yml file to understand how this serverless deployment pipeline works.
Triggering the Workflow
The on key defines what events trigger the workflow. Here, we’ve configured it to run automatically whenever code is pushed to the main branch.
on:
  push:
    branches:
      - main
Configuring AWS Credentials
This is the heart of our secure connection. The aws-actions/configure-aws-credentials action is the official action from AWS for this purpose. It handles the OIDC handshake behind the scenes. It requests a JSON Web Token (JWT) from GitHub, presents it to AWS, and uses the role specified in our AWS_ROLE_TO_ASSUME secret to get temporary credentials. These credentials are then available to subsequent steps in the job.
AWS Lambda requires a ZIP file for deployment. These steps ensure our code and its dependencies are properly packaged.
Install dependencies: The npm install command reads your package.json file and installs the required libraries into the node_modules directory.
Create ZIP package: The zip command creates an archive named deployment-package.zip. We exclude the .git and .github directories as they are not needed by the Lambda runtime.
The final step uses the AWS Command Line Interface (CLI), which is pre-installed on GitHub’s runners. The aws lambda update-function-code command takes our newly created ZIP file and updates the code of the specified Lambda function.
Commit and push this workflow file to your GitHub repository. The action will run automatically, and you should see your Lambda function’s code updated in the AWS console!
Best Practices and Advanced Techniques
Our current setup is great, but in a real-world scenario, you’ll want more sophistication.
Managing Environments: Use different branches (e.g., develop, staging, main) to deploy to different AWS accounts or environments. You can create separate workflows or use conditional logic within a single workflow based on the branch name (if: github.ref == 'refs/heads/main').
Testing: Add a dedicated step in your workflow to run unit or integration tests before deploying. If the tests fail, the workflow stops, preventing a bad deployment.
- name: Run unit tests
  run: npm test
Frameworks: For complex applications, consider using a serverless framework like AWS SAM or the Serverless Framework. They simplify resource definition (IAM roles, API Gateways, etc.) and have better deployment tooling that can be easily integrated into GitHub Actions.
Frequently Asked Questions
Q: Is using GitHub Actions for AWS deployments free?
A: GitHub provides a generous free tier for public repositories and a significant number of free minutes per month for private repositories. For most small to medium-sized projects, this is more than enough. Heavy usage might require a paid plan.
Q: Why use OIDC instead of storing AWS access keys in GitHub Secrets?
A: Security. Long-lived access keys are a major security risk. If compromised, they provide permanent access to your AWS account. OIDC uses short-lived tokens that are automatically generated for each workflow run, significantly reducing the attack surface. It’s the modern best practice.
Q: Can I use this workflow to deploy other AWS services?
A: Absolutely! The core concept of authenticating with aws-actions/configure-aws-credentials is universal. You just need to change the final `run` steps to use the appropriate AWS CLI commands for other services like S3, ECS, or CloudFormation.
Conclusion
You have successfully built a robust, secure, and automated CI/CD pipeline. By leveraging the power of an AWS Lambda GitHub Actions integration, you’ve removed manual steps, increased deployment velocity, and improved the overall stability of your serverless application. This foundation allows you to add more complex steps like automated testing, multi-environment deployments, and security scanning, enabling your team to build and innovate with confidence. Adopting this workflow is a significant step toward maturing your DevOps practices for serverless development. Thank you for reading the DevopsRoles page!
Infrastructure as Code (IaC) has revolutionized how we manage and deploy infrastructure, but even with its efficiency, managing complex systems can still be challenging. This is where the power of AI comes in. Amazon Bedrock, with its powerful foundation models, is changing the game, and Amazon Bedrock Agents are at the forefront of this transformation. This article will explore the capabilities of Amazon Bedrock Agents and how they are streamlining IaC, enabling developers to build, manage, and interact with infrastructure in a more intuitive and efficient way. We’ll delve into practical applications, best practices, and potential future directions, empowering you to leverage this cutting-edge technology.
Understanding Amazon Bedrock and its Agents
Amazon Bedrock offers access to a diverse range of foundation models, providing developers with powerful tools for building AI-powered applications. These models can be utilized for various tasks, including natural language processing, code generation, and more. Amazon Bedrock Agents are built upon these foundation models, acting as intelligent interfaces between developers and the infrastructure they manage. Instead of writing complex scripts or navigating intricate command-line interfaces, developers can interact with their infrastructure using natural language prompts.
How Bedrock Agents Enhance IaC
Traditionally, IaC relies heavily on scripting languages like Terraform or CloudFormation. While powerful, these tools require specialized knowledge and can be complex to manage. Amazon Bedrock Agents simplify this process by bridging the gap between human language and machine execution. This allows for more accessible and intuitive interactions with infrastructure, even for users with limited IaC experience.
Simplified Infrastructure Management: Instead of writing lengthy scripts, users can issue natural language requests, such as “create a new EC2 instance with 4 CPUs and 16GB of RAM.” The agent then translates this request into the appropriate IaC code and executes it.
Improved Collaboration: The intuitive nature of natural language prompts makes collaboration easier. Teams can communicate infrastructure changes and management tasks more effectively, reducing ambiguity and errors.
Reduced Errors: The agent’s ability to validate requests and translate them into accurate code significantly reduces the risk of human error in IaC deployments.
Faster Deployment: The streamlined workflow facilitated by Amazon Bedrock Agents significantly accelerates infrastructure deployment times.
Building and Deploying with Amazon Bedrock Agents
While the exact implementation details of Amazon Bedrock Agents are constantly evolving, the general approach involves using a combination of natural language processing and existing IaC tools. The agent acts as an intermediary, translating user requests into executable IaC code. The specific integration with tools like Terraform or CloudFormation will depend on the agent’s design and configuration.
A Practical Example
Let’s imagine a scenario where we need to deploy a new web application. Instead of writing a complex Terraform configuration, we could interact with an Amazon Bedrock Agent using the following prompt: “Deploy a new web server using Amazon ECS, with an autoscaling group, load balancer, and an RDS database. Use a Docker image from my ECR repository named ‘my-web-app’. “
The agent would then parse this request, generate the necessary Terraform (or CloudFormation) code, and execute it. The entire process would be significantly faster and less error-prone than manual scripting.
Advanced Usage and Customization
Amazon Bedrock Agents offer potential for advanced customization. By integrating with other AWS services and leveraging the capabilities of different foundation models, developers can tailor agents to specific needs and workflows. This could involve adding custom commands, integrating with monitoring tools, or creating sophisticated automation workflows.
Amazon Bedrock Agents: Best Practices and Considerations
While Amazon Bedrock Agents offer immense potential, it’s crucial to adopt best practices to maximize their effectiveness and minimize potential risks.
Security Best Practices
Access Control: Implement robust access control measures to restrict who can interact with the agent and the infrastructure it manages.
Input Validation: Always validate user inputs to prevent malicious commands or unintended actions.
Auditing: Maintain detailed logs of all agent interactions and actions performed on the infrastructure.
Optimization and Monitoring
Performance Monitoring: Regularly monitor the performance of the agent and its impact on infrastructure deployment times.
Error Handling: Implement proper error handling mechanisms to manage unexpected situations and provide informative feedback to users.
Regular Updates: Stay updated with the latest versions of the agent and underlying foundation models to benefit from performance improvements and new features.
Frequently Asked Questions
Q1: What are the prerequisites for using Amazon Bedrock Agents?
Currently, access to Amazon Bedrock Agents may require an invitation or participation in a beta program. It is essential to follow AWS announcements and updates for availability information. Basic familiarity with IaC concepts and AWS services is also recommended.
Q2: How do I integrate Amazon Bedrock Agents with my existing IaC workflows?
The integration process will depend on the specific agent implementation. This may involve configuring the agent to connect to your IaC tools (e.g., Terraform, CloudFormation) and setting up appropriate credentials. Detailed instructions should be available in the agent’s documentation.
Q3: What are the limitations of Amazon Bedrock Agents?
While powerful, Amazon Bedrock Agents may have limitations. The accuracy and efficiency of the agent will depend on the underlying foundation models and the clarity of user requests. Complex or ambiguous prompts may lead to incorrect or unexpected results. Furthermore, reliance on a single agent for critical infrastructure management might pose a risk, hence a multi-layered approach is always recommended.
Q4: What is the cost associated with using Amazon Bedrock Agents?
The cost of using Amazon Bedrock Agents will depend on factors such as the number of requests, the complexity of the tasks, and the underlying foundation models used. It is vital to refer to the AWS pricing page for the most current cost information.
Conclusion
Amazon Bedrock Agents represent a significant advancement in Infrastructure as Code, offering a more intuitive and efficient way to manage complex systems. By leveraging the power of AI, these agents simplify infrastructure management, accelerate deployment times, and reduce errors. While still in its early stages of development, the potential for Amazon Bedrock Agents is immense. By adopting best practices and understanding the limitations, developers and operations teams can unlock significant efficiency gains and transform their IaC workflows. As the technology matures, Amazon Bedrock Agents will undoubtedly play an increasingly crucial role in the future of cloud infrastructure management.
Managing multiple AWS accounts can quickly become a complex undertaking. Maintaining consistency, security, and compliance across a sprawling landscape of accounts requires robust automation and centralized governance. This article will demonstrate how to leverage Terraform and AWS Control Tower to efficiently manage and customize your AWS accounts, focusing on best practices for AWS Accounts Terraform deployments. We’ll cover everything from basic account creation to advanced configuration, providing you with the knowledge to streamline your multi-account AWS strategy.
Understanding the Need for Automated AWS Account Management
Manually creating and configuring AWS accounts is time-consuming, error-prone, and scales poorly. As your organization grows, so does the number of accounts needed for different environments (development, testing, production), teams, or projects. This decentralized approach leads to inconsistencies in security configurations, cost optimization strategies, and compliance adherence. Automating account provisioning and management with AWS Accounts Terraform offers several key advantages:
Increased Efficiency: Automate repetitive tasks, saving time and resources.
Improved Consistency: Ensure consistent configurations across all accounts.
Enhanced Security: Implement standardized security policies and controls.
Reduced Errors: Minimize human error through automation.
Better Scalability: Easily manage a growing number of accounts.
Leveraging Terraform for AWS Account Management
Terraform is an Infrastructure-as-Code (IaC) tool that allows you to define and provision infrastructure resources in a declarative manner. Using Terraform for AWS Accounts Terraform management provides a powerful and repeatable way to create, configure, and manage your AWS accounts. Below is a basic example of a Terraform configuration to create an AWS account using the AWS Organizations API:
This simple example creates a new account. However, for production environments, you’ll need more complex configurations to handle IAM roles, security groups, and other crucial components.
Integrating AWS Control Tower with Terraform
AWS Control Tower provides a centralized governance mechanism for managing multiple AWS accounts. Combining Terraform with Control Tower allows you to leverage the benefits of both: the automation of Terraform and the governance and security capabilities of Control Tower. Control Tower enables the creation of landing zones, which define the baseline configurations for new accounts.
Creating a Landing Zone with Control Tower
Before using Terraform to create accounts within a Control Tower-managed environment, you need to set up a landing zone. This involves configuring various AWS services like Organizations, IAM, and VPCs. Control Tower provides a guided process for this setup. This configuration ensures that each new account inherits consistent security policies and governance settings.
Provisioning Accounts with Terraform within a Control Tower Landing Zone
Once the landing zone is established, you can use Terraform to provision new accounts within that landing zone. This ensures that each new account adheres to the established governance and security standards. The exact Terraform configuration will depend on your specific landing zone settings. You might need to adjust the configuration to accommodate specific IAM roles, policies, and resource limits imposed by the landing zone.
Advanced AWS Accounts Terraform Configurations
Beyond basic account creation, Terraform can handle advanced configurations:
Customizing Account Settings
Terraform allows fine-grained control over various account settings, including:
IAM Roles: Define custom IAM roles and policies for each account.
Resource Limits: Set appropriate resource limits to control costs and prevent unexpected usage spikes.
Security Groups: Configure security groups to manage network access within and between accounts.
Service Control Policies (SCPs): Enforce granular control over allowed AWS services within the accounts.
Implementing Tagging Strategies
Consistent tagging across all AWS resources and accounts is crucial for cost allocation, resource management, and compliance. Terraform can automate the application of tags during account creation and resource provisioning. A well-defined tagging strategy will significantly improve your ability to manage and monitor your AWS infrastructure.
Integrating with Other AWS Services
Terraform’s flexibility allows you to integrate with other AWS services such as AWS Config, CloudTrail, and CloudWatch for monitoring and logging across your accounts. This comprehensive monitoring enhances security posture and operational visibility. For example, you can use Terraform to automate the setup of CloudWatch alarms to alert on critical events within your accounts.
Frequently Asked Questions
Q1: Can Terraform manage existing AWS accounts?
While Terraform excels at creating new accounts, it doesn’t directly manage existing ones. However, you can use Terraform to manage the resources *within* existing accounts, ensuring consistency across your infrastructure.
Q2: What are the security considerations when using Terraform for AWS Accounts Terraform?
Securely managing your Terraform configurations is paramount. Use appropriate IAM roles with least privilege access, store your Terraform state securely (e.g., in AWS S3 with encryption), and regularly review and update your configurations. Consider using Terraform Cloud or other remote backends to manage your state file securely.
Q3: How can I handle errors during account creation with Terraform?
Terraform provides robust error handling capabilities. You can use error checking mechanisms within your Terraform code, implement retry mechanisms, and leverage notification systems (like email or PagerDuty) to be alerted about failures during account provisioning.
Q4: How do I manage the cost of running this setup?
Careful planning and resource allocation are critical to managing costs. Using tagging strategies for cost allocation, setting resource limits, and regularly reviewing your AWS bills will help. Automated cost optimization tools can also aid in minimizing cloud spending.
Conclusion
Effectively managing multiple AWS accounts is a critical aspect of modern cloud infrastructure. By combining the power of Terraform and AWS Control Tower, you gain a robust, automated, and secure solution for provisioning, configuring, and managing your AWS accounts. Mastering AWS Accounts Terraform is key to building a scalable and reliable cloud architecture. Remember to always prioritize security best practices when working with infrastructure-as-code and ensure your configurations are regularly reviewed and updated.