Table of Contents
#Introduction
Elastic APM helps you monitor overall application health and performance. It is part of the Elastic Stack, which includes Elasticsearch, Logstash, and Kibana.
Elastic APM allows you to track and analyze the performance metrics of your applications, identify bottlenecks, and troubleshoot issues.
Prerequisites
- Host OS: Ubuntu 21.04
- Installed Docker and Docker-compose
- elastic-apm-agent Java agent can be downloaded from here.
Elastic APM Tool
How to integrate the application with APM tool: elasticsearch, kibana, and apm-server
We will create a docker-compose file with the content below:
nano docker-compose.ymlThe content file as below:
version: '3'
services:
      elasticsearch:
        image: docker.elastic.co/elasticsearch/elasticsearch:6.6.1
        ports:
          - "9200:9200"
      kibana:
        image: docker.elastic.co/kibana/kibana:6.6.1
        ports:
          - "5601:5601"
        depends_on:
          - elasticsearch
      apm-server:
          image: docker.elastic.co/apm/apm-server:6.6.1
          environment:
            - output.elasticsearch.hosts=["elasticsearch:9200"]
          ports:
            - "8200:8200"
          depends_on:
            - elasticsearch
Save and close that file.
Running the APM tool
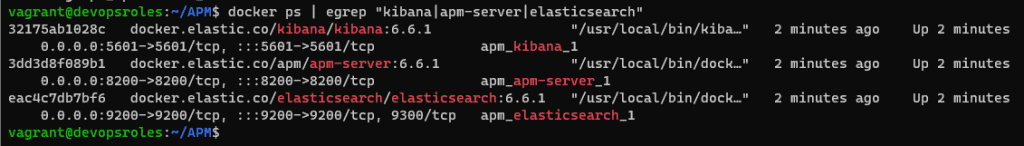
docker-compose up -d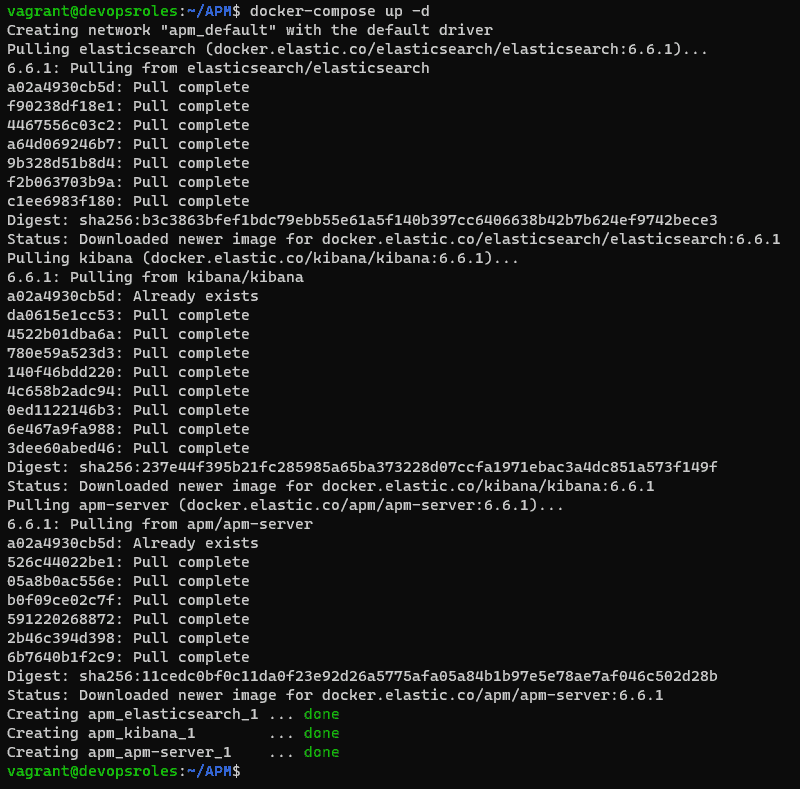
The result is the picture below:
Now, We will start the application with the javaagent and point to apm-server URL
java -javaagent:/<path-to-jar>/elastic-apm-agent-<version>.jar \
     -Delastic.apm.service_name=my-application \
     -Delastic.apm.server_url=http://localhost:8200 \
     -Delastic.apm.secret_token= \
     -Delastic.apm.application_packages=<base package> \
-jar <jar name>.jarNote: apm.application_packages → package where the main class is present
Configuration steps on Kibana
- Goto: http://localhost:5601 (http://localhost:5601/)
- Click on Add APM
- Scroll down and click on Check APM Server Status
- Scroll down and click on Check agent status
- Click on Load Kibana objects
- Launch APM
APM is now ready and integrated with the service.
Conclusion
You have Elastic APM Tool for Application Performance Monitoring.
Elastic APM is a comprehensive tool for monitoring the performance of your applications, providing deep insights into transaction traces, metrics, errors, and code-level details. It helps you identify performance issues, optimize application performance, and deliver a better user experience.
I hope will this your helpful. Thank you for reading the DevopsRoles page!