In this tutorial, How to Monitor the PHP-fpm using Netdata on Centos 7. Netdata is a free open source. It is very easy to install and configure for real-time monitoring. Now, let’s go to Netdata to Monitor PHP-FPM.
PHP-FPM (FastCGI Process Manager) is an alternative PHP FastCGI. It is commonly used in LEMP ( Linux Nginx MySQL/MariaDB PHP) stack; Nginx uses PHP FastCGI for serving dynamic HTTP content.
Steps install and configure
- Centos 7 Server or RHEL 7 Server
- Install PHP and enable PHP-FPM status
- Install Netdata and configure Monitor for PHP-FPM status.
1. How to Install PHP
For example, How to install PHP version 7.3 on Centos 7.
2. Enable the PHP-FPM status page.
Check php-fpm running on your system.
[root@DevopsRoles vagrant]# netstat -nplt | grep php-fpm
tcp        0      0 127.0.0.1:9000          0.0.0.0:*               LISTEN      4328/php-fpm: maste
[root@DevopsRoles vagrant]# ps -ef | grep php
root      4328     1  0 21:50 ?        00:00:00 php-fpm: master process (/etc/opt/remi/php73/php-fpm.conf)
apache    4329  4328  0 21:50 ?        00:00:00 php-fpm: pool www
apache    4330  4328  0 21:50 ?        00:00:00 php-fpm: pool www
apache    4331  4328  0 21:50 ?        00:00:00 php-fpm: pool www
apache    4332  4328  0 21:50 ?        00:00:00 php-fpm: pool www
apache    4333  4328  0 21:50 ?        00:00:00 php-fpm: pool www
root      4381  3003  0 21:52 pts/0    00:00:00 grep --color=auto php
Configure file php-fpm status as shown.
$ sudo vim /etc/php-fpm.d/www.conf
OR
$ sudo vim /etc/opt/remi/php73/php-fpm.d/www.conf	#for PHP versions 7.0, 7.1,7.3 vvv
You find and uncomment the variable pm.status_path = /status as shown in the screenshot.
[root@DevopsRoles vagrant]# cat /etc/opt/remi/php73/php-fpm.d/www.conf | grep pm.status_path
pm.status_path = /status
Save the changes and exit the file.
Check the PHP-FPM configuration file for any errors
$ sudo php-fpm -t
OR
$ sudo systemctl restart php73-php-fpm
Create a new Nginx config for PHP-FPM as shown
[root@DevopsRoles ~]# vi /etc/nginx/conf.d/php-fpm.conf

# The content as below:

    server {

        listen       80;
        #listen       [::]:80 default_server;
        server_name  127.0.0.1;

    location  /status {
        access_log off;
        allow 127.0.0.1;
        fastcgi_param SCRIPT_FILENAME $document_root$fastcgi_script_name;
        fastcgi_index index.php;
        deny all;
        include fastcgi_params;
        fastcgi_pass 127.0.0.1:9000;
   }
   }
Reload PHP-FPM and Nginx config for changes to take effect.
[root@DevopsRoles ~]# systemctl reload php73-php-fpm
[root@DevopsRoles ~]# systemctl reload nginx
Now, Use the curl command to check php-fpm status.
root@DevopsRoles ~]# curl http://127.0.0.1/status
pool:                 www
process manager:      dynamic
start time:           18/Jul/2020:10:16:17 +0700
start since:          878
accepted conn:        14
listen queue:         0
max listen queue:     0
listen queue len:     128
idle processes:       4
active processes:     1
total processes:      5
max active processes: 1
max children reached: 0
slow requests:        0
Memo: meaning of different values of PHP-FPM Status
-pool – the name of the pool.
-process manager – possible values static, dynamic or ondemand. We never use static.  Trying ondemand is on todo list.
-start time – the date and time FPM has started or reloaded.
-start since – number of seconds since FPM has started
-accepted conn – the number of request accepted by the pool
-listen queue – the number of request in the queue of pending connections. If this number is non-zero, then you better increase number of process FPM can spawn.
-max listen queue – the maximum number of requests in the queue of pending connections since FPM has started
-listen queue len – the size of the socket queue of pending -connections
-idle processes – the number of idle processes
-active processes – the number of active processes
-total processes – the number of idle + active processes
-max active processes – the maximum number of active processes since FPM has started
-max children reached – number of times, the process limit has been reached, when pm tries to start more children. If that value is not zero, then you may need to increase max process limit for your PHP-FPM pool. Like this, you can find other useful information to tweak your pool better way.
-slow requests – Enable php-fpm slow-log before you consider this. If this value is non-zero you may have slow php processes. Poorly written mysql queries are generally culprit.
3. Install Netdata on Centos 7 here
4. Configure Netdata to Monitor PHP-FPM
The Netdata configure for Nginx in folder /etc/netdata/python.d which is written in YAML format.
You can open it or create a new file php-fpm.conf as shown
[root@DevopsRoles python.d]# cat /etc/netdata/python.d/php-fpm.conf
# The output as below:
localhost:
  name : 'local'
  url  : 'http://localhost/status'

localipv4:
  name : 'local'
  url  : 'http://127.0.0.1/status'
Restart Netdata Server
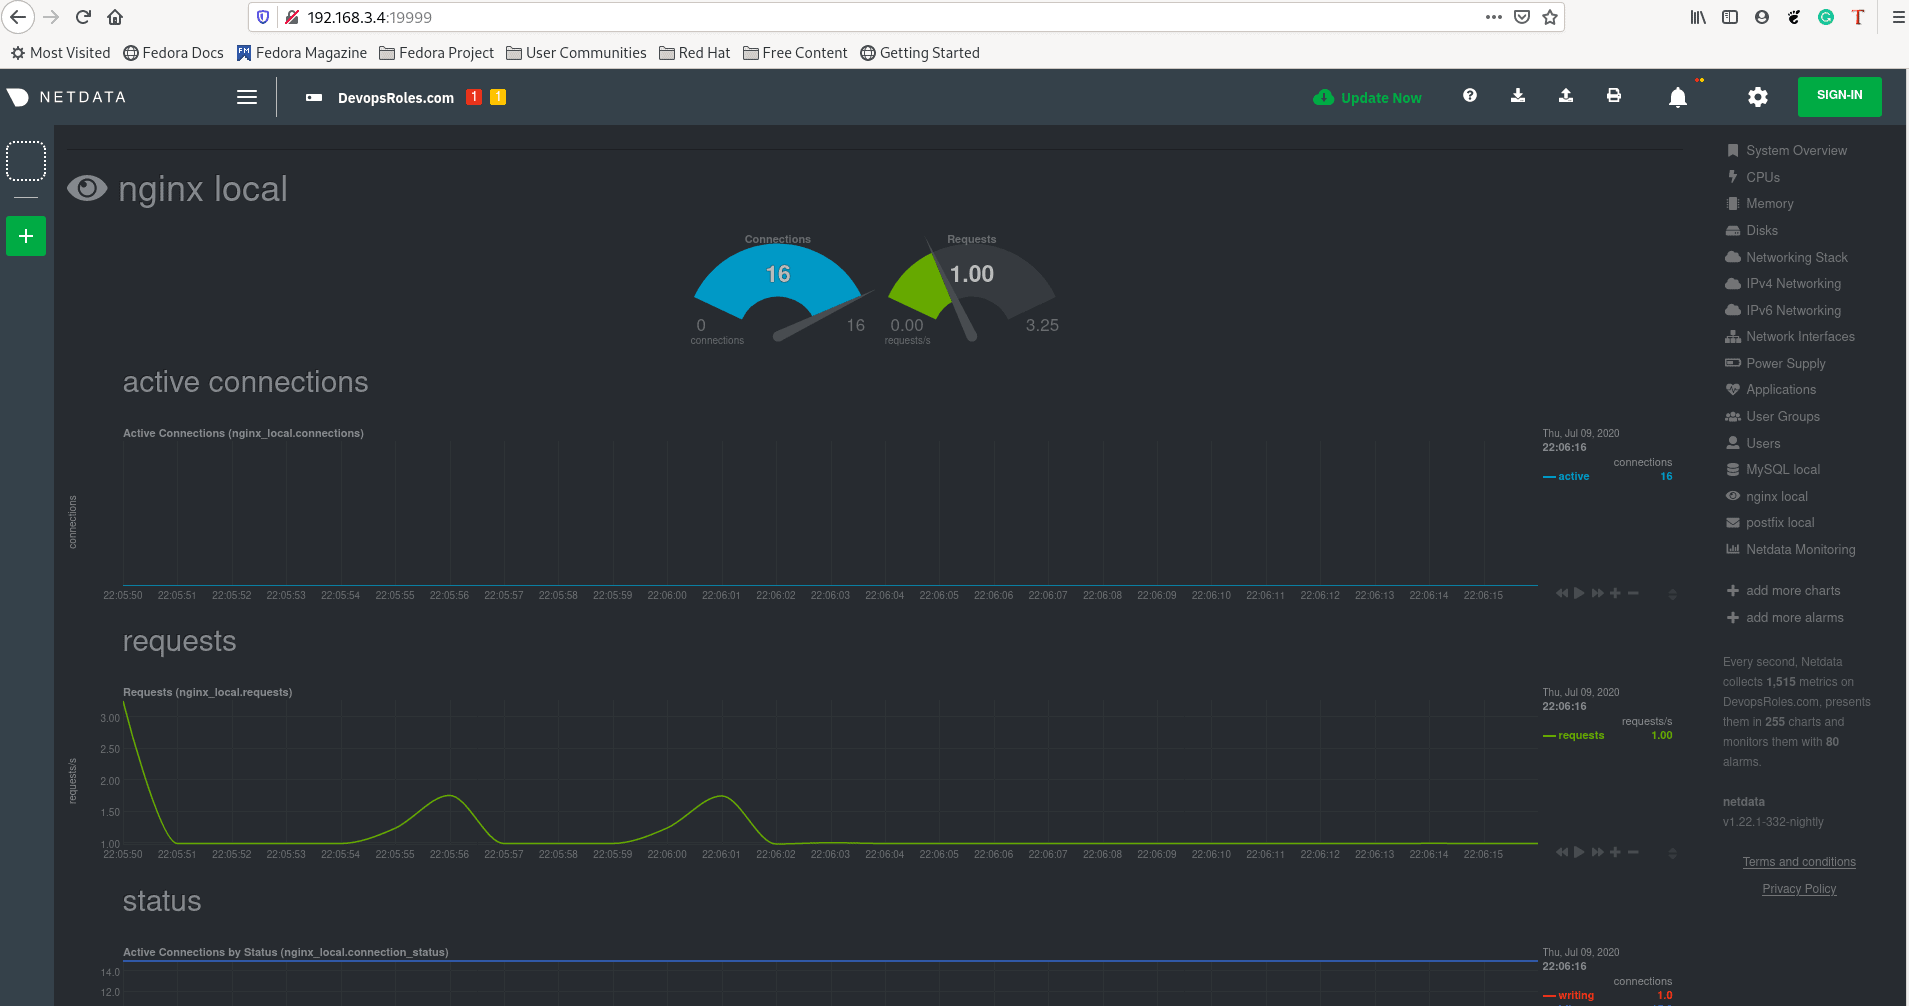
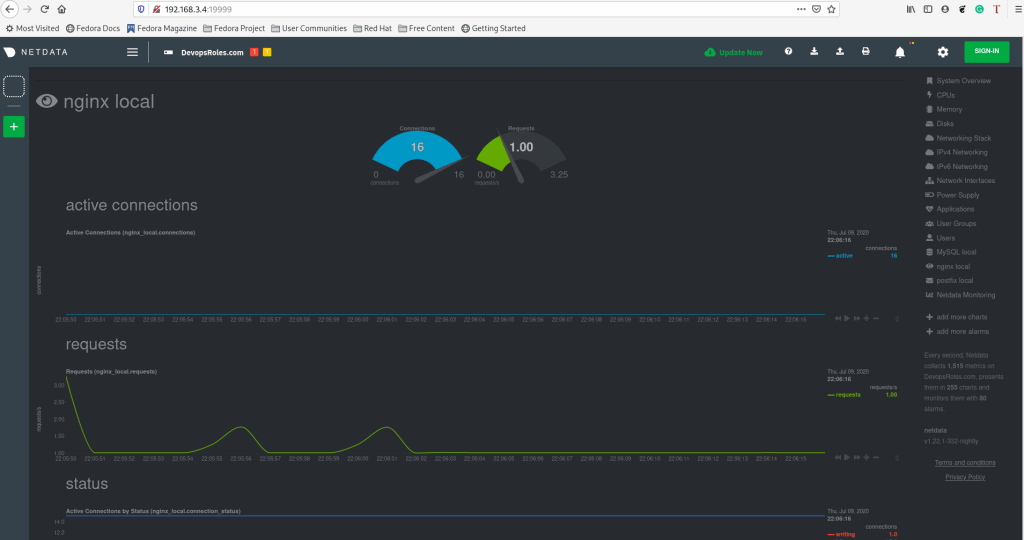
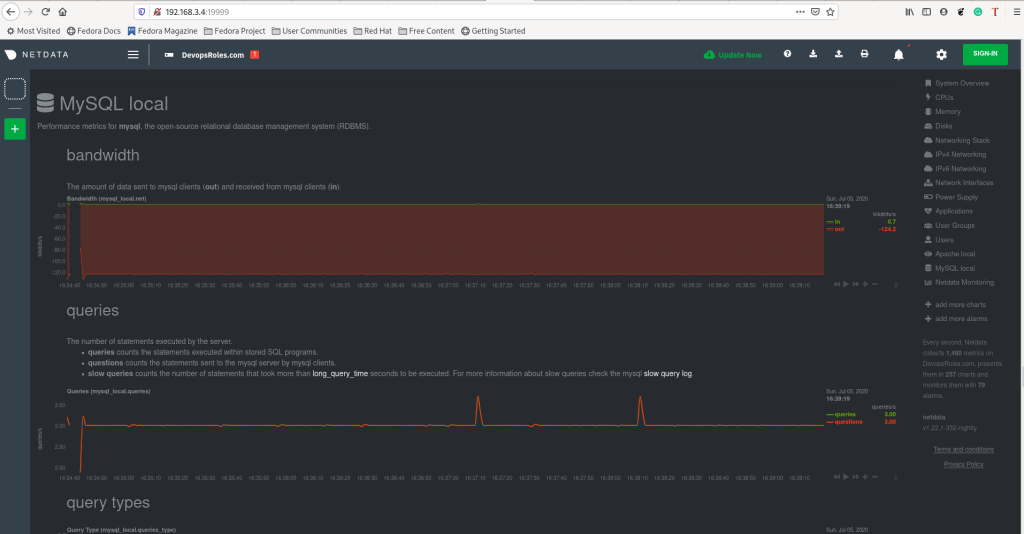
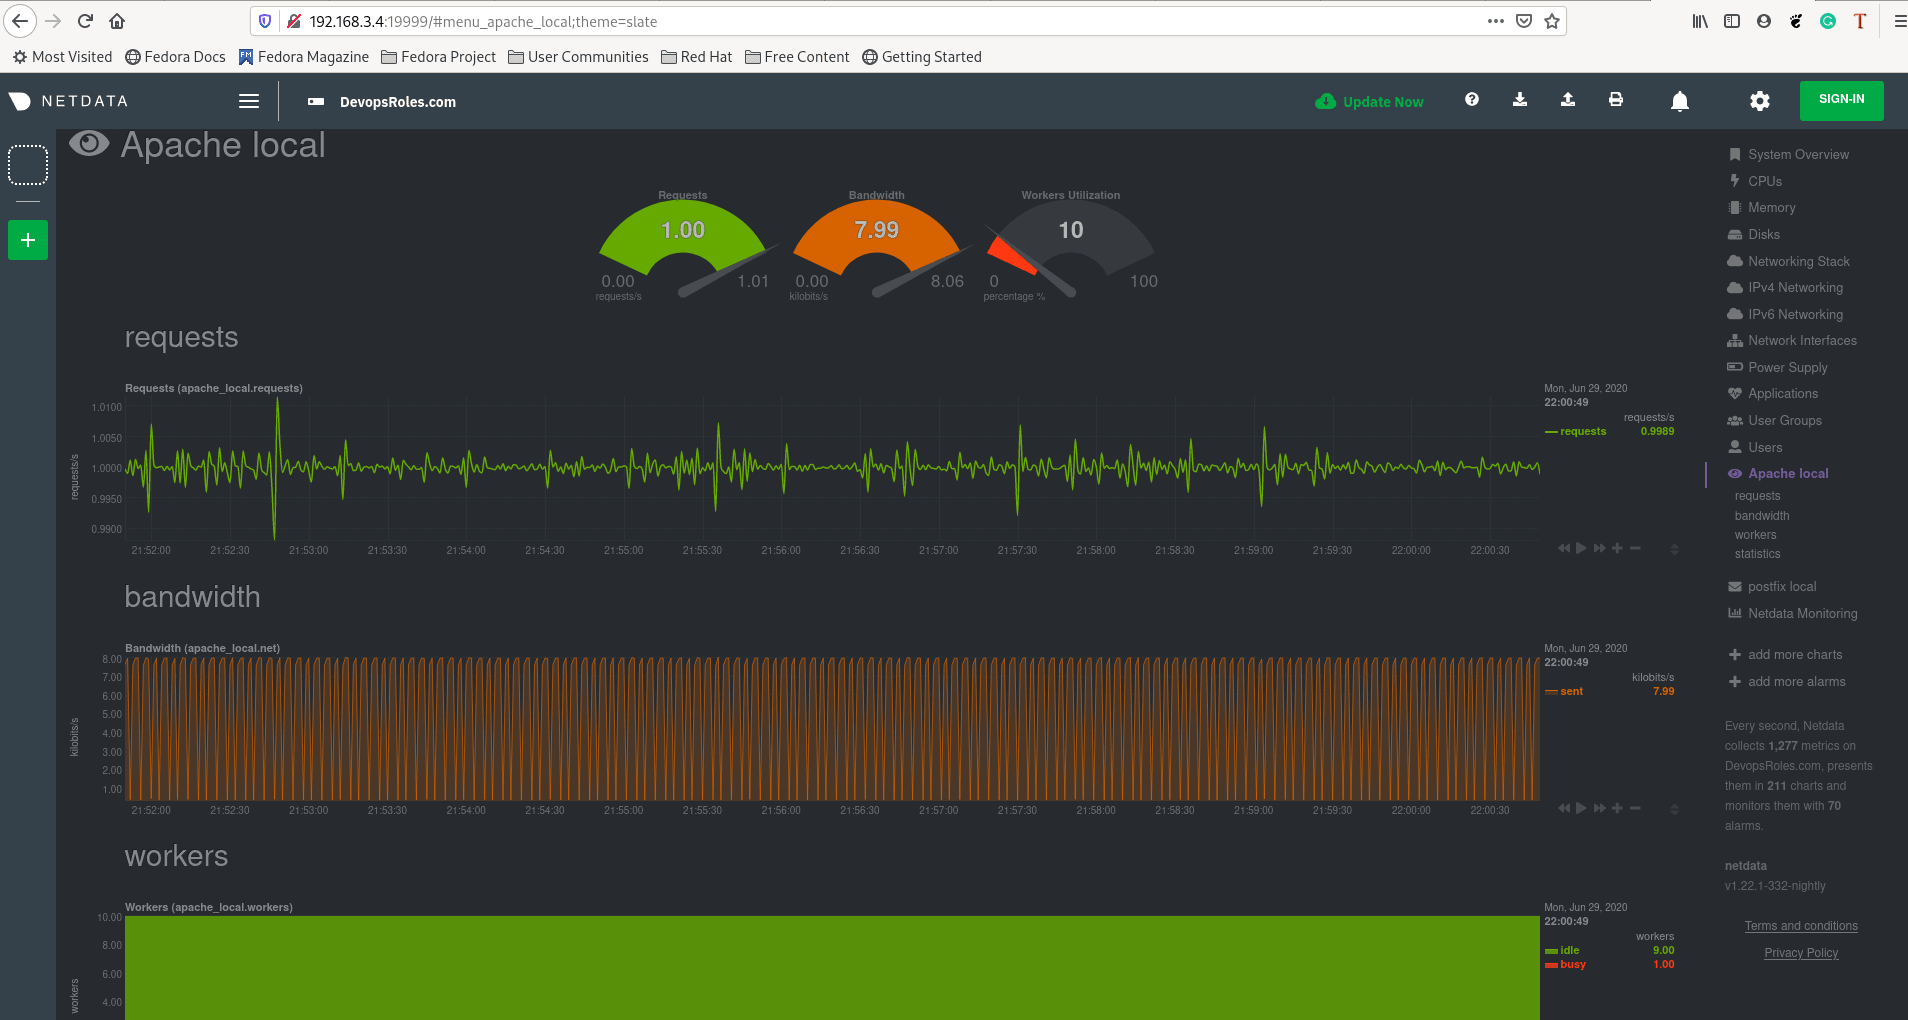
[root@DevopsRoles ~]# systemctl restart netdata 5. Using Netdata to Monitor PHP-FPM
Open a web browser access the netdata web UI.
http://NETDATA_SERVER_IP:19999
or
http://DOMAIN_NAME:19999
The result as the picture below

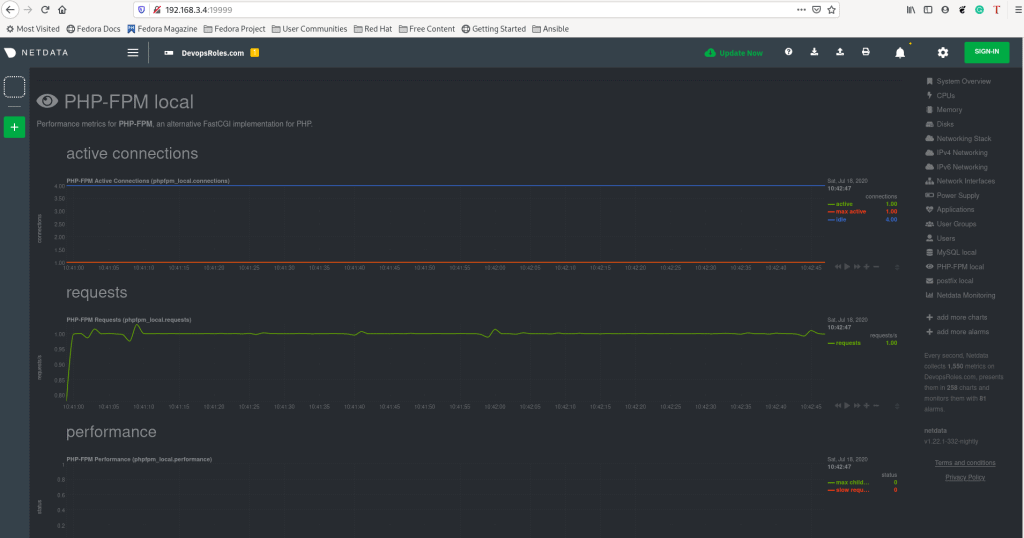
Conclusion
Through the article, you can use Netdata to monitor PHP-FPM. I hope will this your helpful. Thank you for reading the DevopsRoles page!