Introduction: If you think deploying a model is the hard part, you have clearly never tried Monitoring an ML Pipeline in a live production environment.
I learned this the hard way back in 2018.
My team deployed a flawless pricing model, went home for the weekend, and returned to a six-figure revenue loss.
Why? Because data drifts. User behavior changes. Models degrade.
Software decays predictably, but machine learning models fail silently.
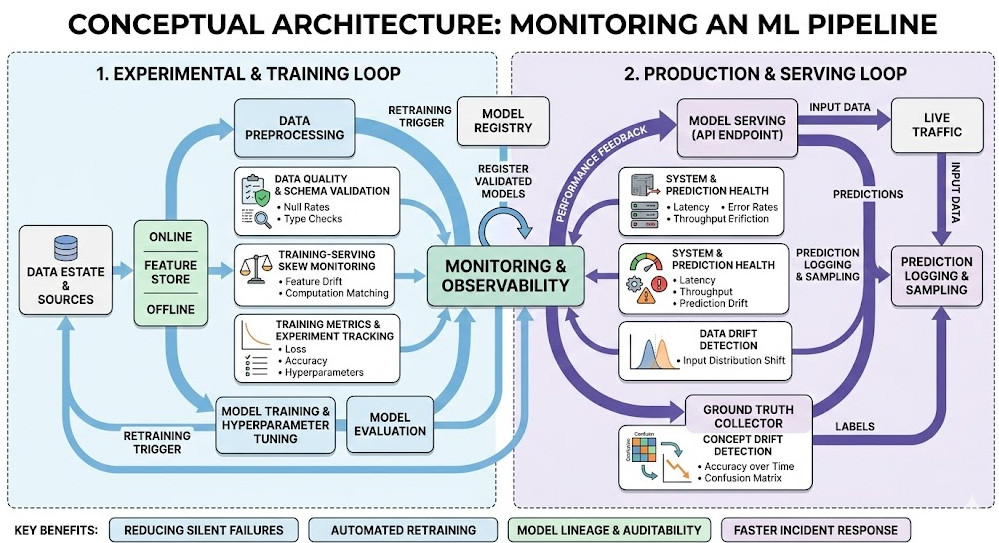
Table of Contents
The Brutal Reality of Monitoring an ML Pipeline
Let’s get one thing straight.
Standard DevOps tools won’t save you here.
You can track CPU spikes and memory leaks all day long. Your dashboard will glow a comforting, healthy green.
Meanwhile, your neural network is confidently classifying fraudulent transactions as legitimate.
Traditional APM (Application Performance Monitoring) tools are blind to the nuances of statistical drift.
You need a specialized stack. And you don’t need to pay enterprise vendors millions to build one.
Building the Stack for Monitoring an ML Pipeline
I’ve spent years ripping out bloated, expensive enterprise platforms.
Today, I strictly rely on battle-tested open-source components.
It’s cheaper, infinitely more customizable, and honestly, much more reliable.
Let’s break down the exact anatomy of a robust stack.
1. Data Logging and Ingestion: The Foundation
You can’t monitor what you don’t measure.
Every single prediction your model makes must be logged.
We use a combination of Kafka for stream processing and a fast data warehouse like ClickHouse.
You need to capture the raw input features, the model’s output, and, eventually, the ground truth.
If you don’t have a solid ingestion layer, your entire strategy for Monitoring an ML Pipeline will collapse.
2. Drift Detection: Catching Silent Failures
This is where the magic happens.
We need to detect both Data Drift (inputs changing) and Concept Drift (the relationship between inputs and outputs changing).
For this, open-source libraries are unmatched.
I highly recommend looking into tools like Evidently AI or Alibi Detect on GitHub.
They use advanced statistical tests (like Kolmogorov-Smirnov) to alert you when your data distribution shifts.
# Example: Basic Data Drift Detection using Evidently
from evidently.report import Report
from evidently.metric_preset import DataDriftPreset

def check_pipeline_drift(reference_data, current_data):
    # Initialize the drift report
    drift_report = Report(metrics=[DataDriftPreset()])

    # Calculate drift between reference and production data
    drift_report.run(reference_data=reference_data, current_data=current_data)

    return drift_report.as_dict()
Visualizing the Chaos: Dashboards That Actually Work
Alert fatigue is a massive problem in MLOps.
If your Slack channel is blowing up with false positives, your engineers will start ignoring it.
This is why visualization is a critical aspect of Monitoring an ML Pipeline.
Enter Prometheus and Grafana.
3. Time-Series Metrics with Prometheus
Prometheus is the industry standard for scraping time-series data.
We expose our drift scores and model latency metrics to Prometheus endpoints.
It acts as the central nervous system for our alerting rules.
If the drift score for a critical feature exceeds a certain threshold, Prometheus triggers an alert.
You can read more about time-series databases on Wikipedia.
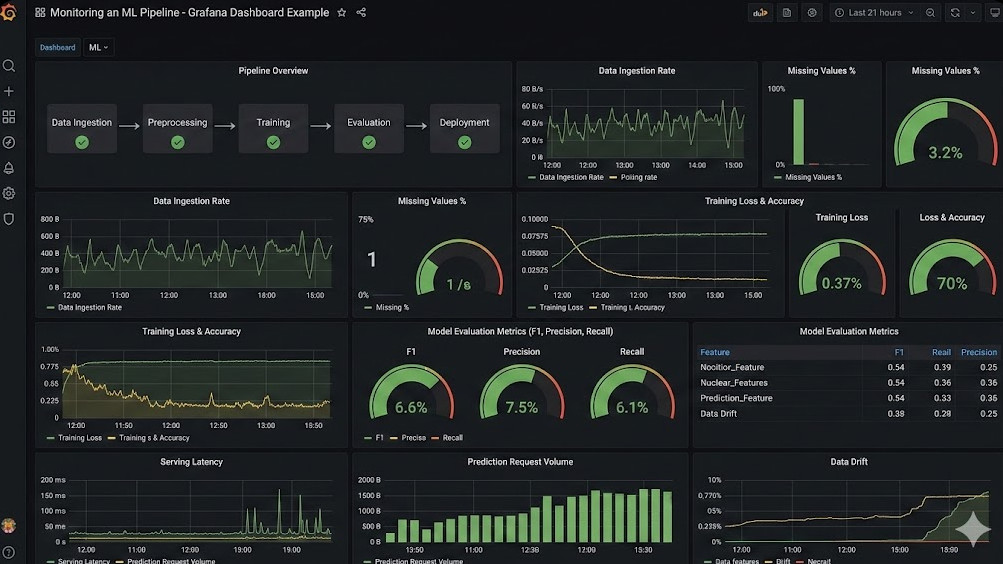
4. Grafana for Executive Sanity
Data scientists need deep dive notebooks.
But product managers need simple dashboards.
Grafana allows us to build unified views of our model’s health.
We map API latency right next to prediction distribution drift.
When revenue drops, we can instantly see if a model degradation caused it.
Tying It All Together in Production
So, how do you wire this up without creating a maintenance nightmare?
It comes down to containerization and infrastructure as code.
We package our models in Docker, deploy them via Kubernetes, and attach sidecar containers.
These sidecars handle the asynchronous logging, ensuring the main prediction thread never blocks.
For an incredibly detailed breakdown of this specific architecture, check the official documentation and tutorial here.
It’s a masterclass in assembling these disparate open-source tools into a cohesive unit.
If you want to understand how this fits into the broader data ecosystem, check out our guide on [Internal Link: Designing a Modern Data Mesh].
The Hidden Costs of Open Source
I promised you candor, so let’s be real for a second.
Open-source isn’t “free.” It costs engineering hours.
You have to maintain the Helm charts, manage the upgrades, and secure the endpoints.
But the ROI is undeniable.
When you own the stack for Monitoring an ML Pipeline, you own your destiny.
You aren’t locked into a vendor’s roadmap or restrictive pricing tiers.
FAQ Section on Monitoring an ML Pipeline
- What is the biggest mistake when Monitoring an ML Pipeline? Relying solely on software metrics (latency, error rates) instead of tracking statistical data drift and model accuracy.
- How often should I retrain my models? Only when your monitoring stack tells you to. Scheduled retraining is inefficient; trigger retraining based on significant concept drift alerts.
- Can I use ELK stack for ML monitoring? Yes, Elasticsearch/Kibana works for log aggregation, but you still need specialized libraries to calculate statistical drift before sending that data to ELK.
- Is Prometheus strictly for DevOps? Not anymore. Exposing ML-specific metrics (like prediction confidence intervals) to Prometheus is now an MLOps best practice.
Conclusion: Stop flying blind. Monitoring an ML Pipeline is not an optional afterthought; it is the core of sustainable AI. By leveraging tools like evidently, Prometheus, and Grafana, you can build an enterprise-grade safety net for a fraction of the cost. Start logging your predictions today, because silent model failure is the most expensive technical debt you can carry.
Would you like me to generate an automated script that deploys this exact Grafana/Prometheus MLOps stack via Docker Compose? Thank you for reading the DevopsRoles page!