
The modern application stack is no longer monolithic. When you introduce Machine Learning models—whether they are called via dedicated microservices or embedded directly into the application logic—you fundamentally change the complexity profile. A simple CRUD application suddenly gains the unpredictable variables of data drift, inference latency, and model versioning.
For senior DevOps, MLOps, and SecOps engineers, this shift presents a critical challenge. Traditional monitoring, which often relies solely on HTTP status codes and CPU utilization, is insufficient. It only tells you if the service is down, but not why the AI prediction failed or which specific data input caused the drift.
This deep dive provides a comprehensive, architecturally sound guide to achieving true Observability for Rails. We will move beyond basic logging and implement a full-spectrum observability pipeline capable of handling the unique demands of AI-powered backends.

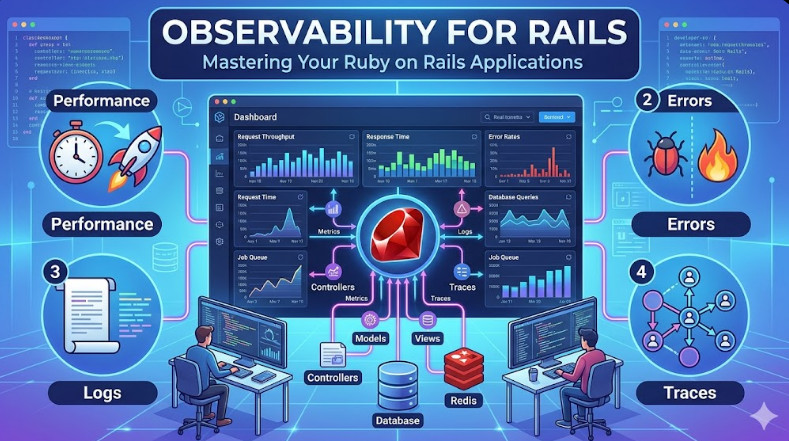
Table of Contents
Phase 1: Core Architecture and the Observability Pillars
True observability is not a single tool; it is an architectural capability built upon three pillars: Metrics, Logs, and Traces. When integrating AI, we must add a fourth, equally critical pillar: Model Observability.
The Rails AI Stack Challenge
Consider a typical Rails application that uses an ML model. The request flows: User $\rightarrow$ Rails Controller $\rightarrow$ Job Queue (Sidekiq) $\rightarrow$ External ML API Call $\rightarrow$ Rails Controller $\rightarrow$ Response.
The failure point could be anywhere: network latency to the ML API, schema mismatch in the input data, or the model itself having degraded performance (drift).
To capture this, we must adopt the OpenTelemetry (OTel) standard. OTel provides vendor-agnostic instrumentation, ensuring that whether you use Jaeger, Zipkin, or a proprietary backend, your instrumentation remains consistent.
Architectural Blueprint
A robust Observability for Rails stack requires the following components:
- Instrumentation Layer: Use OpenTelemetry Ruby SDKs to instrument every critical path. This includes HTTP requests, database queries, and crucially, the ML client calls.
- Collection Layer: A collector (e.g., OpenTelemetry Collector) receives data streams (metrics, logs, traces) and exports them to the backend.
- Storage/Query Layer: A scalable backend (e.g., Prometheus/Mimir for metrics, Loki for logs, Tempo for traces).
- Analysis Layer: A visualization and alerting tool (e.g., Grafana) that correlates data across all three pillars.
💡 Pro Tip: When instrumenting background jobs (like those handled by Sidekiq), do not rely solely on the job worker’s start/stop logs. Instead, wrap the entire job execution within an OpenTelemetry Span. This ensures that the job’s internal logic—including external API calls—is correctly linked to the originating web request’s trace ID, providing end-to-end visibility.
Phase 2: Practical Implementation: Instrumenting the ML Call
Let’s assume we have a Rails service object, PredictionService, that makes an external call to a model endpoint. We need to instrument this call to capture not just success/failure, but also the input parameters and the resulting confidence score.
Step 1: Implementing OpenTelemetry Tracing in Rails
We must ensure the Rails middleware correctly initializes the trace context.
# config/initializers/opentelemetry.rb
Rails.application.config.middleware.use OpenTelemetry::Instrumentation::Middleware

# Example of manually starting a span around the core logic
def perform_prediction(data)
  # Start a dedicated span for the external ML call
  OpenTelemetry.tracer_provider.tracer('my.app.ml_service').in_span('ml_api_call') do |span|
    span.set_attribute('input.schema', data.keys.join(','))
    span.set_attribute('user.id', current_user.id)

    # Simulate the external API call
    response = ExternalMLClient.call(data)

    # Record the ML-specific metric/attribute
    span.set_attribute('prediction.confidence', response[:confidence])
    span.set_attribute('prediction.model_version', 'v2.1')

    response
  end
end
Step 2: Capturing Custom Metrics and Logs
Beyond tracing, we need dedicated metrics. We should track the rate of successful predictions versus those that fail due to schema validation or timeout.
We use a dedicated metrics library (like prometheus-client or the OTel metrics API) to record these counts.
# app/services/prediction_service.rb
class PredictionService
  # Assume a global Prometheus counter is initialized
  ML_SUCCESS_COUNTER = Prometheus::Client.registry.counter(:ml_predictions_total, 'Total predictions processed')

  def call(data)
    begin
      # ... (API call logic) ...

      # Increment the success counter and label it by model version
      ML_SUCCESS_COUNTER.increment(labels: { model_version: 'v2.1', status: 'success' })
      return { confidence: 0.95 }

    rescue SchemaError => e
      # Critical: Log the schema failure and increment a failure counter
      Rails.logger.warn("Schema validation failed: #{e.message}")
      ML_SUCCESS_COUNTER.increment(labels: { model_version: 'v2.1', status: 'schema_fail' })
      raise
    end
  end
end
This combination of tracing (the path of the failure), metrics (the rate of the failure), and structured logging (the details of the failure) provides the necessary depth for true Observability for Rails.
Phase 3: Senior-Level Best Practices and MLOps Integration
For senior engineers, the goal shifts from merely collecting data to acting on it. This requires integrating the observability pipeline with MLOps and SecOps workflows.
1. Detecting Model Drift and Data Skew
The most unique challenge in AI applications is Model Drift. The model was trained on historical data (the training distribution), but the live input data (the serving distribution) changes over time. This degradation is invisible to standard HTTP monitoring.
Solution: Implement a dedicated data quality check before the prediction call.
- Input Schema Validation: Use a library like Dry-Schema to validate incoming data against the expected schema. Log and alert immediately if the schema deviates.
- Statistical Drift Monitoring: Calculate statistical metrics (e.g., mean, standard deviation, correlation matrices) of the incoming feature vectors. Compare these against the baseline statistics derived from the training dataset.
- Actionable Alerting: If the statistical distance (e.g., using Earth Mover’s Distance or Kolmogorov-Smirnov test) exceeds a predefined threshold, the system must trigger a high-priority alert, indicating potential model deprecation, rather than just a generic “error.”
2. SecOps: Tracing and Data Lineage
From a security perspective, every transaction must be auditable. Observability for Rails must extend to data lineage.
When a prediction is made, the trace must record:
- The identity of the calling user (User ID).
- The specific version of the model used (Model Version).
- The input data hash (Input Data Hash).
This allows security teams to reconstruct exactly what data led to a specific, potentially malicious, prediction, fulfilling compliance requirements.
3. Cost and Resource Optimization
AI services are expensive. A sudden spike in inference calls, even if successful, can lead to massive cloud bills.
Solution: Treat API calls as a resource metric. Track the cost per prediction call, integrating this into your metrics dashboard. Use rate limiting and circuit breakers (like those provided by circuit_breaker gem or service mesh tools like Istio) and monitor the failure rate of these protective mechanisms.
💡 Pro Tip: To achieve maximum performance visibility, consider leveraging eBPF (extended Berkeley Packet Filter). By deploying eBPF probes, you can capture network and system call metrics outside the application runtime, providing unparalleled insight into network latency and resource contention without requiring deep code instrumentation.
4. The Observability Lifecycle and SLOs
The ultimate goal is defining and maintaining Service Level Objectives (SLOs). For an AI service, SLOs must be multi-dimensional:
- Availability SLO: (e.g., 99.9% of requests must return a status code 200).
- Latency SLO: (e.g., 95th percentile prediction latency must be < 500ms).
- Quality SLO: (e.g., Model drift detection must trigger an alert within 5 minutes of a significant data shift).
If any SLO is breached, the system must automatically alert the responsible team, potentially triggering a rollback to a stable model version.
For further reading on the comprehensive lifecycle of managing complex applications, review the resources available at https://www.devopsroles.com/.
Conclusion: Building Resilience with Observability
Achieving deep Observability for Rails in an AI-powered context is a shift from reactive debugging to proactive system intelligence. By standardizing on OpenTelemetry, implementing dedicated ML metrics, and integrating security and cost monitoring into your SLO definitions, you build a system that is not only resilient but also fully auditable.
This robust approach ensures that when the next unpredictable data shift occurs, your team will not be blind—they will know precisely where, why, and how the system is failing.