

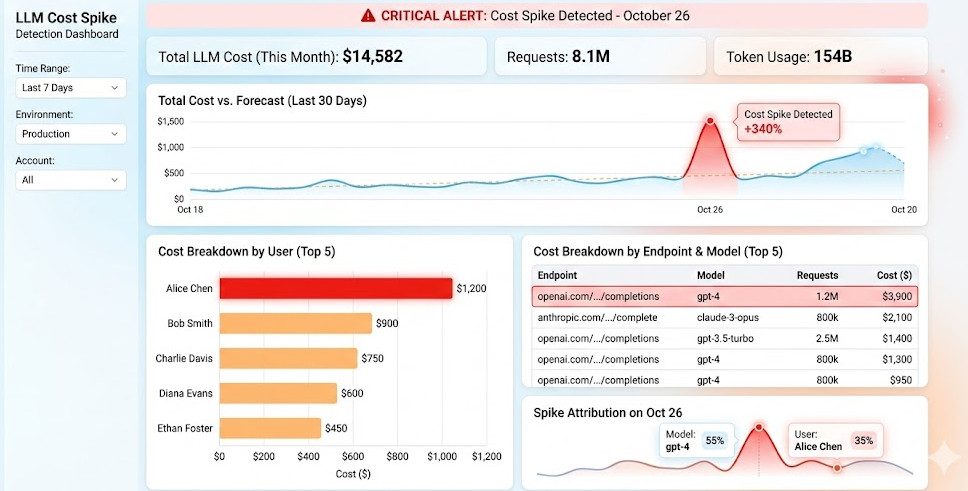
Introduction: I still remember the cold sweat. I woke up to a $14,000 OpenAI bill because a junior developer left a recursive agent running over the weekend. That was the day I realized LLM Cost Spike Detection isn’t just a nice-to-have; it’s a matter of startup survival.
You are probably flying blind right now.
Most teams rely on vendor dashboards that update 24 hours too late. By the time you see the spike, the cash is already gone.
Sure, you could install a bulky third-party SDK. But why add more dependency nightmares to your stack?

Today, we are doing it the veteran way. No fluff. No vendor lock-in.
We will build a transparent interception layer. We will capture everything at the network level.
For a fantastic overview of this exact methodology, check out this deep dive on no-SDK tracking in production.
Table of Contents
Why LLM Cost Spike Detection Requires a No-SDK Approach
I hate SDKs for telemetry. There, I said it.
Every time you add a new tracking SDK, you bloat your application. You add latency. You risk version conflicts with your core libraries.
When dealing with generative AI, speed is everything. Your users won’t wait an extra 500ms for your telemetry to fire.
“If your observability tool brings down your app, it’s not a tool. It’s a liability.”
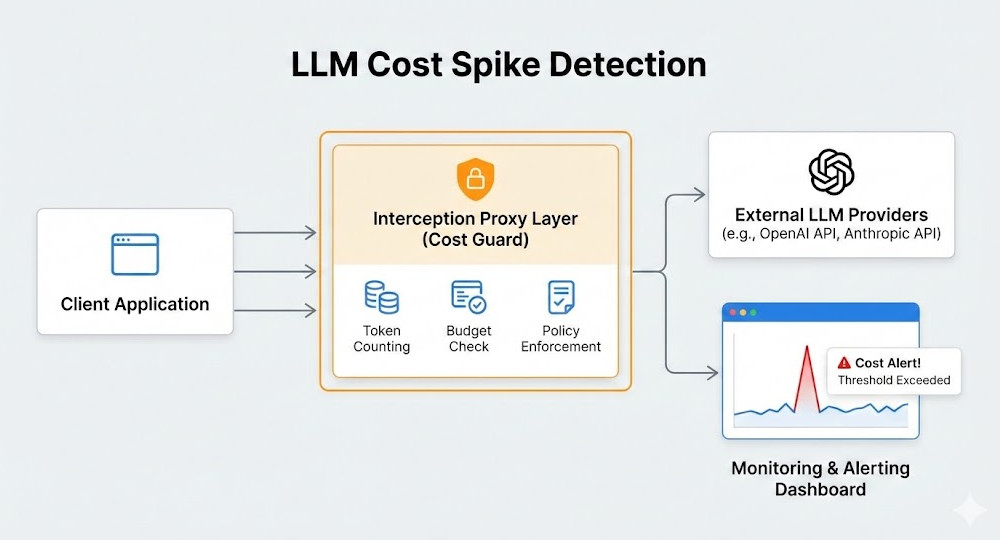
The “No-SDK” method relies on a proxy or API gateway. It sits between your application and the LLM provider (like OpenAI or Anthropic).
Your app makes a standard HTTP request. The proxy catches it.
The proxy logs the tokens, calculates the cost, and forwards the request. Your app remains completely ignorant of the tracking.
This is the secret to zero-friction observability. You get real-time data without touching a single line of your core business logic.
Core Pillars of LLM Cost Spike Detection
To stop the bleeding, you need granular data. A single “Total Cost” metric is useless during an outage.
If your bill spikes by $500 in an hour, you need to know exactly where the leak is happening.
We break this down into three essential pillars.
1. LLM Cost Spike Detection by Endpoint
Not all features are created equal.
Your “Summarize Document” endpoint might consume 10,000 tokens per call. Your “Chat” endpoint might only use 500.
- Isolate the noise: By tagging costs per internal endpoint, you can instantly see which feature is draining your budget.
- Set specific budgets: Chat might get a $50/day limit, while document processing gets $200.
- Catch infinite loops: If a specific microservice suddenly fires 1,000 requests a minute, you kill that service, not your whole app.
To achieve this, inject a custom header into your outbound requests. Something simple like X-Internal-Endpoint: document-summarizer.
Your gateway reads this header and groups the token usage accordingly.
2. Tracking by Specific User
I once had a single beta tester account for 40% of our API costs.
He was using our AI tool to write his entire university thesis. Smart kid, but terrible for our margins.
If you aren’t passing user IDs to your tracking layer, you are making a massive mistake.
- Pass
X-User-ID: 98765in your request headers. - Log the input and output tokens against that specific ID.
- Set rate limits based on cost, not just request volume.
This allows you to implement soft and hard caps. When a user hits $5 in generation costs, send an alert.
When they hit $10, cut them off automatically. This is proactive protection.
If you want to read more about rate limiting strategies, read our guide on [Internal Link: API Gateway Rate Limiting Best Practices].
3. Monitoring by PromptVersion
Prompt engineering is basically voodoo magic right now.
You tweak one sentence, and suddenly your output is better. But did you check the token count?
I’ve seen prompt updates inadvertently double the context window. The quality went up 5%, but costs increased by 100%.
- Version your prompts like you version your code. (e.g., v1.2, v2.0).
- Send
X-Prompt-Version: v2.1in your headers. - Run A/B tests to compare the cost-efficiency of different prompts.
This is how mature engineering teams operate. They treat prompts as immutable, measurable assets.
Implementing Your LLM Cost Spike Detection Proxy
So, how do we actually build this? It’s easier than you think.
You can use an off-the-shelf reverse proxy like Nginx, or write a lightweight middleware in Python or Go.
Here is a basic example using FastAPI to act as a transparent proxy. It intercepts the request, reads the custom headers, and calculates the cost.
import httpx
from fastapi import FastAPI, Request, HTTPException
import logging

app = FastAPI()
# Target LLM API
OPENAI_URL = "https://api.openai.com/v1/chat/completions"

# Simple cost dictionary (mock example)
COST_PER_1K_TOKENS = {"gpt-4-turbo": 0.01}

@app.post("/proxy/openai")
async def proxy_llm(request: Request):
    headers = dict(request.headers)

    # Extract our custom No-SDK tracking headers
    internal_endpoint = headers.pop("x-internal-endpoint", "unknown")
    user_id = headers.pop("x-user-id", "anonymous")
    prompt_version = headers.pop("x-prompt-version", "v0")

    body = await request.json()
    model = body.get("model", "gpt-4-turbo")

    async with httpx.AsyncClient() as client:
        # Forward the request to actual LLM provider
        response = await client.post(OPENAI_URL, json=body, headers=headers)

    if response.status_code == 200:
        data = response.json()
        usage = data.get("usage", {})
        total_tokens = usage.get("total_tokens", 0)

        # Calculate cost
        cost = (total_tokens / 1000) * COST_PER_1K_TOKENS.get(model, 0.0)

        # Log asynchronously to your time-series DB (e.g. ClickHouse)
        logging.info(f"COST_EVENT: endpoint={internal_endpoint} user={user_id} version={prompt_version} cost=${cost}")

    return response.json()
Notice how clean this is? The core application simply points its base URL to our proxy instead of directly to OpenAI.
We stripped out our custom headers before forwarding the request. OpenAI never sees them.
We grabbed the exact token count directly from the provider’s response. No need to run expensive tiktoken calculations locally.
Data Storage and Alerting
Logging to standard out is fine for a demo. In production, you need a time-series database.
I highly recommend ClickHouse or Prometheus for this. They ingest massive amounts of data and query it in milliseconds.
Once your proxy is firing data into Prometheus, you wire it up to Grafana.
Now, you set up your anomaly detection.
- Static Thresholds: Alert if User X spends more than $10 in 1 hour.
- Rate of Change: Alert if the cost on Endpoint Y jumps 300% compared to the last 5 minutes.
- Dead Letter Alerts: Alert if the prompt version is suddenly missing from the headers.
Push these alerts directly to PagerDuty or Slack. When a spike happens, you want your phone to ring immediately.
For more advanced alerting strategies, refer to the Prometheus documentation.
The Hidden Benefit: Latency Monitoring
While you are building this LLM Cost Spike Detection setup, you get latency tracking for free.
LLM providers are notorious for degrading performance during peak hours.
Your proxy measures the exact time between the request and the response. You can now track “Cost per Millisecond” or “Tokens per Second.”
If GPT-4 starts taking 30 seconds to respond, your proxy can automatically route the traffic to a faster, cheaper model like Claude Haiku.
This is what we call dynamic fallback routing. It saves money and preserves the user experience.
Advanced Techniques: Streaming Responses
I know what you are thinking. “But I use streaming responses for my chat UI!”
Streaming complicates things, but the No-SDK approach still works perfectly.
When you stream data via Server-Sent Events (SSE), OpenAI does not send the usage block by default in older API versions.
However, modern API updates now allow you to request the usage data in the final chunk of the stream.
- Ensure you pass
stream_options: {"include_usage": true}in your payload. - Have your proxy intercept the stream, yielding chunks to the client instantly.
- When the final chunk arrives, parse the token count and log the cost.
You maintain a snappy, typing-effect UI for the user, while still getting perfectly accurate billing data.
FAQ Section
- Does a proxy add latency? Yes, but it’s negligible. A well-written proxy in Rust or Go adds roughly 2-5ms of overhead. You won’t notice it on a 2-second LLM generation.
- Can I use an API Gateway instead? Absolutely. Tools like Kong, Tyk, or AWS API Gateway can be configured to read headers and log usage metrics.
- What if the provider changes their pricing? You update the pricing dictionary in your proxy. Your core app doesn’t need a code deployment.
- Is LLM Cost Spike Detection hard to maintain? No. It’s much easier to maintain one centralized proxy than updating SDKs across 15 different microservices.

Conclusion: Blindly trusting your cloud bills is a rookie mistake. Implementing a No-SDK LLM Cost Spike Detection system gives you the ultimate control over your AI infrastructure.
By tracking usage at the endpoint, user, and prompt version levels, you turn unpredictable AI expenses into manageable, optimized SaaS metrics.
Stop paying the “stupid tax” to API providers. Build your proxy, tag your headers, and take your budget back today.Thank you for reading the DevopsRoles page!