
Grafana is tool monitoring and Data visualization with support InfluxDB, Graphite, Prometheus, Elasticsearch, and many more databases. In this tutorial,…

Install nslookup on Linux
In this tutorial, How to install nslookup on Linux. nslookup is part of the bind-utils package. The package bind-utils is…

TKPROF using trace analyzer to trace SQL
In this tutorial, How to TKPROF using trace analyzer to trace SQL in Oracle Database Server. The syntax TKPROF command…
Install Prometheus on RHEL / CentOS 7
In this tutorial, How to install Prometheus on RHEL / CentOS 7. Prometheus is an open-source monitoring system and time…
Install InfluxDB on RHEL / Centos 7
In this tutorial, How to install InfluxDB on RHEL / Centos 7. InfluxDB is an open-source time-series database. It is…
Install Netdata on RHEL 7 / CENTOS 7
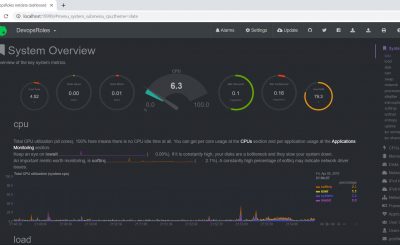
In this tutorial, How to install Netdata on RHEL 7 / CENTOS 7. Netdata is performance and health monitoring for…
Quick start install Elasticsearch and Kibana with Docker
In this tutorial, How to Quickstart install Elasticsearch and Kibana with Docker. Elasticssearch: localhost:9200 Kibana: localhost:5601 Docker-compose start with Docker-compose…

Jenkins checkout Pipeline Multibranch
In this tutorial, How to use Jenkins checkout Pipeline Multibranch. For example with Git, the scm reference a GitSCM Object.…

Ansible structure playbook
In this tutorial, I wrote about the Ansible structure playbook. What does the Ansible structure playbook mean? Let’s begin! A…
create user and group in Linux
In this tutorial, I will quickly guide create user and group in Linux. How to add a user to a…